ABSTRACT:Introduction: Alcohol use is one of the main preventable risk factors afecting mortality and premature disability. Objective: To describe the estimates of mortality and years of life lost as a result of premature death (YLL) due to cirrhosis, liver cancer, and disorders attributed to alcohol use in Brazil and its federated units in 1990 and 2015. Methods: Descriptive study using data from the Global Burden of Disease Study (2015) and the Mortality Information System (SIM). Statistical models were used to obtain corrected mortality estimates for selected causes. Rates were standardized by age. Results: In 1990, 16,226 deaths were estimated for the three conditions (17.0/100 thousand inhabitants), while in 2015 there were 28,337 deaths (15.7/100 thousand inhabitants). There was a reduction in mortality (per 100 thousand) due to cirrhosis (from 11.4 to 9.5), stability in mortality rates related to liver cancer (1.5 and 1.9), and stability in mortality rates caused by alcohol use disorders (4.1 and 4.3). Mortality rates were 5.1 times higher among men, and the ive states with the highest mortality rates and YLL were from the Northeast Region: Sergipe, Ceará, Pernambuco, Paraíba, and Alagoas. Mortality and YLL rates for the three conditions studied increased in the ranking of causes of death in both sexes, with the exception of cirrhosis in the female population. Conclusion: The three conditions studied are responsible for a signiicant burden of premature mortality in Brazil, especially among men and residents of the northeast region. These results reinforce the urgent need for public policies that address harmful alcohol consumption in Brazil.
Keywords: Ethanol. Liver cirrhosis. Liver neoplasms. Alcohol-related disorders. Mortality, premature. Epidemiology, descriptive.
Mortality due to cirrhosis, liver cancer, and
disorders attributed to alcohol use: Global
Burden of Disease in Brazil, 1990 and 2015
Mortalidade por cirrose, câncer hepático e transtornos devidos
ao uso de álcool: Carga Global de Doenças no Brasil, 1990 e 2015
Ana Paula Souto MeloI, Elisabeth Barboza FrançaII, Deborah Carvalho MaltaIII,
Leila Posenato GarciaIV, Meghan MooneyV, Mohsen NaghaviV
ISchool of Medicine of the Universidade Federal de São João Del-Rei – Divinópolis (MG), Brazil. IISchool of Medicine of the Universidade Federal de Minas Gerais – Belo Horizonte (MG), Brazil. IIISchool of Nursing of the Universidade Federal de Minas Gerais – Belo Horizonte (MG), Brazil. IVInstituto de Pesquisa Econômica Aplicada – Brasília (DF), Brazil.
VInstitute for Health Metrics and Evaluation– Seattle, United States of America.
Corresponding author: Ana Paula Souto Melo. Universidade Federal de São João Del-Rei. Faculdade de Medicina. Avenida Sebastião Gonçalves Coelho, 400, sala 209A, Chanadour, CEP: 35501-296, Divinópolis, MG, Brasil. E-mail: [email protected] Conlict of interests: nothing to declare – Financial support: Bill & Melinda Gates Foundation (GBD Global) and Ministry of Health (GBD 2015 Brazil-states), through the National Health Fund (Process No. 25000192049/2014-14).
INTRODUCTION
The harmful use of alcohol is responsible for a high burden of disease, with import-ant social and economic consequences. In countries with lower income, the risks of morbidity and mortality are higher per liter of alcohol consumed than in those with higher income1. Data from the Global Burden of Diseases (GBD) study in 2015 indi-cate that, from 1990 to 2015, alcohol abuse rose from eleventh to ninth position in the ranking of the leading risk factors to disability-adjusted life years (DALYs)2. Of the total deaths in 2012, 5.9% were attributable to alcohol, with 7.6% among men and 4.0% among women. Of the total DALYs, it is estimated that 5.1% were attributable to alco-hol, with a higher proportion of alcohol-related burden of disease among men (7.4%) compared with women (2.3%)1.
In Brazil, data from the National Health Survey (2013) showed that the prevalence of heavy drinking was 13.7% in the adult population – 3.3 times higher among men (21.6%) than in women (6.6%)3. Data from the World Health Organization (WHO) for Brazil in 2010 indicate a prevalence of alcohol abuse/dependence of 5.6% for both sexes, 8.2% among men, and 3.2% among women1. In 2015, alcohol ranked ifth in risk factors with the most signiicant contribution to DALYs for both sexes in Brazil4.
Rehm et al.5 argue that the higher mean volume of alcohol consumed is associated with an increased risk for many chronic and infectious diseases. In addition, the consumption
RESUMO:Introdução: O uso de álcool é um dos principais fatores de risco preveníveis para mortalidade ou incapacidade prematuras. Objetivo: Descrever as estimativas de mortalidade e anos de vida perdidos por morte prematura (YLL) por cirrose, câncer hepático e transtornos devidos ao uso de álcool no Brasil e suas unidades da federação (UFs), em 1990 e 2015. Métodos: Estudo descritivo com dados do estudo de Carga Global de Doenças (2015) e do Sistema de Informações sobre Mortalidade (SIM). Modelos estatísticos foram empregados para obter estimativas corrigidas de mortalidade pelas causas selecionadas. As taxas de mortalidade foram padronizadas por idade (TMPI). Resultados: Em 1990, foram estimados 16.226 óbitos para as 3 condições (17,0/100 mil habitantes), enquanto em 2015 foram 28.337 (15,7/100 mil habitantes). Houve redução da mortalidade (por 100 mil habitantes) por cirrose (de 11,4 para 9,5) e estabilidade por câncer hepático (1,5 e 1,9) e transtornos devidos ao uso de álcool (4,1 e 4,3). As TMPI foram 5,1 vezes maiores entre os homens, e as 5 UFs com maiores TMPI e YLL foram da Região Nordeste: Sergipe, Ceará, Pernambuco, Paraíba e Alagoas. As taxas de mortalidade e de YLL pelas três condições estudadas ascenderam no ranking das causas de óbito, em ambos os sexos, exceto a cirrose no feminino.
Conclusão: As três condições estudadas são responsáveis por importante carga de mortalidade prematura no Brasil, principalmente entre homens e residentes na região nordeste. Esses resultados reforçam a necessidade de políticas públicas para o enfrentamento ao consumo nocivo do álcool no Brasil.
pattern (i.e. heavy drinking) adds an additional risk to the mean volume for certain catego-ries of diseases and injucatego-ries. The authors argue that alcohol is a necessary cause (conditions that occur only as a result of alcohol consumption) for more than 30 conditions listed in the International Statistical Classiication of Diseases and Related Health Problems, 10th Revision (ICD-10). In addition, alcohol can be a component cause for more than 200 conditions listed in ICD-10, among them cardiovascular diseases and neoplasias, besides being an important risk factor for transportation accidents and other types of accidents, violence, injuries, sui-cides, and so forth1,6,7.
Among the diseases attributed to alcohol consumption, liver cirrhosis must be high-lighted as a significant chronic fatal morbidity. It is estimated that 48% of deaths and 47% of DALYs due to cirrhosis are attributed to alcohol consumption8-10. Liver can-cer is, in turn, a neoplasm in which alcohol consumption is an important component cause8,10. According to the study “GBD Brazil 2010”, alcohol use disorders and lower back pain were the causes of DALYs that demonstrated the greatest growth among men from 1990 to 201011.
Considering the relevance of these diseases as causes of death, the objective of this study is to describe the estimates of mortality and years of life lost due to cirrhosis, liver cancer, and disorders due to alcohol use in Brazil and its 27 states (heretofore referred to as Federated Units, or FUs) in 1990 and 2015.
METHODS
A descriptive analysis was performed with data from the GBD 2015 study coordinated by the Institute for Health Metrics and Evaluation (IHME) of the University of Washington. Estimates of disease loads were obtained according to the method deined by the IHME and were applied in 2015.
The GBD study included the mapping of data sources for diseases, risk factors, and inju-ries. The main source of information on mortality in Brazil is the Ministry of Health’s Mortality Information System (acronym in Portuguese – SIM), which uses the ICD to cod-ify causes of death. To calculate GDB estimates, ill-deined causes (IDC) and other garbage codes are employed so that deaths classiied under these codes are redistributed to deined causes of death to minimize underestimation of the indicators. Details of the clustering of causes using the ninth and tenth revisions of the ICD (ICD-9 and ICD-10, respectively) were previously described12.
proportionally distribute deaths from cirrhosis and hepatic cancer from all causes in order to obtain the speciic estimates for these diseases due to alcohol use15.
In this study, the main causes of death related to alcohol use identiied in GBD 2015 were initially investigated; among them the three main conditions were selected: cirrhosis, liver cancer, and disorders due to alcohol use. Deaths among individuals aged 15 years and older classiied in the following ICD-10 (2015) codes and their correlates in ICD-9 (1990) were included:
1. Cirrhosis due to alcohol use: ICD-10: B18-B18,9, I85-I85,9, I98,2, K70-K70,9, K71,3-K71,51, K71,7, K72,1-K74,69, K74,9, K75,8-K76,0, K76,6- K76,7, K76,9 e ICD-9: 070.22-070.23, 070.32-070.33, 070.44, 070.54, 456.0-456.21, 571-571.9, 572.3-572.9, 573.0-573.3, 573.8-573.9;
2. Liver cancer due to alcohol use: ICD-10: C22-C22.9, D13.4 e ICD-9: 155-155.9, 211.5;
3. Alcohol use disorders: ICD-10: mental and behavioral disorders related to alcohol use (F10-F10.99), alcoholic myopathy (G72.1), degeneration of the nervous system due to alcohol (G31.2), fetus and newborn afected by alcohol use by the mother (P04.3), fetal alcohol syndrome (dysphoric) (Q86.0), presence of alcohol in the blood (R78.0), poisoning (intoxication) by exposure to alcohol (X45-X45.9), and ICD9: 291-291.9, 303-303.93, 305.0-305.03, 357.5, 790.3, E860-E860.19.
The following indicators were estimated: absolute numbers of deaths, specific mor-tality rates and YLL – total data and sexes and age groups, for Brazil and its 27 FUs, in 1990 and 2015. The YLL expresses the effect of premature deaths on the popu-lation. This indicator is calculated by multiplying the number of deaths of specific cause by life expectancy in relation to the age of death, regardless of sex (for exam-ple: 85.69 years for deaths in children under 1 year of age, 23.79 years for individu-als aged 65 years).
In order to produce standardized rates by age of mortality and YLL (per 100,000 inhab-itants), the direct standardization method was used, based on the world population devel-oped for GBD 20132.
To compare the indicators between 1990 and 2015, the ranking of the FUs was per-formed according to the values standardized by age of mortality and YLL of the three con-ditions studied15.
In addition, the uncertainty intervals (95% UI) of the standardized rates of mortal-ity due to cirrhosis, liver cancer, and disorders due to alcohol use were estimated for Brazil and FUs. The 95% uncertainty intervals are different from the confidence inter-vals and express the uncertainty derived from the sample sizes of the studies used as data sources, the adjustments to the general mortality sources, the parameter uncer-tainty in the estimation of the model, and the unceruncer-tainty specification for the models for causes of death2.
RESULTS
The number of deaths due to cirrhosis, liver cancer, and disorders due to alcohol use in 1990 was, respectively, 10,707, 1,088, and 4,431, totaling 16,226 deaths in Brazil. In 2015 the rates were 18,923, 3,326, and 9,088 respectively, totaling 28,337 deaths in the country. There was a 75% increase in the absolute number of deaths by the three conditions. In 2015, the age group with the highest number of deaths from these causes was 50 to 59 years (n = 8,011, 28.3%). In 1990, the same age group registered 3,607 deaths (22.3%). Comparing mortality rates by age (IMR) between 1990 and 2015, it is observed that in 1990, individuals were dying earlier because of these conditions, with the highest mortality rates in the 40 years age group. In 2015, higher mortality rates are observed after 50 years of age. The peak of mortality alcohol use disorders occurs earlier in the 40–49 age group compared to cirrhosis (50–54 years) and liver can-cer (65 years and over) (Figure 1).
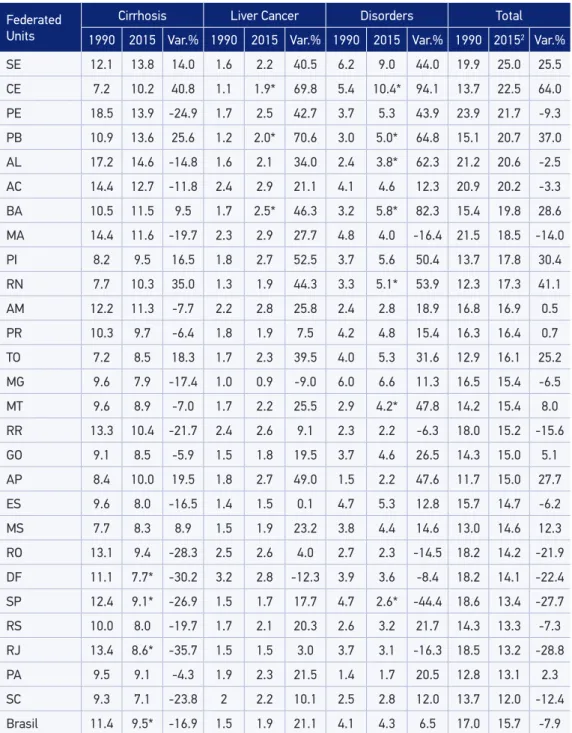
Table 1 shows age-standardized mortality rates (ASMR) for both sexes. Data from 1990 to 2015 suggest a reduction in ASMR for all three causes of death from 17.0 to 15.7/100 thou-sand inhabitants (7.9%). This decline was due to the reduction in ASMR due to cirrhosis attributed to alcohol use (from 11.4 to 9.5) (16.9%), and there was stability in cancer mortality and alcohol use disorders. Although there were changes in the ranking of FUs with higher rates, northeastern states predominated in the irst positions, in both years. In 1990, the ive FUs with the highest ASMR due to disorders, liver cirrhosis, and cancer due to alcohol use per 100,000 inhabitants were: Pernambuco (23.9), Maranhão (21.5), Alagoas (21.1), Acre (20.9), and Sergipe (19.9). In 2015, the FUs were Sergipe (25.0), Ceará (22.5), Pernambuco (21.7), Paraíba (20.7), and Alagoas (20.6). There is a signiicant increase in estimates for the three conditions from 1990 to 2015, mainly in the states: Ceará (64%, from 13.7 to 22.5/100 thou-sand inhabitants), Rio Grande do Norte (41%, 12.3 to 17.3/100 thou22.5/100 thou-sand inhabitants), and Paraíba (37%, from 15.0 to 20.7/100 thousand inhabitants). In 2015, the state that presented the lowest ASMR was Santa Catarina (12.0). The states with the greatest relative reductions in rates from 1990 to 2015 were Rio de Janeiro (28.8%, from 18.5 to 13.2/100 thousand inhab-itants), São Paulo (27.7%, 18, 6 to 13.4/100 thousand inhabinhab-itants), and the Federal District (22.4%, from 18.2 to 14.1/100 thousand inhabitants). However, from 1990 to 2015, several states had ASMR growth of alcohol use disorders. Only São Paulo showed statistically sig-niicant reduction of ASMR of alcohol use disorders (Table 1).
For all three causes in 2015, men had a ASMR of 27.5/100 thousand inhabitants and women of 5.4/100 thousand inhabitants, that is, the ratios between the rates indicated a 5.1-fold higher risk for men when compared to women. When this ratio is observed for each condition studied, the risk is, respectively, 9.0; 4.7 and 3.0 times greater among men for alcohol use disorders, liver cirrhosis, and cancer than for women (Figure 2).
1990 and rose to the eighteenth position in 2015, while liver cancer due to alcohol use rose from 77th to 71st position, and alcohol use disorders were in the 44th position and ascended to the 37th position in the same period (Table 2).
Source: http://www.healthdata.org/results/data-visualizations
Figure 1. Number of deaths due to cirrhosis, liver cancer, and disorders due to alcohol use, according to age groups, Brazil, 1990 and 2015.
Brazil, both sexes, 1990
Number of deaths
2,500
2,000
1,500
1,000
500
0
0-6 days7-27 days
28-364 days1-4 years5-9 years10-14 years15-19 years20-24 years25-29 years30-34 years35-39 years40-44 years45-49 years50-54 years55-59 years60-64 years65-69 years70-74 years75-79 years80+years
Brazil, both sexes, 2015
Number of deaths
4,500
4,000
3,000 3,500
2,500
1,000 1,500
500 2,000
0
0-6 days7-27 days
28-364 days1-4 years5-9 years10-14 years15-19 years20-24 years25-29 years30-34 years35-39 years40-44 years45-49 years50-54 years55-59 years60-64 years65-69 years70-74 years75-79 years80+years
Alcohol use disorders
Cirrohosis due to alcohol
Federated Units
Cirrhosis Liver Cancer Disorders Total
1990 2015 Var.% 1990 2015 Var.% 1990 2015 Var.% 1990 20152 Var.%
SE 12.1 13.8 14.0 1.6 2.2 40.5 6.2 9.0 44.0 19.9 25.0 25.5
CE 7.2 10.2 40.8 1.1 1.9* 69.8 5.4 10.4* 94.1 13.7 22.5 64.0
PE 18.5 13.9 -24.9 1.7 2.5 42.7 3.7 5.3 43.9 23.9 21.7 -9.3
PB 10.9 13.6 25.6 1.2 2.0* 70.6 3.0 5.0* 64.8 15.1 20.7 37.0
AL 17.2 14.6 -14.8 1.6 2.1 34.0 2.4 3.8* 62.3 21.2 20.6 -2.5
AC 14.4 12.7 -11.8 2.4 2.9 21.1 4.1 4.6 12.3 20.9 20.2 -3.3
BA 10.5 11.5 9.5 1.7 2.5* 46.3 3.2 5.8* 82.3 15.4 19.8 28.6
MA 14.4 11.6 -19.7 2.3 2.9 27.7 4.8 4.0 -16.4 21.5 18.5 -14.0
PI 8.2 9.5 16.5 1.8 2.7 52.5 3.7 5.6 50.4 13.7 17.8 30.4
RN 7.7 10.3 35.0 1.3 1.9 44.3 3.3 5.1* 53.9 12.3 17.3 41.1
AM 12.2 11.3 -7.7 2.2 2.8 25.8 2.4 2.8 18.9 16.8 16.9 0.5
PR 10.3 9.7 -6.4 1.8 1.9 7.5 4.2 4.8 15.4 16.3 16.4 0.7
TO 7.2 8.5 18.3 1.7 2.3 39.5 4.0 5.3 31.6 12.9 16.1 25.2
MG 9.6 7.9 -17.4 1.0 0.9 -9.0 6.0 6.6 11.3 16.5 15.4 -6.5
MT 9.6 8.9 -7.0 1.7 2.2 25.5 2.9 4.2* 47.8 14.2 15.4 8.0
RR 13.3 10.4 -21.7 2.4 2.6 9.1 2.3 2.2 -6.3 18.0 15.2 -15.6
GO 9.1 8.5 -5.9 1.5 1.8 19.5 3.7 4.6 26.5 14.3 15.0 5.1
AP 8.4 10.0 19.5 1.8 2.7 49.0 1.5 2.2 47.6 11.7 15.0 27.7
ES 9.6 8.0 -16.5 1.4 1.5 0.1 4.7 5.3 12.8 15.7 14.7 -6.2
MS 7.7 8.3 8.9 1.5 1.9 23.2 3.8 4.4 14.6 13.0 14.6 12.3
RO 13.1 9.4 -28.3 2.5 2.6 4.0 2.7 2.3 -14.5 18.2 14.2 -21.9
DF 11.1 7.7* -30.2 3.2 2.8 -12.3 3.9 3.6 -8.4 18.2 14.1 -22.4
SP 12.4 9.1* -26.9 1.5 1.7 17.7 4.7 2.6* -44.4 18.6 13.4 -27.7
RS 10.0 8.0 -19.7 1.7 2.1 20.3 2.6 3.2 21.7 14.3 13.3 -7.3
RJ 13.4 8.6* -35.7 1.5 1.5 3.0 3.7 3.1 -16.3 18.5 13.2 -28.8
PA 9.5 9.1 -4.3 1.9 2.3 21.5 1.4 1.7 20.5 12.8 13.1 2.3
SC 9.3 7.1 -23.8 2 2.2 10.1 2.5 2.8 12.0 13.7 12.0 -12.4
Brasil 11.4 9.5* -16.9 1.5 1.9 21.1 4.1 4.3 6.5 17.0 15.7 -7.9
1Mortality rates standardized by sex and age, based on the world population developed for the Global Burden
of Diseases 2013; var: variation; 2federated units ordered from the highest to the lowest mortality rate due to
alcohol use disorders, cirrhosis and cancer in 2015; * Rates with statistically significant changes in uncertainty
intervals (95% UI).
Table 1. Standardized mortality rates1 for cirrhosis, liver cancer, and disorders due to
It is important to consider that the ranking of causes of death difers between the sexes. From 1990 to 2015, ranking of cirrhosis, liver cancer, and disorders due to alcohol use among men rose, respectively, from the 15th to the 13th position, from the 38th to the 28th posi-tion, and from the 68th to the 60th position. Among women, positions are relatively lower than among men, but all rose in the same period, from 32nd to 30th position, from 83d to 76th, and from 85th to 79th position, respectively (Table 2).
In the ranking of YLL rates, from 1990 to 2015, we observed a rise in the causes stud-ied. In both sexes, cirrhosis rose from the twentieth position to the seventeenth, hepatic cancer increased from the 98th to the 77th, and alcohol use disorders rose from the 42nd to the 35th position. Among men and women, there was also a rise in ranking positions, except for cirrhosis among women, which declined from 34th to 36th (Table 2).
The ive states with the highest YLL standardized rates for the three conditions stud-ied in 2015 were Sergipe, Ceará, Pernambuco, Paraíba, and Alagoas. The state with the highest YLL rate was Sergipe (1604.9/100 thousand inhabitants) and the lowest was Pará (695.1/100 thousand inhabitants). The impact of this indicator (YLL) among men is greater than among women. Among women, the ive states with the highest YLL rates belong to the northeast region: Alagoas, Sergipe, Bahia, Pernambuco, and Maranhão, as well as among men (Figure 3).
DISCUSSION
The study indicates a reduction in the age-standardized mortality rate (ASMR) per 100,000 inhabitants for cirrhosis attributed to alcohol use (16.9%), which contributed
1Mortality rates standardized by sex and age, based on the world population developed for the Global Burden of
Diseases 2013.
Figure 2. Standardized mortality rates1 for cirrhosis, liver cancer, and disorders due to alcohol
use (per 100,000 inhabitants), by sex, Brazil 1990 and 2015.
25
20
15
10
05
00
Cirrohosis due to alcohol
Liver cancer due to alcohol
Alcohol use disorders
Cirrohosis due to alcohol
Liver cancer due to alcohol
Alcohol use disorders
Male Female
1990 2005 19.7
16.5
2.3 3.0
7.5 8.1
4.3 3.5
Cause 1990 2015 Variation (%)
Position Rate Position Rate
Mortality
Both sexes
Cirrhosis due to alcohol 19 11.4 18 9.5 -16.9
Alcohol use disorders 44 4.1 37 4.3 6.5
Liver cancer due to alcohol 77 1.5 71 1.9 21.1
Female
Cirrhosis due to alcohol 32 4.3 30 3.5 -17.9
Alcohol use disorders 83 1.0 76 1.0 5.5
Liver cancer due to alcohol 85 0.9 79 0.9 -3.4
Male
Cirrhosis due to alcohol 15 19.7 13 16.5 -16.3
Alcohol use disorders 38 7.5 28 8.1 9.0
Liver cancer due to alcohol 68 2.3 60 3.0 28.8
Years of Life Lost Due to Premature Death (YLL)
Both sexes
Cirrhosis due to alcohol 20 352.3 17 277.2 -21.3
Alcohol use disorders 42 151.5 35 149.1 -1.5
Liver cancer due to alcohol 98 31.8 77 37.8 19.0
Female
Cirrhosis due to alcohol 34 119.1 36 91.1 -23.5
Alcohol use disorders 84 34.1 75 29.4 -13.8
Liver cancer due to alcohol 111 19.6 88 20.0 1.9
Male
Cirrhosis due to alcohol 17 607.1 13 483.4 -20.4
Alcohol use disorders 32 276.3 26 278.8 0.9
Liver cancer due to alcohol 89 46.7 66 59.4 27.3
Source: http://www.healthdata,org/results/data-visualizations
1Mortality rates and years of life lost due to premature death, standardized by sex and age, based on the world
population developed for the Global Burden of Diseases 2013.
Table 2. Ranking of standardized1 mortality rates and years of life lost due to cirrhosis, liver cancer,
67% of all deaths by the three causes studied in 2015. According to Mokdad et al.9, a reduc-tion of the standard rate for cirrhosis was also observed from 1980 to 2010, of which 22% was attributed mainly to population growth and aging. Excessive alcohol consumption is probably the leading cause of liver cirrhosis in most parts of Latin America. However, large reductions in mortality from cirrhosis in Mexico and Chile were observed without signif-icant changes in alcohol consumption. The changes in patterns of alcohol consumption at meals and the type of alcohol consumed could explain these still unclear tendencies in Latin American societies9.
In contrast, it is important to emphasize the stability of ASMR due to liver cancer and alcohol use disorders among the studied years, indicating the persistence of the impact of alcohol abuse under these conditions. In 2015, Brazil was the South American coun-try with the highest ASMR caused by alcohol use disorders (4.31/100 thousand inhabi-tants)4. In addition, it ranks third in the mortality rate caused by alcohol-induced cirrho-sis (9.48/100 thousand inhabitants), behind only Bolivia and Guyana4. In the GBD 2015 study, all three conditions had a reduction in global standardized mortality rates between 2005 and 2015, from -3.1% for liver cancer due to alcohol use and -11.0% for cirrhosis due
Source: http://www.healthdata,org/results/data-visualizations
YLL: years of life lost due to premature death.
1Rate of life years lost due to premature death standardized by sex and age, with the world population developed for
the Global Burden of Diseases as a standard.
Figure 3. Standardized rates1 of the years of life lost (YLL) due to premature death due to cirrhosis,
liver cancer, and disorders due to the use of alcohol, by sex, by Federation Units in Brazil, 1990 and 2015.
Men, YLL rate, 2015
1.600 1.400 1.200 1.000 800 600 400 200 0
Women, YLL rate, 2015
Pará Santa Catarina Rondônia Roraima Rio de Janeiro Amapá Rio Grande do Sul São Paulo Mato Grosso Distrito Federal Mato Grosso do Sul Tocantins Goiás Amazonas Brasil Espírito Santo Minas Gerais Paraná Maranhão Piauí Rio Grande do Norte Acre Bahia Alagoas Paraíba Pernambuco Ceará Sergipe
-400 100 600 1.100 1.600
Alcohol use disorders
Cirrohosis caused by alcohol
to alcohol use. It is worth noting the reduction in the rate for alcohol use disorders in the world (-29.2%), whereas this study showed an increase in Brazil (+6.5%), especially in the northeast region2. Between 2006 and 2012, it was observed that although the number of people who drank alcohol in Brazil did not increase, the quantitiy and frequency of their drinking did in fact increase16. However, this aspect needs further investigation to clarify the variations in ASMR. While investigating mortality for which alcohol consumption is a necessary cause among the Americans between 2007 and 2009, Gawryszewski and Monteiro17 found that Brazil belonged to the group of ive countries with the highest mortality rates due to these causes, after Mexico, Guatemala, Nicaragua, and El Salvador.
In Brazil, the ive states that presented the highest ASMR for the three conditions studied belong to the northeast region: Sergipe, Ceará, Pernambuco, Paraíba, and Alagoas. This ind-ing may relect the higher alcohol consumption in this region, as well as in the north, as evidenced by the Surveillance System for Risk and Protective Factors for Chronic Diseases by Telephone Inquiry (Vigitel) and the National Health Survey (acronym in Portuguese – PNS) 20133,18. Garcia et al. 19 also found that, from 2010 to 2012, residents in smaller munic-ipalities, and in the northeast and midwest regions had the highest mortality rates due to conditions in which alcohol was a necessary cause.
The results indicate that the ratios among standardized mortality rates were 5.1 times higher among men compared with women in 2015. Harmful use of alcohol was the major risk factor for the death of men in the age group of 15–59 years. However, there is evi-dence that women may be more vulnerable to alcohol-related harm at lower levels of consumption and at a younger age than men20. In Brazil, the PNS 2013 showed that the prevalence of heavy drinking at least once in the 30 days prior to the survey was higher among men (21.6%), compared with women (6.6%), and that men consume alcohol more frequently and in greater quantity than women3. In addition, abusive alcohol consump-tion is among the ive highest risk factors among men in Brazil from the period between 1990 and 2010 (84%)11.
ASMR has shown an increase in more advanced age groups from 1990 to 2015. It is argued that the increasing burden of alcohol-related diseases among the more advanced age groups is a growing public health problem due to the rapid aging of the population in many countries of the world20. This can be explained by the nature of these causes of death, which, with the exception of acute alcohol intoxication, have a long period of induction, such as cirrhosis of the liver19,21.
This study presents some limitations, especially those related to the coverage and quality of SIM, with inequalities among Brazilian FUs. Although the SIM has experienced marked improve-ments since the 1990s, some states in 2010, especially those located in the north and northeast regions, still had coverage of less than 90% and proportions of deaths classiied as “ill-deined causes” greater than 10%. In this sense, despite the corrections of the estimates used in GBD 2015, there may be limitations depending on the methods involved. It should be noted that as GBD methods are constantly evolving, the estimates generated are not comparable to those of previous studies. In addition, the GBD methodology implies that the models of etiologic ratio for the subcauses of liver cancer depend on the availability of data sources that report on local patterns of liver cancer etiology, as well as age patterns, which may have interfered in the esti-mates for Brazil. Nevertheless, the GBD approach produces estiesti-mates that allow comparisons between regions and countries and can be useful in tracking the impact of problems related to alcohol use in Brazil.
CONCLUSION
Although the three conditions studied in this article are among the main necessary causes of death due to the consumption of alcohol, it is known that the mortality attributable to alco-hol encompasses many more conditions for which alcoalco-hol is a necessary or component cause. In the world, the highest numbers of deaths related to alcohol use are cardiovascular diseases, followed by injuries (especially unintentional injuries), gastrointestinal diseases (mainly cir-rhosis of the liver), and cancers1. Furthermore, the damages caused by alcohol also extend to family members, neighbors, and the greater community23. Therefore, these data urgently call for public policies in Brazil that address harmful alcohol consumption, one of the main pre-ventable risk factors for mortality and premature disability. Little has been done in this ield to combat the harmful use of alcohol, especially when compared to what was achieved in the ight against smoking in the country. Among the best practice policies recommended by WHO for alcoholic beverages are limiting availability, restricting advertising, and raising prices through taxation, as well as measures to combat the “alcohol and steering” combination1,24. In addition, authors20 have discussed the urgent need to increase support for research to evalu-ate evidence, monitor progress, and reduce the gap between research, communities, and pub-lic popub-licies. Only with advances in these areas can we hope to address alcohol abuse in Brazil.
1. World Health Organization. Global status report on alcohol and health – 2014 Genebra: WHO; 2014. Disponível em: http://apps.who.int/iris/ bitstream/10665/112736/1/9789240692763_eng. pdf (Acessado em 05 de dezembro de 2016.
2. GBD 2015 Mortality and Causes of Death Collaborators. Global, regional, and national life expectancy, all-cause mortality, and cause-speciic mortality for 249 causes of death, 1980-2015: a systematic analysis for the Global Burden of Disease Study 2015. The Lancet 2016; 388: 1459-544.
3. Garcia LP, Freitas LRS. Heavy drinking in Brazil: results from the 2013 National Health Survey. Epidemiol Serv Saúde [Internet] 2015 Jun.; 24(2): 227-37. Disponível em: http://www.scielo.br/scielo.php?script=sci_ arttext&pid=S2237-96222015000200227&lng=en (Acessado em 7 de janeiro de 2017).
4. Institute for Health Metrics and Evaluation (IHME). Data Visualization. Disponível em: http://www. healthdata.org/results/data-visualizations (Acessado em 22 de outubro de 2016).
5. Rehm J, Baliunas D, Borges GL, Graham K, Irving H, Kehoe T, et al. The relation between different dimensions of alcohol consumption and burden of disease: an overview. Addiction 2010; 105(5): 817-43.
6. Malta DC, Bernal RTI, Silva MMA, Claro RM, Silva Júnior JB, Reis AAC. Consumo de bebidas alcoólicas e direção de veículos, balanço da lei seca, Brasil 2007 a 2013. Rev Saúde Pública 2014; 48(4): 692-6.
7. Mascarenhas MDM, Malta DC, Silva MMA, Gazal-Carvalho C, Monteiro RA, Morais Neto OL. Consumo de álcool entre vítimas de acidentes e violências atendidas em serviços de emergência no Brasil, 2006 e 2007. Ciênc Saúde Coletiva 2009; 14(5): 1789-96.
8. Rehm J, Taylor B, Mohapatra S, Irving H, Baliunas D, Patra J, et al. Alcohol as a risk factor for liver cirrhosis: a systematic review and meta-analysis. Drug Alcohol Rev 2010; 29: 437-45.
9. Mokdad AA, Lopez AD, Shahraz S, Lozano R, Mokdad AH, Stanaway J, et al. Liver cirrhosis mortality in 187 countries between 1980 and 2010: a systematic analysis BMC Medicine 2014 Set. 18; 12(1): 145.
10. Roerecke M, Rehm J. Alcohol use disorders and mortality: a systematic review and meta-analysis. Addiction 2013 Set.; 108(9): 1562-78.
11. Marinho F, Passos VMA, França EB. Novo século, novos desaios: mudança no peril da carga de doença no Brasil de 1990 a 2010. Epidemiol Serv Saúde [Internet] 2016 Dez.; 25(4): 713-24. Disponível em: http://www.scielo.br/pdf/ress/v25n4/2237-9622-ress-25-04-00713.pdf (Acessado em 6 de janeiro de 2017).
12. Lozano R, Naghavi M, Foreman K, Lim S, Shibuya K, Aboyans V, et al. Global and regional mortality from 235 causes of death for 20 age groups in 1990 and 2010: a systematic analysis for the Global Burden of Disease Study 2010. The Lancet 2012; 380(9859): 2095-128.
13. Forouzanfar MH, Afshin A, Alexander LT, Anderson HR, Bhutta ZA, Biryukov S, et al. Global, regional,
and national comparative risk assessment of 79 behavioural, environmental and occupational, and metabolic risks or clusters of risks, 1990–2015: a systematic analysis for the Global Burden of Disease Study 2015. The Lancet 2016; 388(10053): 1659-724.
14. Foreman KJ, Lozano R, Lopez AD, Murray CJL. Modeling causes of death: an integrated approach using CODEm. Popul Health Metr 2012; 10: 1. DOI: 10,1186/1478-7954-10-1.
15. GBD 2015 Mortality and Causes of Death Collaborators. Global, regional, and national life expectancy, all-cause mortality, and cause-speciic mortality for 249 causes of death, 1980-2015: a systematic analysis for the Global Burden of Disease Study 2015. The Lancet 2016; 388(10053): 1459-544.
16. Laranjeira R, Madruga C, Pinsky I, Caetano R, Mitsuhiro S. Consumo de álcool no Brasil: tendências entre 2006/2012. II Levantamento Nacional de Álcool e Drogas (LENAD). Disponível em: http://inpad.org.br/lenad/resultados/alcool/ resultados-preliminares/ (Acessado em 09 de janeiro de 2017).
17. Gawryszewski VP, Monteiro MG. Mortality from diseases, conditions and injuries where alcohol is a necessary cause in the Americas, 2007-09. Addiction 2014; 109(4): 570-7.
18. Brasil. Ministério da Saúde. Secretaria de Vigilância em Saúde. Vigitel Brasil 2013: vigilância de fatores de risco e proteção para doenças crônicas por inquérito telefônico/Ministério da Saúde, Secretaria de Vigilância em Saúde. Brasília: Ministério da Saúde; 2014.
19. Garcia LP, Freitas LRS, Gawryszewski VP, Duarte EC. Uso de álcool como causa necessária de morte no Brasil, 2010 a 2012. Rev Panam Salud Publica 2015; 38(5): 418-24.
20. World Health Organization (WHO). Mental, neurological, and substance use disorders. 2015. Disponível em: http://documentos.bancomundial.org/ curated/es/841781467995046626/Mental-neurological-and-substance-use-disorders (Acessado em 28 de outubro de 2016).
22. Szwarcwald CL, Morais Neto OL, Frias PG, Souza Júnior PRB, Escalante JJC, Lima RB, et al. Busca ativa de óbitos e nascimentos no Nordeste e na Amazônia Legal: estimação das coberturas do SIM e do Sinasc nos municípios brasileiros. In: Brasil. Ministério da Saúde. Secretaria de Vigilância em Saúde. Saúde Brasil 2010. Brasília: Ministério da Saúde; 2011. p. 79-98.
23. Monteiro MG. Public policies to prevent alcohol-related harm. Epidemiol Serv Saúde [Internet]. 2016 Mar.; 25(1): 171-4. Disponível em: http://www.
scielo.br/scielo.php?script=sci_arttext&pid=S2237-96222016000100171&lng=en&nrm=iso (Acessado em 7 de janeiro de 2017).
24. Pan American Health Organization (PAHO). Regional Status Report on Alcohol and Health in the Americas. 2015. Disponível em: http://iris.paho.org/xmlui/ handle/123456789/7670 (Acessado em 20 de dezembro de 2016).
Received on: 02/02/2017