ABSTRACT:Objective: To investigate the association between fat and iber intakes and the hypertriglyceridemic waist phenotype (HWP). Methods: Cross-sectional survey conducted from the baseline of Brazilian Longitudinal Study of Health Adult (ELSA-Brasil). Anthropometric measurements were conducted and the body mass index was calculated (BMI). Participants were classiied according to the presence of HWP when waist circumference ≥ 102 and ≥ 88 cm, respectively, in men and women, and triglycerides ≥ 150 mg/dL. Fat and iber intakes were assessed using a validated food frequency questionnaire, and socioeconomic, demographic and behavioral variables were collected through a questionnaire. The χ² test, Mann-Whitney and Poissonregression were performed with signiicance level of 5%. Results: There was no association between iber and fat intakes with HWP. A lower prevalence of HWP among men was observed (IRR = 0.959; 95%CI 0.948 – 0.969). A higher prevalence of HWP was observed in participants with low physical activity (OR = 1.039, 95%CI 1.021 – 1.057), smoking history (OR = 1.044, 95%CI 1.031 – 1.057), lower per capita income (IRR = 1.035; 95%CI 1.022 – 1.049) and obesity (OR = 1.32, 95%CI 1.305 – 1.341). Fat and iber intakes were not associated with HWP. Conclusion: A higher prevalence of HWP was found in obese, but no association was found between intake of fat and iber and phenotype.
Keywords: Waist circunference. Abdominal obesity. Triglycerides. Hypertrigliceridemic waist. Dietary iber. Dietary fats.
Hypertriglyceridemic waist phenotype and
nutritional factors: a study with participants
of ELSA-Brasil
Fenótipo da cintura hipertrigliceridêmica e fatores nutricionais:
um estudo com participantes do ELSA-Brasil
Juliana Rodrigues de AndradeI, Gustavo Velasquez-MelendezII, Sandhi Maria BarretoII, Taísa Sabrina Silva PereiraI, José Geraldo MillI, Maria del Carmen Bisi MolinaI
IUniversidade Federal do Espírito Santo – Vitória (ES), Brazil. IIUniversidade Federal de Minas Gerais – Belo Horizonte (MG), Brazil.
Corresponding author: Maria del Carmen Bisi Molina. Avenida Marechal Campos, 1.468, Maruípe, CEP: 29042-755, Vitória, ES, Brasil. E-mail: [email protected]
Conlict of interests: nothing to declare – Financial support: Department of Science and Technology (Decit) of Ministry of Health
and Ministry of Science and Technology, through the Financier of Studies and Projects (Finep) and the National Council of Scientiic
and Technological Development (CNPq), processes 01 06 0010.00 RS, 01 06 0212.00 BA, 01 06 0300.00 ES, 01 06 0278.00 MG, 01 06 0115.00 SP, 01 06 0071.00 RJ.
INTRODUCTION
Considering the complexity of cardiovascular risk assessment (CVRA) by direct method, studies such as the Framingham1, Prospective Cardiovascular Münster (PROCAM)2Study and
The Systematic Coronary Risk Evaluation Project (The SCORE Project)3 have developed
speciic protocols in order to facilitate this measurement, both clinical practice and popula-tion studies. However, the diversity of protocols used to evaluate CVRA and the diiculties for full implementation in diferent populations have stimulated researchers to identify and test less complex proposals for performing this procedure.
In a study carried out in Canada, Lemieux and collaborators4 developed a low cost
proto-col with high predictive capacity for important changes in atherogenic markers, facilitating the screening of individuals at risk for coronary diseases. This proposal takes into account only the measurement of abdominal circumference and triglyceride levels, both routine exams performed in health services.
Therefore, the hypertriglyceridemic waistline4, also known as the
hypertriglyceride-mic waist phenotype (HWP)5, has been used to identify individuals who are susceptible to
cardiovascular risk and who frequently present other altered markers, such as Body Mass Index (BMI), C-reactive protein, total cholesterol, and high density lipoprotein (HDL) and low density lipoprotein (LDL) fractions6. Several associated factors are involved in
hypertri-glyceridemic waist development, such as: sedentary lifestyle, smoking, obesity, schooling, race/color and family income7.
RESUMO:Objetivo: Investigar a associação entre consumo de gorduras e ibras e o fenótipo da cintura hipertrigliceridêmica (FCH). Métodos: Pesquisa de corte transversal conduzida a partir da linha de base do Estudo Longitudinal de Saúde do Adulto (ELSA-Brasil). Foi realizada avaliação antropométrica e calculado o Índice de Massa Corporal (IMC). Os participantes foram classiicados segundo presença do FCH quando circunferência da cintura ≥ 102 e ≥ 88 cm, respectivamente, em homens e mulheres, e triglicerídeos ≥ 150 mg/dL. O consumo de gorduras e ibras foi avaliado a partir de um Questionário de Frequência Alimentar validado e as variáveis socioeconômicas, demográicas e características comportamentais foram coletadas por meio de questionário. Foram realizados testes do χ2, Mann-Whitney e regressão de Poissoncom signiicância de 5%. Resultados: Homens apresentaram menor prevalência do FCH (RP = 0,959; IC95% 0,948 – 0,969). Maiores prevalências de FCH foram observadas em indivíduos com atividade física fraca (RP = 1,039; IC95% 1,021 – 1,057), histórico de tabagismo (RP = 1,044; IC95% 1,031 – 1,057), menor renda per capita (IRR = 1,035; IC95% 1,022 – 1,049) e obesidade (RP = 1,32; IC95% 1,305 – 1,341). Consumo de gorduras e ibras não foi associado ao FCH. Conclusão: Maior prevalência do FCH foi encontrada em obesos, porém não foi observada associação entre o consumo de gorduras e ibras e o fenótipo.
Adequate iber consumption, especially from cereals, fruits, vegetables, whole grains and dried fruit, is a protective factor against cardiovascular diseases, obesity, dyslipidemias and diabetes, and also reduces the anthropometric measures such as the waist circumference (WC)8. On the other hand, a diet high in fat has been associated with the disease process,
especially cardiovascular diseases9. Thus, the objective of this study was to evaluate the
association between fat and iber consumption and the occurrence of the hypertriglyceri-demic waist phenotype in participants of the baseline Longitudinal Study of Adult Health (ELSA-Brazil).
METHODS
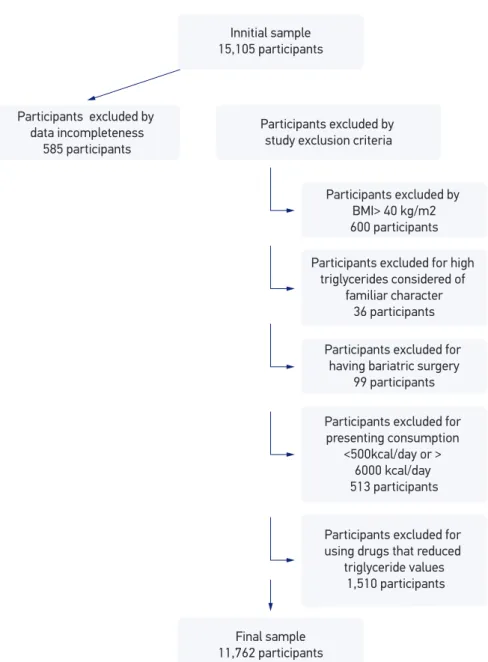
A cross-sectional study conducted from the baseline of ELSA-Brazil, composed of 15,105 active and retired employees, both genders, aged 35 – 74 years old, from ive public higher education institutions - Universidade de São Paulo (USP), Universidade Federal de Minas Gerais (UFMG), Universidade Federal da Bahia (UFBA), Universidade Federal do Rio Grande do Sul (UFRGS) e Universidade Federal do Espírito Santo (UFES) — and a research project of the Oswaldo Cruz Foundation (FIOCRUZ). The research was approved in the Research Ethics Committees in each institution where the project was carried out and all participants signed a Free and Informed Consent Form.
EXCLUSION CRITERIA
Participants with missing data, who presented BMI values above 40 kg/m2 and
triglyce-rides (TG) above 800 mg/dL, considered as hypertriglyceridemia of genetic and familiar etiology10, were excluded from the sample. Individuals who underwent bariatric surgery,
who reported caloric value <500 kcal or > 6,000 kcal, and who used drugs that reduced TG values, such as resins, niacins and ibrates, were also excluded11.
ANTHROPOMETRIC EVALUATION
Weight and height were measured and the BMI was calculated to classify the partici-pants’ nutritional status, according to cut-of points recommended by the World Health Organization (WHO)12. To measure body weight, an electronic scale (Toledo•, model
2096PP), with a capacity of 200 kg and a precision of 50 g, was used. Height was measured using a wall stadiometer (Seca•, Hamburg, BRD) with an accuracy of 1 mm13.
BIOCHEMICAL VARIABLES
Blood samples were obtained by venipuncture, with the participant fasted, respecting the period of 12 to 14 hours. Subsequently, the samples were duly stored and transported to the Central Laboratory of ELSA-Brazil. The method used to evaluate the TG variable was the colorimetric enzyme14.
EVALUATION OF FAT AND FIBER CONSUMPTION
The evaluation of fat and iber consumption of was assessed using the Food Frequency Questionnaire (FFQ), created and validated for this population15. This instrument is
semi-quantitative, with 114 food items, structured in four sections:
1. food/preparations;
2. measures of portions of consumption;
3. consumption frequencies, with eight response options, ranging from “More than 3x/ day” to “Never/Almost never”;
4. reported seasonal consumption.
Participants were asked about their usual consumption in the last 12 months and asked to respond how many times per day, week or month they consumed the items described. In the spontaneous reports of consumption, the option of seasonal consumption was only marked in the season itself. A response card with consumption frequency options was used to facilitate the participant’s choice without the need for memorization, and a kit of utensils was incorpo-rated at the time of application of the FFQ to facilitate the identiication of home measures15.
SOCIODEMOGRAPHIC VARIABLES
The sociodemographic variables and behavioral characteristics evaluated were collected through a questionnaire in an interview conducted at each research center. Schooling was reported during the interview and per capita income was calculated from the approximate net family income information of the month prior to the interview, and the number of people who depend on it. With regard to smoking, questions about current and past smoking were asked. In this study, the following indicators were used: schooling (middle, high, superior and post-graduate), per capita income (in tertiles) and smoking (never smoked, ex-smoker and smoker).
EVALUATION OF PHYSICAL ACTIVITY
physical activity of displacement (PAD)16. The physical activity pattern was reported in
minutes/week for at least 10 minutes/week. The variable was later categorized as weak, moderate and strong.
EVALUATION OF HYPERTRIGLYCERIDEMIC WAIST PHENOTYPE
To assess the presence of HWP, WC and TG were evaluated using the parameters establi-shed by the National Cholesterol Education Program (NCEP)17, with WC for men ≥ 102 cm
and for women ≥ 88 cm. For TG, the recommendation is ≥ 150 mg/dL. The values were later categorized in the absence and presence of HWP.
TREATMENT OF VARIABLES
The nutritional composition of the American Nutritional Data System Research (NDSR)18
table was used to analyze the food reported in the FFQ. After this, the initial treatment of the variables consisted in identifying extreme values of food items (in g/day) considered as not plausible19.
Consumption values (g/day) that were above the 99 percentile were considered to belong to the 99 percentile itself. In addition, foods referred to as seasonal consumption had total daily consumption value of this item multiplied by 0.25. The estimation of fat and iber intake was adjusted by energy consumption, a method proposed by Willett et al.20.
Consumption values were presented in the table as mean + SD. To evaluate the association between HWP and fat and iber intake, the values were categorized into quintiles for entry into the Poisson regression model.
STATISTICAL ANALYSIS
Data were analyzed using the statistical program Statistical Package for Social Sciences (SPSS) 17.021. The χ2, Mann-Whitney and Kruskal Wallis tests as well as a Poisson
regres-sion model were adjusted for age, sex, nutritional status, smoking and physical activity. The signiicance level adopted for all tests was p < 0.05.
RESULTS
In the lifestyle characteristics presented in Table 2, associations with nutritional status (p < 0.001), physical activity (p < 0.001), alcohol consumption (p < 0.001) and smoking (p < 0.001) were found.
Table 3 shows the means and standard deviations of energy consumption, fat and iber, according to sex and the presence of HWP. Associated with sex: energy (p < 0.001), trans
Figure 1. Deinition of the sample of ELSA-Brazil participants, 2008-2010.
Innitial sample 15,105 participants
Participants excluded by data incompleteness
585 participants
Participants excluded by study exclusion criteria
Participants excluded by BMI> 40 kg/m2 600 participants
Participants excluded for high triglycerides considered of
familiar character 36 participants
Participants excluded for having bariatric surgery
99 participants
Participants excluded for presenting consumption
<500kcal/day or > 6000 kcal/day 513 participants
Participants excluded for using drugs that reduced
triglyceride values 1,510 participants
fat (p < 0.001), polysaturated fat (p < 0.001), omega 3 (p < 0.001) and total and soluble iber (p < 0.001). Associated with HWP: energy (p < 0.001), trans fat (p < 0.001), polysaturated fat (p < 0.001) and soluble iber (p = 0.005).
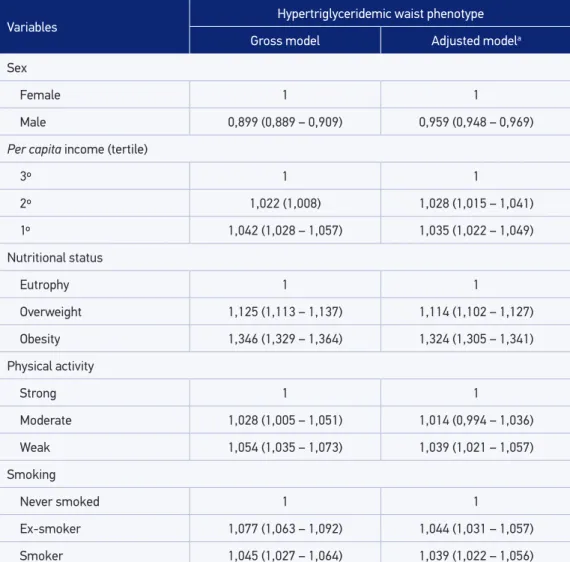
The following variables were considered in the Poisson regression model: sex, per capita
income, nutritional status, physical activity, smoking and age for adjustment (Table 4). There was a lower prevalence of HWP among men (IRR = 0.959, 95%CI 0.948 – 0.969). They were also associated with HWP: weak physical activity (IRR = 1.039, 95%CI, 1,021 – 1,057); smoking history (IRR = 1.044; 95%CI 1.031 – 1.057); smokers (IRR = 1.039; 95%CI 1.022 – 1.056); income tertiles - 1º (IRR = 1.035, 95%CI 1.022 – 1.049) and 2º (IRR = 1.028, 95%CI 1.015 – 1.041); overweight (IRR = 1.114, 95%CI, 1.102 – 1.177); and obesity (IRR = 1.32, 95%CI, 1.305 – 1.341). The data are presented in Table 4.
Table 1. Socio-demographic characteristics according to the presence of hypertriglyceridemic waist phenotype in ELSA-Brazil, 2008-2010.
Variables
Hypertriglyceridemic waist phenotype
p-value*
Total
Absence Presence
n % n % n %
Sex
Male 4.878 49,4 526 27,3
< 0,001 5.404 46,0
Female 4.957 50,6 1.401 72,7 6.358 54,0
Age (years)
35 to 44 2.244 23,0 290 15,0
< 0,001
2.534 21,5
45 to 54 3.872 39,3 772 40,1 4.644 39,5
55 to 64 2.664 27,0 646 33,5 3.310 28,2
65 to 74 1.055 10,7 219 11,4 1.274 10,8
Schooling
Middle incomplete 526 5,4 105 5,4
0,014
631 5,4
Middle complete 671 6,8 96 5,0 767 6,5
High complete 3.382 34,4 647 33,6 4.029 34,3
Superior/post-graduate 5.256 53,4 1.079 56,0 6.335 53,8
Per capita income (tertile)
1º 3.144 32,0 727 37,9
< 0,001
3.871 32,9
2º 3.150 32,0 623 32,3 3.773 32,1
3º 3.541 36,0 575 29,8 4.116 35,0
DISCUSSION
There was no association between fat consumption and HWP, even after adjustment for socioeconomic and health variables. Recent meta-analysis22 showed a clear relationship
between a high fat diet, disease development and CVD mortality, although there is still con-troversy regarding this issue23. Possibly, these contradictory results are related to the
parti-cipation of diferent types of fats in the diet, with mechanisms of action and diverse efects on the health still little clariied. An example is lauric acid24, present in saturated fats, since
it is related to the reduction of serum and anthropometric lipids, contrary to the expected efect. There was also no association of HWP with iber consumption, despite the recogni-zed relation of this exposure with TG and WC6,8.
In this study, the physical activity of weak intensity was associated with a higher preva-lence of HWP, as observed by Haack and collaborators7 in Pelotas (RS). A higher prevalence
*χ2 Test. Variables
Hypertriglyceridemic waist phenotype
p-value*
Total
Absence Presence
n % n % n %
Nutritional status
Eutrophy 4.654 47,3 121 6,3
< 0,001
4.775 40,6
Overweight 3.193 32,5 582 30,2 3.775 32,1
Obesity 1.988 20,2 1.224 63,5 3.212 27,3
Physical activity
Weak 7.404 75,3 1.557 80,8
< 0,001
8.961 76,2
Moderate 1.444 14,7 244 12,7 1.688 14,3
Strong 987 10,0 126 6,5 1.113 9,5
Alcohol
Never used 1.138 11,6 163 8,4
< 0,001
1.301 11,1
Ex-user 1.955 19,9 392 20,3 2.347 19,9
User 6.742 68,5 1.372 71,3 8.114 69,0
Smoking
Never smoked 5.855 59,5 883 45,8
< 0,001
6.738 57,3
Ex-smoker 2.715 27,6 761 39,5 3.476 29,5
Smoker 1.265 12,9 283 14,7 1.548 13,2
of HWP in overweight and obese individuals was also found, as well as in participants with lower per capita income and with a history of smoking. Excess weight is the most important predictor of the endpoint studied, a result also found in a comprehensive study conducted in the United Kingdom by Arsenault and collaborators6, which identiied an increased risk
for coronary heart disease among individuals with HWP.
There is also evidence of the relationship between unfavorable socioeconomic status and cardiovascular outcomes25,26. Unhealthy living habits are associated with increased
car-diovascular risk, such as the smoking habit demonstrated in the Frahmigham study1. In a
follow-up study carried out in France, Czernichow and collaborators27 observed that
indivi-duals who presented the phenotype smoked frequently, were physically inactive, and were more frequently overweight.
The caloric intake of the diet was lower in individuals with HWP, who in turn presen-ted higher intake of soluble iber. The evaluation of dietary intake performed by dietary surveys is quite complex and subject to sub-reports. Scagliusi and Lancha Júnior28 state that
this underestimation occurs consciously due to embarrassment and fear of non-acceptance. The FFQ is a useful and frequently used instrument in epidemiological studies with large samples, since it allows estimating habitual consumption by classifying individuals at levels of consumption, besides presenting low cost29. This instrument was constructed and validated for
this population15, which increases accuracy and minimizes possible biases. The energy
adjust-ment was performed using the residual method in order to minimize the variability of the diet20.
Variables
Hypertriglyceridemic waist phenotype
p-value*
Absence
(n = 9835) (n = 1927)Presence
Mean ± SD Mean ± SD
Energy (kcal) 2.882 ±989 2.763 ± 942 < 0,001
Total fat (g) 85,7 ± 15,8 86,3 ± 15,6 0,089
Trans fat (g) 2,8 ± 1,0 2,9 ± 1,0 < 0,001
Monounsaturated fats (g) 27,3 ± 6,1 27,4 ± 5,9 0,304
Polyunsaturated fats (g) 20,5 ± 4,1 20,1 ± 4,1 < 0,001
Cholesterol (g) 319 ± 102 323 ± 103 0,115
Omega 3 (g) 3,5 ± 1,3 3,5 ± 1,3 0,574
Total ibers (g) 35,0 ± 10,7 35,0 ± 10,3 0,762
Soluble iber (g) 8,9 ± 3,1 9,1 ± 3,3 0,005
Insoluble iber (g) 25,7 ± 8,3 25,6 ± 7,9 0,771
Table 3. Consumption of energy, fat and iber, according to the presence of the hypertriglyceridemic waist phenotype, 2008-2010.
Another positive point of this study is the performance of quality control and quality assurance activities and procedures at all stages of the research, as described by Schmidt and collaborators30. This process confers methodological rigor to the present research,
a neces-sary and important condition in large studies, of a multicentric nature and with a diversity of measures.
CONCLUSION
No association was found between HWP and consumption of fats and iber, although studies have already demonstrated this efect, as well as their relationship with cardiovascular
Variables Hypertriglyceridemic waist phenotype
Gross model Adjusted modela
Sex
Female 1 1
Male 0,899 (0,889 – 0,909) 0,959 (0,948 – 0,969)
Per capita income (tertile)
3º 1 1
2º 1,022 (1,008) 1,028 (1,015 – 1,041)
1º 1,042 (1,028 – 1,057) 1,035 (1,022 – 1,049)
Nutritional status
Eutrophy 1 1
Overweight 1,125 (1,113 – 1,137) 1,114 (1,102 – 1,127)
Obesity 1,346 (1,329 – 1,364) 1,324 (1,305 – 1,341)
Physical activity
Strong 1 1
Moderate 1,028 (1,005 – 1,051) 1,014 (0,994 – 1,036)
Weak 1,054 (1,035 – 1,073) 1,039 (1,021 – 1,057)
Smoking
Never smoked 1 1
Ex-smoker 1,077 (1,063 – 1,092) 1,044 (1,031 – 1,057)
Smoker 1,045 (1,027 – 1,064) 1,039 (1,022 – 1,056)
Table 4. Gross and adjusted model of hypertriglyceridemic waist phenotype, 2008-2010.
health. In this study, HWP was associated with overweight, lower per capita income, history of smoking and poor physical activity.
1. Wilson PWF, D’Agostino RB, Levy D, Belanger AM, Silbershatz H, Kannel WB. Prediction of Coronary Heart Disease Using Risk Factor Categories. Circulation. 1998;97(9):1837-47.
2. Assmannn G, Cullen P, Schulte H. Simple Scoring Scheme for Calculating the Risk of Acute Coronary Events Based on the 10-Year Follow-Up of the Prospective Cardiovascular Münster (PROCAM) Study. Circulation. 2002;105:310-5.
3. Conroy RM, Pyörälä K, Fitzgerald AP, Sans S, Menottid A, De Backere G, et al. Estimation of ten-year risk of fatal cardiovascular disease in Europe: the SCORE project. Eur Heart J. 2003;24(11):987-1003.
4. Lemieux I, Pascot A, Coillard C, Lamarche B, Tchernof A, Alméras N, et al.Hypertrigliceridemic Waist: A marker of the atherogenic metabolic triad (Hyperinsulinemia; hyperapolipoprotein B; small, dense LDL) in men? Circulation. 2000;102(2):179-84.
5. Lemieux I, Poirier P, Bergeron J, Alméras N, Lamarche B, Cantin B, et al. Hypertriglyceridemic waist: A useful screening phenotype in preventive cardiology? Can J Cardiol. 2007;23:23B-31B.
6. Arsenault BJ, Lemieux I, Després JP, Wareham NJ, Kastelein JJ, Khaw KT, et al. The hypertriglyceridemic-waist phenotype and the risk of coronary artery disease: results from the EPIC-Norfolk Prospective Population Study. CMAJ. 2010;182(13):1427-32.
7. Haack RL, Horta BL, Gigante DP, Barros FC, Oliveira I, Silveira VM. The hypertriglyceridemic waist phenotype in young adults from the Southern Region of Brazil. Cad Saúde Pública. 2013;29(5):999-1007.
8. Maki KC, Beiseigel JM, Jonnalagadda SS, Gugger CK, Reeves MS, Farmer MV, et al. Whole-Grain Ready-to-Eat Oat Cereal, as Part of a Dietary Program for Weight Loss, Reduces Low-Density Lipoprotein Cholesterol in Adults with Overweight and Obesity More than a Dietary Program Including Low-Fiber Control Foods. J Am Diet Assoc. 2010;110(2):205-14.
9. Castro LCV, Fransceschini SCC, Priore SE, Pelúzio MCG. Nutrição e doenças cardiovasculares: os marcadores de risco em adultos. Rev Nutr. 2004;17(3):369-77.
10. Sociedade Brasileira de Cardiologia. I Diretriz Brasileira de Hipercolesterolemia Familiar (HF). 2012;99(2 Suppl. 2).
11. Sociedade Brasileira de Cardiologia. V Diretriz Brasileira de Dislipidemias e Prevenção da Aterosclerose. 2013;101(4 Suppl. 1).
12. World Health Organization. Deining the problem of overweight and obesity. In: World Health Organization. Obesity: preventing and managing the global epidemic: report of a Who Consultation. Geneva: WHO; 2000. p. 241-3.
13. Mill JG, Pinto K, Griep RH, Goulart A, Foppa M, Lotufo PA, et al. Aferições e exames clínicos realizados nos participantes do ELSA-Brasil. Rev Saúde Pública. 2013;47:54-62.
14. Fossati P, Prencipe L. Serum triglycerides determined colorimetrically with an enzime that produces hydrogen peroxide. Clin Chem. 1982;28(10):2077-80.
15. Molina MCB, Benseñor IM, Cardoso LO, Velasquez-Melendez G, Drehmer M, Pereira TSS, et al. Reprodutibilidade e validade relativa do questionário de frequência alimentar do ELSA-BRASIL. Cad Saúde Pública. 2013;29(2):379-89.
16. Matsudo SM, Araújo T, Matsudo V, Andrade D, Oliveira LC, Braggion G. International physical activity questionnaire (IPAQ): study of validity and reliability in Brazil. Rev Bras Ativ Física Saúde. 2001;6(2):5-18.
17. National Cholesterol Education Program. Executive summary of the Third Report of the NCEP. Expert panel on detection, evaluation, and treatment of high blood cholesterol in adults (Adult Treatment Panel III). JAMA. 2001;285(19):2486-97.
18. National Digital Stewardship Residency. Nutrition Data System for Research software version, 2010 developed by the Nutrition Coordinating Center (NCC). Minneapolis, MN: University of Minnesota; 2010.
19. Andrade RG, Pereira RA, Sichieri R. Consumo alimentar de adolescentes com e sem sobrepeso do Município do Rio de Janeiro. Cad Saúde Pública. 2003;19(5):1485-95.
20. Willett WC, Howe GR, Kushi LH. Adjustment for total energy intake in epidemiologic studies. Am J Clin Nut. 1997;65(4 Suppl):1229S-31S.
21. Statistical Package for the Social Sciences– SPSS 17.0 User’s Guide. Chicago, USA: SPSS; 2007.
22. Souza RJ, Mente A, Maroleanu A, Cozma AI, Há V, Kishibe T, et al. Intake of saturated and trans unsaturated fatty acids and risk of all cause mortality, cardiovascular disease, and type 2 diabetes: systematic review and meta-analysis of observational studies. BMJ. 2015.
23. Siri-Tarino PW, Sun Q, Hu FB, Krauss RM. Meta-analysis of prospective cohort studies evaluating the association of saturated fat with cardiovascular disease. Am J Clin Nutr. 2010;91:535-46.
24. Cardoso DA, Moreira ASB, Oliveira GMM, Luiz RR, Rosa G. A coconut extra virgin oil-rich diet increases HDL cholesterol and decreases waist circumference and body mass in coronary artery disease patients. Nutr Hosp. 2015;32(5):2144-52.
25. Su TT, Amiri M, Hairi F, Thangiah N, Bulgiba A, AbdulMajid H. Prediction of Cardiovascular Disease Risk among Low-Income Urban Dwellers in Metropolitan Kuala Lumpur, Malaysia. BioMed Research Int. 2015.
26. Yusuf S, Rangarajan S, Teo K, Islam S, Li W, Liu L, et al. Cardiovascular Risk and Events in 17 Low-, Middle-, and High-Income Countries. N Engl J Med. 2014;371(9):818-27.
27. Czernichows S, Bruckert E, Bertrais S, Galan P, Hercberg S, Oppert JM. Hypertriglyceridemic waist
and 7.5-year prospective risk of cardiovascular disease in asymptomatic middle-aged men. Int J Obesity. 2007;31:791-6.
28. Scagliusi FB, Lancha Júnior AH. Subnotiicação da ingestão energética na avaliação do consumo alimentar. Rev Nutr. 2003;16(4):471-81.
29. Pereira TS, Benseñor IJ, Meléndez JG, Faria CP, Cade NV, Mill JG, et al. Sodium and potassium intake estimated using two methods in the Brazilian Longitudinal Study of Adult Health (ELSA-Brasil). Sao Paulo Med J. 2015;6(133):510-16.
30. Schmidt MI, Griep RH, Passos VM, Luft VC, Goulart AC, Menezes GMS, et al. Estratégias e desenvolvimento de garantia e controle de qualidade no ELSA-Brasil. Rev Saúde Pública. 2013;47(Suppl. 2):105-12.
Received on: 06/21/2016