1
Universidade Federal de Alagoas, Faculdade de Nutrição, Programa de Pós-Graduação em Nutrição. Maceió, AL, Brasil. 2
Universidade Federal de Alagoas, Faculdade de Nutrição. Maceió, AL, Brasil. 3
Universidade Federal de Alagoas, Instituto de Ciências Biológicas e da Saúde, Programa de Pós-Graduação em Ciências da Saúde. Maceió, AL, Brasil.
4
Universidade Federal de Alagoas, Faculdade de Nutrição, Laboratório de Nutrição Básica e Aplicada. Av. Lourival Melo Mota, s/n., Tabuleiro do Martins, 57072-970, Maceió, AL, Brasil. Correspondência para/Correspondence to: HS FERREIRA. E-mail: <haroldo.ufal@gmail.com>.
Article based on the master’s degree dissertation of RP NAKANO, entitled “Prevalência e tendência temporal do excesso de peso em mães de crianças menores de cinco anos do estado de Alagoas”. Universidade Federal de Alagoas; 2017.
Support: Conselho Nacional de Desenvolvimento Científico e Tecnológico (process nº474381/2011-0) and Fundação de Amparo à Pesquisa do Estado de Alagoas (process nº60030.000716/2013).
Como citar este artigo/How to cite this article
Nakano RP, Caminha TCS, Carvalho RES, Xavier Júnior AFS, Assunção ML, Ferreira HS. Prevalence, temporal trend and associated factors with excess body weight in mothers of children under five years. Rev Nutr. 2018;31(2):159-73. http:// dx.doi.org/10.1590/1678-98652018000200003
Prevalence, temporal trend and associated
factors with excess body weight in
mothers of children under five years
Prevalência, tendência temporal e fatores
associados ao excesso de peso em mães
de crianças menores de cinco anos
Ricardo Paulino NAKANO1 0000-0001-6171-6713
Tainá Cardoso da Silva CAMINHA1 0000-0001-7885-4039
Renata Elyonara de Sousa CARVALHO2 0000-0002-7171-5623
Antônio Fernando Silva XAVIER JÚNIOR3 0000-0002-1880-757X
Monica Lopes de ASSUNÇÃO4 0000-0003-2985-9890
Haroldo da Silva FERREIRA4 0000-0002-1789-3138
A B S T R A C T
Objective
Methods
This is a time-series study using data from two household surveys conducted in 2005 and 2015. A total of 1,436 mothers were evaluated in 2005, and 690 were evaluated in 2015. The dependent variables were excess body weight (Body Mass Index [BMI] ≥25.0kg/m²), high percentage of Body Fat (%BF ≥33%) and abdominal obesity (waist circumference >80cm). The independent variables were the socioeconomic and demographic factors. The changes that occurred between the two surveys were expressed in percentages, and the measure of association was the Prevalence Ratio, calculated by Poisson regression, in both the crude and multivariate analyses.
Results
There were increases of 33.2%, 59.2% and 31.0%, respectively, for the prevalence of excess weight (PR=1.33, 95% Confidence Interval [CI]:1.21-1.46), abdominal obesity (PR=1.59, 95% CI:1.43-1.77) and high %BF (PR=1.31, 95% CI:1.07-1.60). The factors independently associated with excess weight and abdominal obesity were the highest age group (>30 years), menarche ≤12 years and higher parity (>2 children). The same was observed for high %BF, except for the loss of significance in the adjusted analysis for the variable menarche ≤12 years.
Conclusion
The prevalence of high body adiposity is a problem of relevant importance in the studied population and has presented an upward trend in the last 10 years. Women over 30 years and with more than two children should be given priority in prevention and control.
Keywords: Health surveys. Mothers. Nutritional transition. Obesity. Overweight.
R E S U M O
Objetivo
Este estudo teve como objetivo avaliar a prevalência, a tendência temporal e os fatores associados ao excesso de peso em mães de crianças menores de cinco anos.
Métodos
Trata-se de um estudo de série temporal que se utilizou de dados de dois inquéritos domiciliares realizados em 2005 e 2015, respectivamente. Em 2005 foram avaliadas 1.436 mães, e em 2015 avaliaram-se 690. As variáveis dependentes foram o excesso de peso (IMC ≥25,0kg/m²), o percentual de gordura corporal elevado (%GC ≥33%) e a obesidade abdominal (perímetro da cintura >80cm). As variáveis independentes foram os fatores socioeconômicos e demográficos. As modificações ocorridas entre os dois inquéritos foram expressas percentualmente, e a medida de associação foi a razão de prevalência, calculada por regressão de Poisson, tanto na análise bruta quanto na multivariável.
Resultados
Verificaram-se incrementos de 33,2%, 59,2% e 31,0%, respectivamente, para as prevalências de excesso de peso (RP=1,33; IC95%: 1,21-1,46), obesidade abdominal (RP=1,59; IC95%: 1,43-1,77) e percentual de gordura corporal elevado (RP=1,31; IC95%: 1,07-1,60). Os fatores independentemente associados ao excesso de peso e à obesidade abdominal foram a maior faixa etária (>30 anos), menarca (<12 anos) e maior paridade (>2 filhos). O mesmo se observou para o percentual de gordura corporal elevado, exceto pela perda da significância na análise ajustada para a variável menarca <12 anos.
Conclusão
A prevalência de excesso de adiposidade corporal se apresenta em alta magnitude na população estudada e vem apresentando tendência ascendente nos últimos dez anos. Mulheres com mais de trinta anos e com mais de dois filhos devem receber prioridade nas ações de prevenção e controle.
Palavras-chave: Inquéritos epidemiológicos. Mães. Transição nutricional. Obesidade. Sobrepeso.
I N T R O D U C T I O N
Obesity is characterized by the excessive accumulation of body fat with undesirable consequences to health, especially because
According to the World Health Organization (WHO) [4], from 1980 to 2014, the number of people with excess weight (overweight or obesity) doubled around the world. From this period, there is an estimate that over 1.9 billion (39%) of adults are overweight and that more than 600 million are obese, corresponding to 13% of the world population.
In Brazil, the prevalence of excess weight in women in the Pesquisa de Orçamentos Familiares (POF, Household Budget Survey) was markedly increased when compared with what was observed in the Estudo Nacional da Despesa Familiar (ENDEF 1974-1975, National Study on Family Expenses), going from 28.7% to 48.0%. Obesity, in turn, increased from 8.0% to 16.9% over the same period [5].
A research conducted in 2016 by telephone survey (Sistema de Vigilância de Fatores de Risco e Proteção para Doenças Crônicas por Inquérito Telefônico/Surveillance System of Risk and Protective Factors for Chronic Diseases by Telephone Survey) [6] found that the prevalence of women with excess weight in the Brazilian capitals was 50.5%. The Pesquisa Nacional de Saúde (PNS, National Health Survey) [7] showed that 58.2% of Brazilian women exhibited this condition.
A high prevalence of excess weight in women was also observed in the state of Alagoas. A survey conducted in 2005 found a prevalence of 44% [8]. Another investigation conducted in 2009 with a sample representing women from the semiarid region of this state demonstrated that the situation was equally worrying (43%) [9,10].
Trend research is performed all over the world to diagnose the magnitude and the evolution of excess body weight in the population. Whereas developed countries seem to have controlled the prevalence of this condition, developing countries seem to have seen an increase. However, some of these studies collect self-reported data, which may underestimate the indicators. Thus, it is important that studies of this nature be performed by household surveys
on samples that represent the population so that they produce more reliable information [11,12].
In 2005 and 2015, respectively, two population-based surveys were performed in the state of Alagoas. These surveys had similar methodologies and were conducted on samples that represented mothers of children less than five years old. The target population of these studies was a group that is still not much explored in population-based studies with excess body weight as an outcome of interest. However, there is evidence, obtained from research on women in general, that there is an association between excess weight and reproductive characteristics [13-15].
However, the association between parity and obesity has been controversial. There is a general belief that the risk of women becoming obese may increase due to weight retention after giving birth and is related to the number of children [16,17]. However, because there has been a decrease in the fertility rate in recent years, the association between this variable and parity may have been changed [18].
In addition, mothers of pre-school children participate more often in programs from health units because they are the preferential target of health-promoting activities, including those that involve approaches regarding healthy food and weight control [19].
Therefore, there is a need to perform studies that identify the magnitude, the trends and the factors associated with excess weight in women who have pre-school-aged children, contributing to better planning of public policies aimed at preventing and controlling excess weight in this biologic group. The present study was performed to achieve these goals.
M E T H O D S
Study Type and Sample Planning
2015 (Survey II), respectively, with samples that represented mothers of children less than five years of age.
To calculate the sample of Survey I, the following parameters were used: 33% prevalence of excess weight [20], 2.5% sampling error and 95,0% Confidence Interval (CI) [21]. The sample size calculated in the StatCalc module of Epi Info (CDC – Centers for Disease Control and Prevention, Atlanta, Georgia, United States of America) software was 1,255 women. The sampling process had multiple stages with three steps. In the first step, 20 of the 102 municipalities of the state were randomly selected by systematic sampling proportional to the number of inhabitants. Then, four census tracts were randomly selected in each municipality, respecting the proportions between urban and rural sectors (Maceió was selected six times because it has approximately 1/3 of the state population). Finally, a starting point was randomly selected within each sector, from which 28 households were visited consecutively. In this survey, all families who had children less than five years of age in the household were eligible.
At Survey II, 42.5% prevalence [9], 4.0% sampling error and 95.0% CI were used as references. Based on these criteria, 585 women would be necessary. To compose the sample, the following procedures were used: (1) random selection of 30 municipalities from the total of 102 in the state, by systematic sampling with proportional probability to their size; (2) random selection of four census tracts within each municipality; and (3) a starting point within each sector, from which 28 households were consecutively visited. Because Maceió accounts for 1/3 of the state population, it was selected 10 times, whereas Arapiraca, the second largest municipality in Alagoas state, was selected twice. Differently from Survey I, in Survey II, all of the families who had individuals from the maternal and child groups were eligible. Thus, for the present study, we considered only those
who had mothers of children less than five years of age, allowing us to compare the results obtained in both studies.
All pregnant women and mothers with visible anatomical changes (because they interfered with the anthropometric results) were excluded from the analysis.
Data Collection
Data were obtained through visits to the households where the interview was conducted, following a script established in structured forms, and anthropometric measurements were obtained using regularly calibrated equipment. All procedures were previously tested in a pilot study. The field team was composed of properly trained and supervised interviewers.
The anthropometric measures were collected following the recommendations of Lohman [22]. To obtain the body weight, a portable digital scale (Charder®, model MS6121R;
Charder Electronic Co, Taichung City, Taiwan) with a capacity of 250kg and a precision of 100g was used. The height was obtained with a stadiometer (Seca model 213; Seca GmbH & Co, Hamburg, Germany) with an inextensible measuring tape with a sensitivity adjusted to 0.1cm and a length of 205cm.
Excess body weight was classified according to the Body Mass Index (BMI), according to the sums of overweight (BMI ≥25 to <30kg/m²) and obesity (BMI ≥30kg/m²). Therefore, excess body weight was defined by BMI ≥25kg/m² [23].
The Body Fat Percentage (%BF) was estimated by Bioelectrical Impedance Analysis (BIA) obtained with Omron HBF-306 (Omron Healthcare, Kyoto, Japan) bipolar devices. The ≥33% cut-off point was used to define excess body fat [24].
The dependent variables were excess body weight, abdominal obesity and increased %BF. To identify the possible factors associated with these variables, the following conditions (independent variables) were investigated: age (30 years; >30 years), number of people in the household (≤4; >4), age at menarche (≤12 years; >12 years), number of children (≤2; >2), ownership of consumer goods (considering TV, automobile, washing machine and refrigerator; ≤2; >2), monthly per capita income (≤ half minimum wage; > half minimum wage), user of the Programa Bolsa Família (PBF, Family Grant Program) (yes; no), area of residence (urban; rural) and education level (≤8; >8 years of study).
To calculate the per capita income, the minimum wage values at the time of the study were used (R$300,00 in 2005; R$724,00 in 2015).
Statistical Analysis
Data were double-entered independently in a form generated in Epi Info software version 3.5.2 (CDC – Center for Disease Control and Prevention, Atlanta, Georgia, United States of America). After correcting typing errors and excluding outliers, data were subjected to statistical analysis with Stata 13.0 software (StataCorp, College Station, Texas, United States of America).
The normality of the distribution of variables was examined using the Shapiro-Francia test. Because most of the variables did not meet the parametric assumptions, the Mann-Whitney test was used to compare the differences between the medians of the continuous variables obtained, respectively, in 2005 and 2015. Thus, the results are presented as medians and interquartile ranges.
The chi-square test was used to verify the significance of the differences between the prevalence values found in both surveys (2005-2015). The results obtained in the 2015 survey were considered to define the factors associated with the dependent variables.
As a measure of association, the Prevalence Ratio (PR) and respective 95% CIs, obtained by Poisson regression with robust adjustment of the variance, were used in both the crude and adjusted analyses (multivariable analysis). In the multivariable analysis, the independent variables that exhibited a statistical significance of up to 20% (p<0.2) in the crude analysis were introduced. The variables that exhibited less significance (higher p value) were gradually excluded from the model (backward elimination). In the final model, only those with
p<0.05 remained, a condition that was assumed in all situations of the statistical analysis to designate statistical significance.
The final adjustment of the dependent variables considered the factors that, after multivariable analysis, remained significantly associated with both them and the age of the youngest child (continuous variable) because it is recognized that postpartum women exhibit pregnancy-related weight retention that is gradually reduced over time [17].
Ethical Aspects
The projects related to Survey I (process nº 010102/2003-35) and Survey II (process nº 010102/0355) were approved by the Research Ethics Committee of the Universidade Federal de Alagoas.
R E S U L T S
In total, 1,436 mothers were studied in 2005 and 690 in 2015. Table 1 shows some demographic, socioeconomic and anthropometric characteristics of these women. In 2015, the mothers were older, had higher body weights and were taller when compared with the mothers of 2005.
Table 1. Age and physical characteristics of mothers of children less than five years of age in the State of Alagoas (AL), according to two household surveys (2005-2015).
Variables 2005 2015
n Median (P25; P75) n Median (P25; P75) p
Age (years) 1,311 26.0 (22.0; 31.0) 661 28.0 (24.0; 33.0) <0.001*
Weight (kg) 1,158 58.4 (51.5; 67.1) 653 64.3 (56.2; 74.0) <0.001*
Height (cm) 1,153 155.5 (152.2;159.6) 653 158.0 (153.6; 161.5) <0.001*
Body Mass Index (kg/m2) 1,150 24.1 (21.3; 27.4) 653 25.9 (22.7; 29.5) <0.001*
Waist circumference (cm) 1,156 76.0 (70.0; 83.3) 651 81.0 (74.0; 89.6) <0.001*
Body fat percentagea 499 27.0 (21.8; 32.4) 629 29.3 (23.9; 34.3) <0.001*
Note: *Significant difference according to the Mann-Whitney test. aEstimated by bioelectrical impedance analysis.
income greater than half a wage, more than two consumer goods, education level of more than eight years of study, number of members of the Family Grant Program and number of mothers who had more than two children.
The same positive and significant evolution was observed for the prevalence of all indicators of body fat (Tables 3, 4, and 5). Excess body weight increased from 42.8 to 57.0% (PR=1.33; 95% CI:1.21-1.46; 33.2% increase). Abdominal obesity increased from 33.6 to 53.5% (PR=1.59; 95% CI:1.43-1.77; 59.2% increase). Excess body fat, which in 2005 was 22.9%, increased to 30.0% in 2015 (PR=1.31; 95% CI:1.07-1.60; 31.0% increase).
The crude analysis showed significant associations between the body fat indicators and the following conditions: age range (>30 years), up to four residents in the household, menarche <12 years, having more than two children, owning more than two consumer goods, family with a monthly per capita income greater than half a minimum wage, being a member of the Family Grant Program, living in urban areas and having less than eight years of study. These results are expressed in Tables 3 (excess body weight), 4 (abdominal obesity) and 5 (high %BF).
After controlling for possible confounding factors through the multivariate analysis, the following variables were associated with excess
weight and abdominal obesity: older age (>30 years), menarche <12 years and having more than two children. The same was observed for increased %BF, except for the loss of significance of the variable menarche <12 years.
The following prevalence ratios were obtained by adjustments according to the age of the youngest child (postpartum time indicator) and to the independent variables that remained significantly associated with the body fat indicators (prevalence values observed in 2015 in relation to those observed in 2005): excess weight (BMI ≥25kg/m2): 1.29
(95% CI:1.16-1.44; p<0.001); abdominal obesity (waist circumference >80cm): 1.55 (1.37-1.76;
p<0.001); and increased body fat percentage (≥33%): 1.59 (1.43-1.77; p<0.001).
D I S C U S S I O N
The prevalence of obesity is increasing in all regions of the world; no country has managed to reverse this epidemic once it has started [26]. In the present study, three body fat indicators were used, and upward and significant trends were observed in all of them, which is a reason for great concern because obesity is considered a risk factor for several chronic non-communicable diseases [27].
Table 2. Evolution (2005-2015) of socioeconomic, demographic, anthropometric and reproductive characteristics of mothers of children less than five years of age in the state of Alagoas (AL), Brazil.
Variables 2005 (n=1,436) 2015 (n=690) p Variation %
[P2-P1/P1].100 PR (95% CI)
% %
Household location
Urban 71.9 71.1
0.697 -1.1 0.99 (0.93-1.05)
Rural 28.1 28.9 2.8 1.02 (0.89-1.19)
Per capital income (minimum wages)a
>1/2 16.4 24.2
<0.001* 47.6 1.48 (1.23-1.78)
≤1/2 83.6 75.8 -9.3 0.91 (0.86-0.95)
Consumer goods (TV, automobile, washing machine and refrigerator)
>2 13.8 35.9
<0.001* 160.1 2.60 (2.20-3.07)
≤2 86.2 64.1 -25.6 0.74 (0.70-0.79)
Number of people in the household
≤4 44.0 69.8
<0.001* 58.6 1.57 (1.47-1.71)
>4 56.0 30.2 -46.1 0.54 (0.48-0.61)
Education level (years)
≤8 75.8 53.0
<0.001* -30.1 0.70 (0.65-0.76)
>8 24.2 47.0 94.2 1.94 (1.71-2.20)
Member of the Family Grant Program
Yes 19.3 61.0
<0.001* 216.1 3.16 (2.80-3.57)
No 80.7 39.0 -51.7 0.48 (0.44-053)
BMI (kg/m2)
≥25 42.8 57.0
<0.001* 33.2 1.33 (1.21-1.46)
<25 57.2 43.0 -24.8 0.75 (0.68-0.83)
Waist circumference (cm)
>80 33.6 53.5
<0.001* 59.2 1.59 (1.43-1.77)
≤80 66.4 46.5 -30.0 0.70 (0.64-0.77)
Body fat percentage (%)
≥33 22.9 30.0
0.007* 31.0 1.31 (1.07-1.60)
<33 77.1 70.0 -9.2 0.91 (0.85-0.97)
Age at menarche (years)
<12 18.1 20.9
0.155 15.5 1.15 (0.95-1.40)
≥12 81.9 79.1 -3.4 0.97 (0.92-1.01)
Number of children
>2 31.1 37.1
0.011* 19.3 1.19 (1.04-1.37)
≤2 68.9 62.9 -8.7 0.91 (0.85-0.98)
Note: *Significant difference according to the chi-square test. aMinimum wage values at the times of the studies: R$300,00 in 2005; R$724,00
in 2015; PR: Prevalence ratio; P1: Prevalence observed in the 2005 survey; P2: Prevalence observed in the 2015 survey.
very similar to that observed (58.2%) in Brazilian women during the 2013 PNS [7].
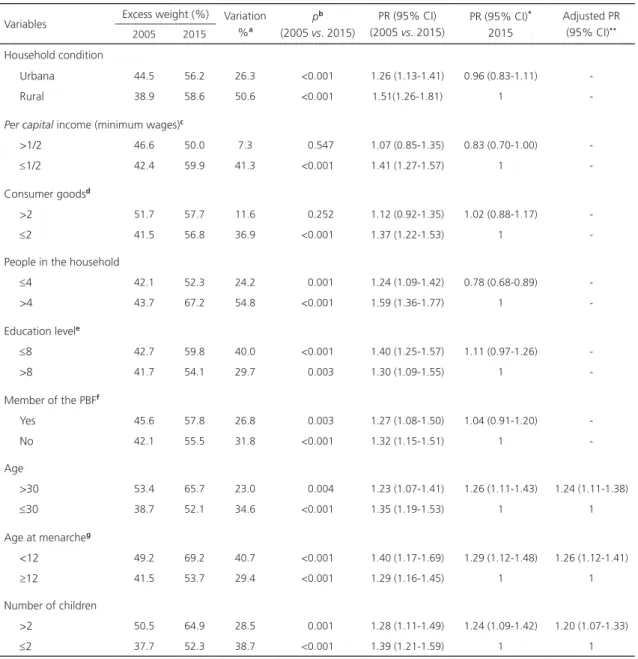
Table 3. Evolution (2005-2015) of the prevalence of excess body weight (BMI ≥25kg/m2) in mothers of children less than five years
of age in the state of Alagoas (AL), according to demographic and socioeconomic variables.
Variables Excess weight (%) Variation %a
pb
(2005 vs. 2015)
PR (95% CI) (2005 vs. 2015)
PR (95% CI)*
2015
Adjusted PR (95% CI)**
2005 2015
Household condition
Urbana 44.5 56.2 26.3 <0.001 1.26 (1.13-1.41) 0.96 (0.83-1.11) -
Rural 38.9 58.6 50.6 <0.001 1.51(1.26-1.81) 1
-Per capital income (minimum wages)c
>1/2 46.6 50.0 7.3 0.547 1.07 (0.85-1.35) 0.83 (0.70-1.00)
≤1/2 42.4 59.9 41.3 <0.001 1.41 (1.27-1.57) 1
-Consumer goodsd
>2 51.7 57.7 11.6 0.252 1.12 (0.92-1.35) 1.02 (0.88-1.17)
≤2 41.5 56.8 36.9 <0.001 1.37 (1.22-1.53) 1
-People in the household
≤4 42.1 52.3 24.2 0.001 1.24 (1.09-1.42) 0.78 (0.68-0.89)
>4 43.7 67.2 54.8 <0.001 1.59 (1.36-1.77) 1
-Education levele
≤8 42.7 59.8 40.0 <0.001 1.40 (1.25-1.57) 1.11 (0.97-1.26)
>8 41.7 54.1 29.7 0.003 1.30 (1.09-1.55) 1
-Member of the PBFf
Yes 45.6 57.8 26.8 0.003 1.27 (1.08-1.50) 1.04 (0.91-1.20)
No 42.1 55.5 31.8 <0.001 1.32 (1.15-1.51) 1
-Age
>30 53.4 65.7 23.0 0.004 1.23 (1.07-1.41) 1.26 (1.11-1.43) 1.24 (1.11-1.38)
≤30 38.7 52.1 34.6 <0.001 1.35 (1.19-1.53) 1 1
Age at menarcheg
<12 49.2 69.2 40.7 <0.001 1.40 (1.17-1.69) 1.29 (1.12-1.48) 1.26 (1.12-1.41)
≥12 41.5 53.7 29.4 <0.001 1.29 (1.16-1.45) 1 1
Number of children
>2 50.5 64.9 28.5 0.001 1.28 (1.11-1.49) 1.24 (1.09-1.42) 1.20 (1.07-1.33)
≤2 37.7 52.3 38.7 <0.001 1.39 (1.21-1.59) 1 1
Note: *Prevalence ratio of excess weight according to the categories of the respective variables observed in the 2015 survey; **Adjustment
performed for all independent variables that, in 2015, were associated with BMI ≥25kg/m2. After excluding the non-significant variables
(backward elimination), only those with p<0.05 remained in the model. a[P2-P1/P1].100, where P1 is the prevalence in 2005 and P2 is the
prevalence in 2015; bChi-square test; cMinimum wage values at the time of the studies: R$300,00 in 2005; R$724,00 in 2015; dTV, automobile,
washing machine and refrigerator; eYears studied; fPBF: Programa Bolsa Família (Family Grant Program); gAge, in years, at menarche.
weight. A research conducted in Rio Grande do Sul with adults [28] found a marked increase between 1997 and 2012 (23.6% to 52.4%). In
Pernambuco, this aggravation increased from 31.7% in 1997 to 41.7% in 2006 [29]. It is interesting to note that the prevalence observed
Table 4. Evolution (2005-2015) of the prevalence of abdominal obesity (WC>80 cm) in mothers of children less than five years of age in the state of Alagoas (AL), according to demographic and socioeconomic variables.
Variables Abdominal obesity (%) Variation %a
pb
(2005 vs. 2015)
PR (95% CI) (2005 vs. 2015)
PR (95% CI)*
2015
Adjusted PR (95% CI)**
2005 2015
Household condition
Urbana 35.6 51.5 44.7 <0.001 1.45 (1.27-1.65) 0.89 (0.76-1.03)
Rural 29.2 58.1 99.0 <0.001 1.99 (1.62-2.44) 1
-Per capital income (minimum wages)c
>1/2 40.7 43.3 6.4 0.643 1.06 (0.82-1.38) 0.76 (0.62-0.92)
≤1/2 32.1 57.4 78.8 <0.001 1.78 (1.58-2.02) 1
-Consumer goodsd
>2 39.0 52.1 33.6 0.013 1.34 (1.05-1.69) 0.96 (0.83-1.12)
≤2 32.8 54.2 65.2 <0.001 1.65 (1.46-1.87) 1
-People in the household
≤4 31.9 49.0 53.6 <0.001 1.54 (1.31-1.80) 0.77 (0.67-0.89)
>4 34.9 63.2 81.1 <0.001 1.81 (1.56-2.10) 1
-Education levele
≤8 32.6 58.2 78.5 <0.001 1.80 (1.58-2.06) 1.20 (1.04-1.39)
>8 36.4 48.4 33.0 0.004 1.33 (1.09-1.62) 1
-Member of the PBFf
Yes 34.2 54.4 59.1 <0.001 1.59 (1.30-1.94) 1.05 (0.90-1.22)
No 33.4 51.9 55.4 <0.001 1.55 (1.33-1.81) 1
-Age
>30 46.8 63.5 35.7 <0.001 1.36 (1.17-1.58) 1.33 (1.15-1.53) 1.41 (1.24-1.59)
≤30 28.3 47.9 69.3 <0.001 1.69 (1.46-1.96) 1 1
Age at menarcheg
<12 38.6 62.3 61.4 <0.001 1.61 (1.29-2.02) 1.22 (1.04-1.44) 1.24 (1.09-1.42)
≥12 32.1 50.9 58.6 <0.001 1.58 (1.39-1.80) 1 1
Number of children
>2 42.1 61.5 46.1 0.001 1.46 (1.23-1.73) 1.27 (1.10-1.46) 1.22 (1.08-1.38)
≤2 28.3 48.5 71.4 <0.001 1.71 (1.46-2.01) 1 1
Note: *Prevalence ratio of excess weight according to the categories of the respective variables observed in the 2015 survey; **Adjustment
performed for all independent variables that, in 2015, were associated with WC >80 cm. After excluding the non-significant variables (backward elimination), only those with p<0.05 remained in the model. a[P2-P1/P1].100, where P1 is the prevalence in 2005 and P2 is the prevalence in
2015; bChi-square test; cMinimum wage values at the time of the studies: R$300,00 in 2005; R$724,00 in 2015; dTV, automobile, washing
machine and refrigerator; eYears studied; fPBF: Programa Bolsa Família (Family Grant Program); gAge, in years, at menarche.
not restricted to mothers from Alagoas; rather, it is an issue that involves all of the population of Brazilian women.
Among the indicators analyzed in the present study, excess weight exhibited the highest prevalence. However, abdominal obesity
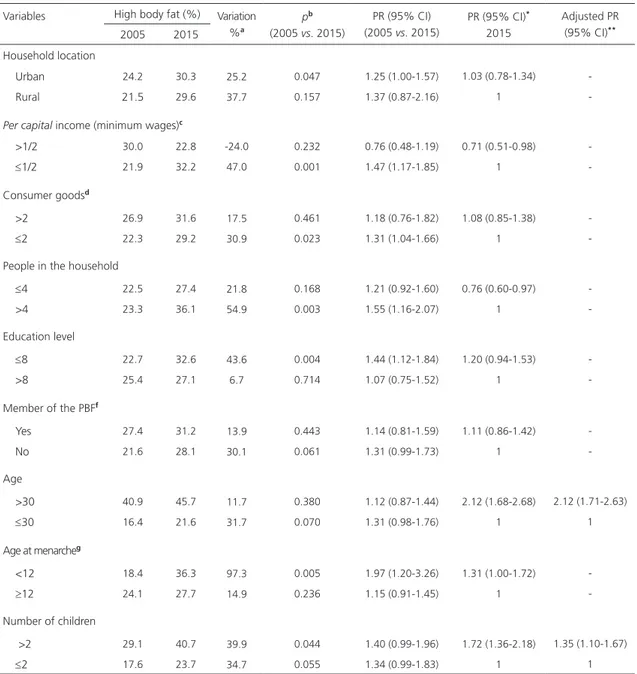
Variables High body fat (%) Variation %a
pb
(2005 vs. 2015)
PR (95% CI) (2005 vs. 2015)
PR (95% CI)*
2015
Adjusted PR (95% CI)**
2005 2015 Household location
Urban 24.2 30.3 25.2 0.047 1.25 (1.00-1.57) 1.03 (0.78-1.34)
Rural 21.5 29.6 37.7 0.157 1.37 (0.87-2.16) 1
-Per capital income (minimum wages)c
>1/2 30.0 22.8 -24.0 0.232 0.76 (0.48-1.19) 0.71 (0.51-0.98)
≤1/2 21.9 32.2 47.0 0.001 1.47 (1.17-1.85) 1
-Consumer goodsd
>2 26.9 31.6 17.5 0.461 1.18 (0.76-1.82) 1.08 (0.85-1.38)
≤2 22.3 29.2 30.9 0.023 1.31 (1.04-1.66) 1
-People in the household
≤4 22.5 27.4 21.8 0.168 1.21 (0.92-1.60) 0.76 (0.60-0.97)
>4 23.3 36.1 54.9 0.003 1.55 (1.16-2.07) 1
-Education level
≤8 22.7 32.6 43.6 0.004 1.44 (1.12-1.84) 1.20 (0.94-1.53)
>8 25.4 27.1 6.7 0.714 1.07 (0.75-1.52) 1
-Member of the PBFf
Yes 27.4 31.2 13.9 0.443 1.14 (0.81-1.59) 1.11 (0.86-1.42)
No 21.6 28.1 30.1 0.061 1.31 (0.99-1.73) 1
-Age
>30 40.9 45.7 11.7 0.380 1.12 (0.87-1.44) 2.12 (1.68-2.68) 2.12 (1.71-2.63)
≤30 16.4 21.6 31.7 0.070 1.31 (0.98-1.76) 1 1
Age at menarcheg
<12 18.4 36.3 97.3 0.005 1.97 (1.20-3.26) 1.31 (1.00-1.72)
≥12 24.1 27.7 14.9 0.236 1.15 (0.91-1.45) 1
-Number of children
>2 29.1 40.7 39.9 0.044 1.40 (0.99-1.96) 1.72 (1.36-2.18) 1.35 (1.10-1.67)
≤2 17.6 23.7 34.7 0.055 1.34 (0.99-1.83) 1 1
Table 5. Evolution (2005-2015) of the prevalence of high body fat (%BF >33%) in mothers of children less than five years of age in the state of Alagoas (AL), according to demographic and socioeconomic variables.
Note: *Prevalence ratio of excess weight according to the categories of the respective variables observed in the 2015 survey; **Adjustment
performed for all independent variables that, in 2015, were associated with %BF ≥33%. After excluding the non-significant variables (backward elimination), only those with p<0.05 remained in the model. a[P2-P1/P1].100, where P1 is the prevalence in 2005 and P2 is the prevalence in
2015; bChi-square test; cMinimum wage values at the time of the studies: R$300,00 in 2005; R$724,00 in 2015; dTV, automobile, washing
machine and refrigerator; eYears studied; fPBF: Programa Bolsa Família (Family Grant Program); gAge, in years, at the menarche.
than that reported for Pernambuco in 2006 [32] (69.9%). These findings suggest that the problem may have different magnitudes, even among studies conducted in the same region, in this case, the Northeast of Brazil. It should
be noted that the positive variation observed in our study was alarming, showing the epidemic outline of this condition.
accumulated fat in the visceral region is an important independent risk factor for cardiometabolic disorders, such as high blood pressure [32,33]. A recent publication based on the 2015 sample of the present study [34] compared the capacities of excess weight, high %BF and waist-height ratio (an indicator of abdominal obesity) to identify high blood pressure. The waist-height ratio was the indicator with the best accuracy, showing that the accumulation of fat in the abdominal region is more harmful to an individual’s health than
the generalized excess fat.
Regarding the body fat percentage, although there is no consensus regarding the most appropriate cut-off point to characterize health risks [35], in the present study, we assumed that values ≥33% would indicate high %BF [24,36], a condition that increased 31% between 2005 and 2015, affecting 30% of the mothers investigated in the last survey. A high body fat percentage may compromise health and is considered a risk factor for cardiovascular disease, type II diabetes Mellitus and some types of cancer [37].
There are several ways to estimate body fat. In the present study, BIA was used, which is a doubly indirect method that has been used in both scientific research and clinical practice [38] because it shows very similar results to those obtained with more sophisticated resources. An investigation that compared the validity of BIA, having the results obtained by computed tomography as a gold standard, found a sensitivity of 83.3% and a specificity of 79.1%, concluding that BIA has a satisfactory validity [39].
Menarche before age 12 was associated with excess weight and high waist circumference in the mothers analyzed, with increases of 40.7% and 61.4%, respectively, in the prevalence rates of excess weight and abdominal obesity in women who had their menarche before 12 years old. In addition, the prevalence rates of excess weight (69.2%) and abdominal obesity
(62.3%) were shown to be high among women studied in 2015 who exhibited this characteristic, corroborating the studies by Pinheiro et al. [40] and Trikudanathan et al. [41]. A study conducted in the South of Brazil showed that women who had their menarche before age 11 had a 25% higher risk of having abdominal obesity and a 75% higher risk of being obese [42]. In the semiarid region of Brazil, this risk was increased by 59% [14]. Through a meta-analysis, it was concluded that premature biological maturation is associated with a greater risk for obesity and several cardiometabolic diseases [15,43].
In addition to being a marker of biological maturation, menarche is related to the economic and social development of the population. Earlier pubertal development may be related to improved living conditions, particularly improved nutritional status [44,45]. However, early menarche may be caused not by adequate nutritional status but by excess body weight because the accumulation of fat in the tissues would facilitate the anticipation of the first menstrual episode by complex mechanisms involving leptin [46,47]. Thus, early menarche would not increase the predisposition to obesity; instead, obesity would precipitate menarche. However, the cross-sectional design of the present study is not adequate to analyze this statistical association found in the population studied.
Conversely, it is argued that early menarche can lead to changes in body composition due to hormonal activity, which may remain into adulthood. As an example, we can mention increased serum levels of sexual steroids, regardless of the quantities secreted by the ovaries. These increased levels occur due to the endocrine activity of the adipose tissue, especially that deposited in the visceral region [47].
2005 to 2015, there was a 19.3% increase in the number of women with more than two children. This association is consonant with the literature. Oliveira et al. [48] observed in women who were users of the Sistema Único de Saúde
(SUS, Unified Health System) of Belo Horizonte
(MG) that multiparity was considered a factor associated with the accumulation of abdominal fat. In women from Rio Grande do Sul, a higher prevalence of obesity was observed in women with a history of three or more pregnancies [49]. Multiparity associated with excess weight was also described in a study conducted in China [13].
According to some authors, the gestational period is considered a risk factor for excessive weight gain, and, in most cases, postpartum women do not return to their nutritional status prior to gestation. This fact may be aggravated when there is a reduction in the interval between pregnancies [17,50].
Another variable that was associated with higher adiposity was greater age range; that is, the prevalence rates of excess weight, abdominal obesity and high %BF were higher in mothers who were older than 30 years. Other studies show a gradual increase in body adiposity as women get older [31,40]. Among several factors, hormonal changes, such as decreased growth hormone secretion, along with decreased basal metabolic rate and physical activity, comprise some of the reasons that would increase women's susceptibility to obesity as they get older [51,52].
One of the limitations of the present study was that it did not assess the dietary intake levels and the physical activity patterns of the studied women to allow a more in-depth analysis based on energy balance. However, body weight gain can only occur with a positive energy balance; therefore, it can be speculated that these women have higher energy consumption than their metabolic needs, which is why any intervention necessarily goes through programs that can reverse this situation. In addition, in a nutritional
education context, not only the caloric value of food should be of concern; the quality of the food is also extremely important. Several studies have noted that the consumption of ultra-processed foods represents an important determining factor for obesity [53-55]; therefore, it should be discouraged in the population.
The present study contextualizes updated data regarding excess weight and the trend for this condition, with a well-planned sample that represents women who are mothers of children less than five years of age in a Brazilian state. In addition to contributing to accumulating evidence of increased body adiposity in the population, the data obtained can contribute to the evaluation and planning of public policies adequate to address this issue.
C O N C L U S I O N
The prevalence rates of excess weight, abdominal obesity and high %BF observed in 2015 were much higher than those observed in 2005, emphasizing the epidemic progression of obesity in the studied population. The main factors associated with this condition were age, multiparity and menarche occurring before 12 years of age, conditions that should be considered when implementing prevention and control measures. The data presented are worrying and show the epidemiological relevance of obesity, justifying a priority in the establishment of public policies for health promotion, given the close relationship of this condition with several diseases, especially cardiovascular disease, which is the main cause of death in Brazil.
C O N T R I B U T I O N S
project and obtaining financial funding, coordinated all execution stages and performed the final revision of the article. All authors approved the final version of the manuscript.
A C K N O W L E D G E M E N T S
The authors would like to thank the Instituto Brasileiro de Geografia e Estatística (IBGE, Brazilian Institute of Geography and Statistics) for helping to identify the census tracts, the city halls of the municipalities visited, the community health agents and the studied population for their local support to the researchers.
R E F E R E N C E S
1. Oliveros E, Somers VK, Sochor O, Goel K, Lopez-Jimenez F. The concept of normal weight obesity. Prog Cardiovasc Dis. 2014;56(4):426-33.
2. World Health Organization. Global status report on noncommunicable diseases 2014. Geneva: WHO; 2014.
3. Moura EC, Claro RM. Estimates of obesity trends in Brazil, 2006-2009. Int J Public Health. 2012;57(1):127-33.
4. World Health Organization. Obesity and overweight. Geneva: WHO; 2015 [cited 2016 Mar 3]. Available from: http://www.who.int/ mediacentre/factsheets/fs311/en/
5. Instituto Brasileiro de Geografia e Estatística. Pesquisa de Orçamentos Familiares 2008-2009. Rio de Janeiro: IBGE; 2010 [acesso 2016 dez 12]. Disponível em: http://biblioteca.ibge.gov.br/ visualizacao/livros/liv45419
6. Ministério da Saúde (Brasil). Secretaria de Vigilân-cia em Saúde. Vigitel Brasil 2016: vigilânVigilân-cia de fatores de risco e proteção para doenças crônicas por inquérito telefônico: estimativas sobre fre-quência e distribuição sociodemográfica de fato-res de risco e proteção para doenças crônicas nas capitais dos 26 estados brasileiros e no Distrito Federal em 2016. Brasília: Ministério da Saúde; 2017.
7. Ministério da Saúde (Brasil). Pesquisa Nacional de Saúde: 2013: ciclos de vida: Brasil e grandes regiões. Rio de Janeiro: Ministério da Saúde; 2015.
8. Ferreira HS, Silva WO, Santos EA, Bezerra MKA, Silva BCV, Horta BL. Body composition and hypertension: A comparative study involving women
from maroon communities and from the general population of Alagoas State, Brazil. Rev Nutr. 2013;26(5):539-49. http://dx.doi.org/10.15 90/51 415-5273204300050005
9. Ferreira HS, Moura FA, Cabral CR, Florêncio TMMT, Vieira RC, Assunção ML. Short stature of mothers from an area endemic for undernutrition is associated with obesity, hypertension and stunted children: A population-based study in the semi-arid region of Alagoas, Northeast Brazil. Br J Nutr. 2009;101(8):1239-45.
10. Instituto Brasileiro de Geografia e Estatística. Censo 2010. Rio de Janeiro: IBGE; 2010 [acesso 2016 dez 12]. Disponível em: http://www.censo 2010.ibge.gov.br/
11. Ng M, Fleming T, Robinson M, Thomson B, Graetz N, Margono C, et al. Global, regional, and national prevalence of overweight and obesity in children and adults during 1980-2013: A systematic analysis for the Global Burden of Disease Study 2013. Lancet. 2014;384(9945):766-81.
12. Malta DC, Santos MAS, Andrade SSCA, Oliveira TP, Stopa SR, Oliveira MM, et al. Tendência temporal dos indicadores de excesso de peso em adultos nas capitais brasileiras, 2006-2013. Ciênc Saúde Coletiva. 2016;21(4):1061-9.
13. He Y, Pan A, Yang Y, Wang Y, Xu J, Zhang Y, et al. Prevalence of underweight, overweight, and obesity among reproductive-age women and adolescent girls in rural China. Am J Public Health. 2016;106(12):2103-10.
14. Correia LL, Silveira DMI, Silva AC, Campos JS, Machado MMT, Rocha HAL, et al. Prevalência e determinantes de obesidade e sobrepeso em mulheres em idade reprodutiva residentes na re-gião semiárida do Brasil. Ciênc Saúde Coletiva. 2011;16(1):133-45.
15. Prentice P, Viner RM. Pubertal timing and adult obesity and cardiometabolic risk in women and men: A systematic review and meta-analysis. Int J Obes. 2013;37(8):1036-43.
16. Luoto R, Männistö S, Raitanen J. Ten-year change in the association between obesity and parity: Results from the national FINRISK population study. Gend Med. 2011;8(6):399-406.
17. Nogueira JL, Saunders C, Leal MC. Métodos antropométricos utilizados na avaliação da retenção do peso no período pós-parto: uma revisão sistemática. Ciênc Saúde Coletiva. 2015;20(2):407-20. http://dx.doi.org/10.1590/14 13-81232015202.08112013
19. Lombard C, Deeks A, Jolley D, Teede H. Preventing weight gain: The baseline weight related behaviors and delivery of a randomized controlled intervention in community based women. BMC Public Health. 2009 [cited 2018 Apr 5];9(1):2. Available from: https://www.ncbi.nlm.nih.gov/pmc/ articles/PMC2630939/pdf/1471-2458-9-2.pdf 20. Florêncio TT, Ferreira HS, Cavalcante JC, Luciano
SM, Sawaya AL. Food consumed does not account for the higher prevalence of obesity among stunted adults in a very-low-income population in the Northeast of Brazil (Maceió, Alagoas). Eur J Clin Nutr. 2003;57(11):1437-46.
21. Ferreira HS, Luciano SCM. Prevalência de extre-mos antropométricos em crianças do estado de Alagoas. Rev Saúde Pública. 2010;44(2):377-80. 22. Lohman TG. The use of skinfold to estimate body
fatness on children and youth. J Phys Educ Recreat Dance. 1987;58(9):98-103.
23. World Health Organization. Obesity: Preventing and managing the global epidemic. Report of a WHO Consultation. Geneva: WHO; 2000. 24. Snitker S. Use of body fatness cutoff points. Mayo
Clin Proc. 2010;85(11):1057-8.
25. World Health Organization. Waist Circumference and Waist-Hip Ratio Report of a WHO Expert Consultation. Geneva: World Health Organization; 2011.
26. Ford ND, Patel SA, Narayan KMV. Obesity in low - and middle - income countries: Burden, drivers, and emerging challenges. Ann Rev Public Health. 2017;38(1): 145-64.
27. Wormser D, Kaptoge S, Di Angelantonio E, Wood A, Pennells L, Thompson A, et al. Separate and combined associations of body-mass index and abdominal adiposity with cardiovascular disease: Collaborative analysis of 58 prospective studies. Lancet. 2011;377(9771):1085-95.
28. Lima NP, Horta BL, Motta JVDS, Valença MS, Oliveira V, Santos TV, et al. Evolução do excesso de peso e obesidade até a idade adulta, Pelotas, Rio Grande do Sul, Brasil, 1982-2012. Cad Saúde Pública. 2015;31(9):2017-25.
29. Costa EC, Lira PIC, Oliveira JS, Menezes RCE, Tavares FCLP, Batista Filho M, et al. Evolução do excesso de peso e fatores associados em mulheres de 10 a 49 anos em Pernambuco, Nordeste, Brasil. Rev Nutr. 2014;27(5):513-24. http://dx.doi. org/10.1590/1415-52732014000500001 30. Veloso HJF, Silva AAM. Prevalência e fatores
as-sociados à obesidade abdominal e ao excesso de peso em adultos maranhenses. Rev Saúde Pública. 2009;43(2):83-9.
31. Oliveira LPM, Assis AMO, Silva MCM, Santana MLP, Santos NS, Pinheiro SMC, et al. Fatores associados a excesso de peso e concentração de gordura abdominal em adultos na cidade de Salvador, Bahia, Brasil. Cad Saúde Pública. 2009;25(3):570-82.
32. Pinho CPS, Diniz ADS, Arruda IKG, Batista Filho M, Coelho PC, Sequeira LADS, et al. Prevalência e fatores associados à obesidade abdominal em indivíduos na faixa etária de 25 a 59 anos do Estado de Pernambuco, Brasil. Cad Saúde Pública. 2013;29(2):313-24.
33. Almeida JB, Kian KO, Lima RC, Souza MCC, Cerhan J, Potter J. Total and abdominal adiposity and hypertension in indigenous women in Midwest Brazil. PLoS One. 2016;11(6):1-12. http://dx.doi. org/10.1371/journal.pone.0155528
34. Caminha TCS, Ferreira HS, Costa NS, Nakano RP, Carvalho RES, Xavier Junior AFS, et al. Waist-to-height ratio is the best anthropometric predictor of hypertension. Medicine. 2017;96(2):e5874. http:// dx.doi.org/ 10.1097/MD.0000000000005874 35. Romero-Corral A, Somers VK, Sierra-Johnson J,
Korenfeld Y, Boarin S, Korinek J, et al. Normal weight obesity: A risk factor for cardiometabolic dysregulation and cardiovascular mortality. Eur Heart J. 2010;31(6):737-46.
36. US Department of Health and Human Services, National Institutes of Health. Understanding adult obesity. WIN Weight-control Information Network: National Institute of Diabetes and Digestive and Kidney Diseases (NIDDK) NIH Publication No. 06-3680. 2018 [cited 2018 Apr 5]. Available from: https://www.niddk.nih.gov/health-information/ weight-management/adult-overweight-obesity/ all-content
37. Wanderley EN, Ferreira VA. Obesidade: uma perspecti-va plural. Ciênc Saúde Coletiperspecti-va. 2010;15(1):185-94. 38. Eickemberg M, Oliveira C, Roriz AK, Sampaio LR. Bioimpedância elétrica e sua aplicação em avaliação nutricional. Rev Nutr. 2011;24(6):883-93. http:// dx.doi.org/10.1590/51415-52732011000600009 39. Eickemberg M, Oliveira CC, Roriz AKC, Fontes
GAV, Mello AL, Sampaio LR. Bioimpedância elé-trica e gordura visceral: uma comparação com a tomografia computadorizada em adultos e idosos. Arq Bras Endocrinol Metab. 2013;57(1):27-32. 40. Pinheiro MM, Oliveira JS, Leal VS, Lira PIC, Souza
NP, Campos FACS. Prevalência do excesso de peso e fatores associados em mulheres em idade reprodutiva no Nordeste do Brasil. Rev Nutr. 2016;29(5):679-89. http://dx.doi.org/10.1590/16 78-98652016000500006
female reproductive factors with body composition: The Framingham Heart Study. J Clin Endocrinol Metab. 2013;98(1):236-44.
42. Theodoro H, Rodrigues AD, Mendes KG, Liane RH, Paniz VMV, Olinto MTA. Reproductive characteristics and obesity in middle-aged women seen at an outpatient clinic in southern Brazil. Menopause. 2012;19(9):1022-8.
43. Feng Y, Hong X, Wilker E, Li Z, Zhang W, Jin D, et al. Effects of age at menarche, reproductive years, and menopause on metabolic risk factors for cardiovascular diseases. Atherosclerosis. 2009;162(3):214-20.
44. Lourenço B, Queiroz BL. Seção Aprendendo Cres-cimento e desenvolvimento puberal na adoles-cência. Rev Med. 2010;89(2):70-5.
45. Mesa JMM, Martínez J, Araújo C, Horta BL, Gigante DP, Martinez J, et al. Growth patterns in early childhood and the onset of menarche before age twelve. Rev Saúde Pública. 2010;44(2):249-60. 46. Castilho SD, Pinheiro CD, Bento CA, Barros-Filho
ADA, Cocetti M. Tendência secular da idade da menarca avaliada em relação ao índice de massa corporal. Arq Bras Endocrinol Metabol. 2012;56(3):195-200.
47. Bubach S, Menezes AMB, Barros FC, Wehrmeister FC, Gonçalves H, Assunção MCF, et al. Impact of the age at menarche on body composition in adulthood: Results from two birth cohort studies. BMC Public Health. 2016 [cited 2018 Apr 5];16(1):1007. Available from: https://www. ncbi.nlm.nih.gov/pmc/articles/PMC5034580/ pdf/12889_2016_Article_3649.pdf
48. Oliveira EO, Velásquez-Meléndez G, Kac G. Fato-res demográficos e comportamentais associados
à obesidade abdominal em usuárias de centro de saúde de Belo Horizonte, Minas Gerais, Brasil. Rev Nutr. 2007;20(4):361-9. http://dx.doi.org/10. 1590/51415-52732007000400003
49. Teichmann L, Olinto MTA, Costa JSD, Ziegler D. Fatores de risco associados ao sobrepeso e a obe-sidade em mulheres de São Leopoldo, RS. Rev Bras Epidemiol. 2006;9(3):360-73.
50. Brown K, Apuzzio J, Weiss G. Maternal obesity and associated reproductive consequences. Womens Health. 2010;6(2):197-203.
51. Amer NM, Marcon SS, Santana RG. Índice de massa corporal e hipertensão arterial em indiví-duos adultos no Centro-Oeste do Brasil. Arq Bras Cardiol. 2011;96(1):47-53.
52. Lima FEL, Rabito EI, Dias MRMG. Estado nutricional de população adulta beneficiária do Programa Bolsa Família no município de Curitiba, PR. Rev Bras Epidemiol. 2011;14(2):198-206.
53. Mendonça RDD, Pimenta AM, Gea A, Fuente-Arrillaga C, Martinez-Gonzalez MA, Lopes ACS, et al. Ultraprocessed food consumption and risk of overweight and obesity: The University of Navarra Follow-Up (SUN) cohort study. Am J Clin Nutr. 2016;104(5):1433-40.
54. Zobel EH, Hansen TW, Rossing P, Von Scholten BJ. Global changes in food supply and the obesity epidemic. Curr Obes Rep. 2016;5(4):449-55. 55. Crino M, Sacks G, Vandevijvere S, Swinburn B,
Neal B. The influence on population weight gain and obesity of the macronutrient composition and energy density of the food supply. Curr Obes Rep. 2015;4(1):1-10.