Impact of
Trypanosoma cruzi
clonal evolution on its
biological properties in mice
M.J. de O. Toledo,
a,eM. de Lana,
b,*C.M. Carneiro,
bM.T. Bahia,
cG.L.L. Machado-Coelho,
dV.M. Veloso,
cC. Barnab
ee,
fM. Tibayrenc,
fand W.L. Tafuri
c,eaDepartamento de An
a
alises Clıınicas, Bloco I90, Universidade Estadual de Maringaa, Av.Colombo, 5790, 87020-900, Maringaa, PR, Brazil
bDepartamento de An
a
alises Clıınicas, Escola de Farmaacia, Rua Costa Sena, 171, Universidade Federal de Ouro Preto (UFOP), 35400-000, Ouro Preto, MG, Brazil
c
Departamento de Ci^eencias Bioloogicas, Instituto de Ciee^ncias Exatas e Bioloogicas, Campus Universitaario Morro do Cruzeiro, UFOP, 35400-000, Ouro Preto, MG, Brazil
d
Departamento de Farmaacia, Escola de Farmaacia, Rua Costa Sena, 171, UFOP, 35400-000, Ouro Preto, MG, Brazil
e
Departamento de Parasitologia, Instituto de Ciee^ncias Bioloogicas, Universidade Federal de Minas Gerais, Av.Antoo^nio Carlos, 6627, Campus Pampulha, 31270-901, Belo Horizonte, MG, Brazil
f
Geeneetique des Maladies Infectieuses, UniteeMixte de Recherche No.9926 Centre National de la Recherche Scientifique (CNRS)/Institut de Recherche pour le Deeveloppement (IRD), BP 5045, 34032, Montpellier Cedex 1, France
Received 7 June 2001; accepted 6 December 2001
Abstract
TwentyTrypanosoma cruzistocks attributed to the 19, 20, 39, and 32 clonal genotypes were comparatively studied in BALB/c mice during the acute and chronic phases of the infection to test the working hypothesis thatT.cruziclonal structure has a major impact on its biological properties. Fourteen parameters were assayed: (1) infectivity; (2) prepatent period; (3) patent period; (4) maximum of parasitemia; (5) day of maximum of parasitemia; (6) parasitemia; (7) mortality, (8) percentage of positive hemoculture, (9) tissue parasitism; (10) inflammatory process during the acute phase of the infection; (11) mortality, (12) percentage of positive hemoculture; (13) tissue parasitism; and (14) inflammatory process during the chronic phase of the infection. Statistical comparison showed that the results are overall consistent with the working hypothesis that biological differences are proportional to the evo-lutionary divergence among the genotypes. Thus, closely related genotypes (19 vs 20 and 32 vs 39) show in general fewer differences than distantly related groups (19 or 20 vs 32 or 39) except for the comparison between 19 and 32. The working hypothesis is even more strongly supported by the result of the nonparametric Mantel test, which showed a highly significant correlation (P¼2:3103) between biological differences and genetic distances among all pairs of stocks. These data taken together emphasize that it is crucial to take into account the phylogenetic diversity ofT.cruzinatural clones in all applied studies dealing with diagnosis, drug and vaccine design, epidemiological surveys, and clinical diversity of Chagas’ disease.
Index Descriptors and Abbreviations: Trypanosoma cruzi; phylogenetic distance; biological properties; clonal theory; multilocus enzyme electrophoresis (MLEE); randomly amplified polymorphic DNA (RAPD); acute phase (AP); chronic phase (CP); days after inoculation (d.a.i.); liver infusion tryptose (LIT); gastrointestinal tract (GIT); genitourinary tract (GUT); percentage of infectivity (%INF); percentage of mortality during the acute phase (%MORT AP); percentage of mortality during the chronic phase (%MORT CP); prepatent period (PPP); patent period (PP); maximum of parasitemia (MP); day of maximum of parasitemia (DMP); para-sitemia (PAR); percentage of positive hemoculture during the acute phase (% +HC AP); percentage of positive hemoculture during the chronic acute phase (% +HC CP); tissue parasitism (TP); inflammatory process (IP); tissue parasitism during the acute phase (TP AP); tissue parasitism during chronic phase (TP CP); inflammatory process during acute phase (IP AP); inflammatory process chronic phase (IP CP); Mann–Whitney test (MW); Kruskal–Wallis (KW); Kolmogorow–Smirnov test (KS).Ó2002 Elsevier Science
(USA). All rights reserved.
Experimental Parasitology 100 (2002) 161–172
www.academicpress.com
*Corresponding author. Fax: +55-21-31-3-559-16-28.
E-mail address:[email protected] (M. de Lana).
1. Introduction
Trypanosoma cruzi, the aetiological agent of Chagas’ disease, exhibits a great biological diversity for many parameters (Andrade, 1976; Andrade et al., 1985; Dvorak, 1984; Melo and Brener, 1978). Moreover, the clinical manifestations of the disease are also diverse (Brener, 1987; Dias, 1992; Rassi and Luquetti, 1992). Miles et al. (1981b) have suggested that this variability could be in part explained by this parasite’s genetic di-versity. Several authors have indeed shown an associa-tion between T. cruzi isoenzyme variability and its biological properties (Andrade and Magalh~aaes, 1997; Andrade et al., 1992, 1983; Carneiro et al., 1991; Dvorak et al., 1980; Marques De Arauujo and Chiari, 1988). However, these studies lacked either a sufficient sample size or a rigorous population genetic framework or both.
Tibayrenc et al. (1986) and Tibayrenc and Ayala (1988) have proposed thatT.cruzi undergoes predomi-nant clonal evolution with only rare events of genetic recombination. This clonal model predicts a parallel evolution between biological differences and genetic di-vergence among T. cruzi natural clones. Such a statis-tical association between genetic and biological differences has been found experimentally, in vitro by Laurent et al. (1997) and Revollo et al. (1998), and in the vector by Lana et al. (1998).
The present work explores the same working hy-pothesis in experimental infection in BALB/c mice.
2. Materials and methods
2.1. Parasites
The same standardized sample of 20 T. cruzistocks used for previous studies (Lana et al., 1998; Laurent et al., 1997; Revollo et al., 1998) has been used. The stocks were cloned by dilution and micromanipulation, with visual verification under microscope. They were fully characterized by MLEE with 15 ‘‘loci’’ (Tibayrenc and Ayala, 1988), then with both MLEE with 22 dif-ferent loci (Barnabee et al., 2000) and RAPD with 10 primers (Tibayrenc et al., 1993). They are representative of the ‘‘major clonets’’ (widespread clonal genotypes) 19, 20, 32, and 39 (Tibayrenc and Ayala, 1988). Ac-cording to the nomenclature recently proposed (Satellite Meeting, Rio de Janeiro, Anon, 1999), major clonets 19 and 20 are included inT.cruziI (Zymodeme 1 of Miles et al., 1981a; Lineage 1 of Tibayrenc, 1995; and lineage 2 of Souto et al., 1996) whereas both 32 and 39 groups are included in T. cruzi II (Zymodeme 2 of Miles et al., 1981a; Lineage 2 of Tibayrenc, 1995; and lineage 1 of Souto et al., 1996. Clonet 39 is equivalent to lineage 1/2 of Souto et al. (1996) considered as a hybrid clonal ge-notype (Brisse et al., 1998, 2000; Machado and Ayala, 2001). Information on the laboratory code, host, and geographic origin of these stocks is given in Table 1. The clonal genotypes 19, 20, 39, and 32 illustrate different phylogenetic relationships. Genotypes 32 and 39 are more closely related to each other, whereas genotype 19/
Table 1
Laboratory code, host and geographic origin of the 20Trypanosoma cruzistocks used in the present study
T.cruzigroupa Clonal genotype Stock Host Country Region
I 19 SP104 cl 1 Triatoma spinolai Chile Choquimbo I Cutia cl 1 Dasyprocta agudi Brasil Espirito Santo I Gambaa cl 1 Didelphis azarae Brasil S~aao Paulo I 13397 cl 7 Human, acute phase Bolııvia Santa Cruz I OPS21 cl 11 Human, acute phase Venezuela Cojedes I 20 SO34 cl 4 Triatoma infestans Bolııvia Potosi I Cuııca cl 1 Opossum cuica philander Brasil S~aao Paulo I P209 cl 1 Human, chronic phase Bolııvia Sucre I Esquilo cl 1 Sciurus aestuans ingramini Brasil S~aao Paulo I P11 cl 3 Human, chronic phase Bolııvia Cochabamba II 39 SC43 cl 1 Triatoma infestans Bolııvia Santa Cruz II Bug2148 cl 1 Triatoma infestans Brasil Rio Grande do Sul II Bug2149 cl 10 Triatoma infestans Brasil Rio Grande do Sul II SO3 cl 5 Triatoma infestans Bolııvia Potosi
II MN cl 2 Human, chronic phase Chile Santiago II 32 MAS cl 1 Human, chronic phase Brasil Brasıılia II CBB cl 3 Human, chronic phase Chile Tulahuen II TU 18 cl 2 Triatoma infestans Bolııvia Tupiza II IVV cl 4 Human, chronic phase Chile Santiago II MVB cl 8 Human, chronic phase Chile Santiago
20 is more distantly related to both 32 and 39 (Fig. 1). Lastly, 19 and 20 are very close to each other.
2.2. Experimental conditions
Groups of 20 female BALB/c mice originating from the Instituto de Ci^eencias Bioloogicas-UFMG, 28–30 days old, were inoculated through intraperitoneal route with 10,000 blood trypomastigotes/animal of each stock studied. Inocula were obtained from breast-fed Swiss mice in which the stocks were previously inoculated with
a high number of metacyclic trypomastigotes obtained from late stationary culture in LIT medium after treat-ment with guinea pig serum according to Deane et al. (1984).
During the AP of the infection, mice were checked every day for PAR and mortality registration until 90 d.a.i. Deaths that occurred between 90 days and 12 months after inoculation were registered as mortality during the CP. Inocula and PAR were counted according to Brener (1962). Sixty and 140 d.a.i. hemoculture in LIT medium (Filardi and Brener, 1987) was made with
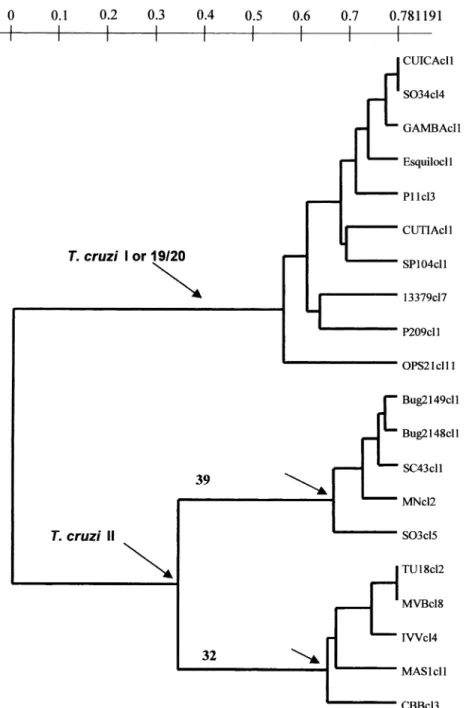
Fig. 1. An unweighted pair-group method with arithmetic averages (UPGMA) dendrogram depicting the phylogenetic relationships among the 20
Trypanosoma cruzistocks under study, assayed by 22 isoenzyme loci (Tibayrenc et al., 1993). Top cluster corresponds to clonal genotype 19/20 (T.cruziI), medium cluster corresponds to clonal genotype 39 (T.cruziII), and bottom cluster corresponds to clonal genotype 32 (T.cruziII). The scale indicates genetic distances estimated with the index of Jaccard (1908).
approximately 400lL of blood taken from each mouse (10 for AP and 10 for CP) through the retro-orbital plexus vein. Afterwards, four of these mice, two in the 30th d.a.i (AP) and two in the 110th d.a.i. (CP), were necropsied for histopathological studies. The following organs and tissues were collected: (1) heart, (2) skeletal muscle, (3) GIT including stomach, small and large intestine, (4) GUT including bladder, kidney and uterine tubes, (5) brain, (6) liver, (7) pancreas, and (8) fat tissue. This material was routine processed, included in paraffin. Sections 5lm thick of three blocks containing all organs of each mouse were obtained for further histopatho-logical analysis. These preparations were stained with hematoxylin–eosin for microscope examinations.
In some cases (animals infected with the SO34c14, P209c11 and MNc12) the immunohistochemical per-oxidase anti-perper-oxidase preparation (Barbosa, 1985) was processed to increase the detection of amastigotes.
2.3. Parameters evaluated
(a) %INF: percentage of mice with positive fresh blood examination and/or hemoculture.
(b) Mortality expressed in cumulative percentage of death registered during the AP (%MORT AP) and during the CP of infection (%MORT CP).
(c) PPP: the first day with positive fresh blood ex-amination.
(d) PP: the period with positive fresh blood examin-ation.
(e) MP expressed in the number of trypomastigotes/ 0.1 mL of blood, detected daily in fresh blood examin-ation.
(f) DMP.
(g) PAR: area under the curve.
(h) Percentage of mice with positive hemoculture during the acute (% +HC AP-60th d.a.i) and chronic phases (% +HC CP-140 d.a.i) of the infection.
(i) TP: number of organs or tissues with parasitism classified as absent ()), mild (+), moderate (++), and severe (+++) during the acute (TP AP) and chronic (TP CP) phases of the infection.
(j) IP: number of organs or tissues with inflammatory process classified as absent ()), mild (+), moderate (++),
and severe (+++) during the acute (IP AP) and chronic phases (IP CP) of the infection.
2.4. Statistical analysis
The statistical analysis of the parameters of virulence was done as follows: PPP, PP, MP, and DMP were compared with the nonparametric MW (Conares, 1980). Parameters %INF, %MORT, and %+HC were com-pared by chi-square test ðv2Þ. The area under the curve
of PAR was compared with the nonparametric KS. The histopathologic data (TP and IP) were analyzed with the nonparametric KW (Snedecor and Cochran, 1989).
A global analysis of the data was done with the nonparametric Mantel test (Mantel, 1967), which makes it possible to evaluate a possible correlation between, on one hand, genetic distances measured by either MLEE or RAPD, on the other hand, biological differences among the stocks. Contrary to the classical correlation test, this randomization procedure does not need any assumptions about the number of degrees of freedom. This procedure gives an equal weight to each biological parameter in the overall biological distance.
3. Results
3.1. Parameters of virulence
A great standard deviation was observed in PPP, PP, MP, and DMP showing that clones of the same genetic group are not homogeneous in their characteristics (Table 2). The mortality parameter was similar for the different genetic groups during the AP and significantly different only between the genotypes 20 and 39 during the CP of the infection. The rates of mortality during the CP were significantly higher ðp<0:001Þ than those observed during the AP of the infection (Table 3).
3.1.1. Infection with T. cruzi I (clonal genotypes 19 and 20)
Significant differences in four out of 14 parameters (Table 3) were observed in mice infected with the genetic groups 19 and 20, phylogenetically closely related, both
Table 2
Mean values and standard deviations of biological parameters under study in mice infected withTrypanosoma cruziof the genetic groups 19, 20, 39, and 32
Parameter Abbreviation Genetic groups
19 20 39 32
Prepatent period (days) PPP 14:46:5 11:35:5 11:16:2 13:65:5 Patent period (days) PP 28:821:8 34:812:6 24:821:0 26:215:5
aMaximum of parasitemia (103) MP 1925 297550 107186 1811
Day of MP (days) DMP 26:413:5 27:08:0 21:811:1 26:112:2
Table 3
Comparison of fourteen parameters under study in mice infected withTrypanosoma cruziof the genetic groups 19, 20, 39, and 32 Parameter Statistic
method
1920ðn19;n20Þ 1939ðn19;n39Þ 1932ðn19;n32Þ 2039ðn20;n39Þ 2032ðn20;n32Þ 3932ðn39;n32Þ
Prepatent period MW 156:3107:6(110, 146) 133:888:41(110, 111) 81:776:2(110, 49) 130:4127:1(146, 111) 90:5120:4(146, 49) 72:299:3(111, 49)
Patent period MW 74:088:2(71, 92) 72:963:8(71, 65) 54:052:4(71, 35) 88:166:2(92, 65) 70:646:6(92, 35) 49:352:7(65, 35)
Maximum of parasitemia MW 48:2100:0(70, 81) 61:074:6(70, 64) 48:861:3(70, 35) 86:755:7(81, 64) 69:932:2(81, 35) 50:050:0(64, 35)
Day of maximum of para-sitemia
MW 71:983:6(74, 81) 74:963:3(74, 64) 54:755:6(74, 35) 81:961:7(81, 64) 60:354:3(81, 35) 46:955:8(64, 35)
Tissue parasitism acute phase
KW 38:942:1(40, 40) 42:538:5(40, 40) 41:539:5(40, 40) 44:037:0(40, 40) 43:139:9(40, 40) 39:541:5(40, 40)
Tissue parasitism chronic phase
KW 40:540:5(40, 40) 38:542:5(40, 40) 40:540:5(40, 40) 38:542:5(40, 40) 40:540:5(40, 40) 42:538:5(40, 40)
Inflammatory process acute phase
KW 37:643:6(40, 40) 42:438:6(40, 40) 39:241:9(40, 40) 45:535:5(40, 40) 42:538:6(40, 40) 36:844:2(40, 40)
Inflammatory process chronic phase
KW 42:738:4(40, 40) 46:834:2(40, 40) 42:139:0(40, 40) 44:336:7(40, 40) 39:541:6(40, 40) 34:746:3(40, 40)
Infectivity v2 91:498:3(301, 330) 91:370:3(301, 311) 91:367:1(301, 296) 98:370:3(330, 311) 98:367:1(330, 296) 70367:1(311, 296)
Mortality acute phase v2 1:95:4(132, 153) 1:92:9(132, 136) 1:92:9(132, 136) 5:42:9(153, 136) 5:42:9(153, 136) 2:92:9(136, 136)
Mortality chronic phase v2 22:418:8(132, 153) 22:431:9(132, 136) 22:418:3(132, 136) 18:331:9(153, 136) 18:818:3(153, 136) 31:918:3(136, 136)
Hemoculture acute phase v2 89:395:5(49, 44) 89:357:6(49, 48) 89:382:8(49, 49) 95:557:6(44, 48) 95:582:8(44, 49) 57:682:8(48, 49)
Hemoculture chronic phase v2 100:098:0(49, 58) 100:040:9(49, 56) 100:081:0(49, 51) 98:040:9(58, 46) 98:081:0(58, 51) 40:981:0(46, 51)
Parasitemia KS 11.07(109, 96) 3.99(109, 107) 4.53(109, 97) 11.06(96, 107) 15.37(96, 97) 5.16(107, 97)
No of significant differences 4 9 4 11 6 6
Mean rank (MW¼Mann–Whitney test, KW¼Kruskal–Wallis test); Percentual (v2¼chi-square test);Zof Kolmogorov–Smirnov (KS¼Two-Sample Kolmogorov–Smirnov test). *
P<0:005.
** P<0:05.
***Not significant.
M.
J.de
O.Toledo
et
al./
Experimental
Parasitolo
gy
100
(2002)
161–172
T. cruzi I. The genetic group 19 with lower PAR and MP showed a higher value of PPP than genetic group 20 (Tables 3 and 4, Fig. 2). Clones of the genetic group 20 were significantly more infective and they led to a higher PAR (fresh blood examination) during the AP of the infection than clones from the genotype 19 (Table 3).
All five cloned stocks of this genotype induced patent PAR in mice while genotype 19 includes one subpatent stock (SP104 cl1).
3.1.2. Infection with T. cruzi II (clonal genotypes 39 and 32)
Mice infected with the stocks pertaining to the clonal genotypes 39 and 32 closely related bothT cruziII and phylogenetically distant from the genotypes 19 and 20, displayed significant differences in 6 out of 14 of the same parameters studied (Table 3). Mice infected with the genetic group 39 with a higher PAR (Fig. 2) showed the lowest values of PPP and percentages of positive hemocultures (in both phases of infection) (Table 2). Mice infected with the five stocks of the genetic group 39 showed the most dispersed results among them in rela-tion to many variables (individual data not shown). This group displayed the second highest MP and PAR (Fig. 2), mostly due to the high values of the stock Bug2149 c110 for these variables.
Only three stocks from the genotype 39 and two from the genotype 32 showed patent PAR in mice.
3.2. Histopathological data
The histopathological results revealed in general the presence of few amastigotes and inflammatory lesions. Parasitism was observed only in 5 organs/tissue
exam-ined: GIT and GUT were both more involved in this process, followed by skeletal muscles, heart and fat tis-sue. Inflammatory process was detected in all organs/ tissue examined except in the brain, and in general, the organs and tissues more affected were also GUT/GIT, skeletal musculature and heart.
Out of the 20 stocks studied, only nine (45%) dis-played a visible TP, generally classified as mild. Para-sitism was observed for three stocks of genotype 20 (AP), two stocks of genotype 19 (AP), three stocks of genotype 39 (CP), and one stock of genotype 32 (AP). Parasitism was observed in 8.13% of the organs/tissue in the AP (30th d.a.i.), and in 2.5% of the organs/tissue during the CP (110th d.a.i.) The number of organs/tissue with par-asitism in 40 analyzed by genotype during the AP was 4, 7, 0, and 2 for the genotypes 19, 20, 39, and 32, respec-tively (Table 4). Only mice infected with stocks from genotype 39 showed parasitism (four out of 40 organs/ tissue analyzed) during the CP (Table 4). Immuno-histochemical analysis did not change these results.
Inflammatory process was present in mice infected with all 20 stocks. Most cases were classified as mild, whereas severe inflammatory reactions were less. The inflammatory process was observed in 51.30% of the organs/tissue in the AP (30th d.a.i.), and in 45.63% of the organs/tissue during the CP (110th d.a.i). The numbers of organs/tissue with inflammatory process in 40 analyzed by genotype were: 18, 24, 16, and 24 during the AP and 22, 17, 11, and 23 during the CP for the genotypes 19, 20, 39, and 32, respectively (Table 4).
The genotypes 19, 20, and 32 displayed parasitism only during the AP (Table 4, Figs. 3A, C, and D). The genotype 39 was the only to show parasitism in the CP (three out of the five stocks) (Table 4, Figs. 4A–C).
Table 4
Number of organs or tissues with parasitism and inflammatory process in mice infected withTrypanosoma cruziof the genetic groups 19, 20, 39, and 32 during the acute and chronic phases of the infection
Parameter Phase of infection
Number of organs/tissue
Intensity Genetic groups
19 20 39 32
Tissue parasitism Acute 40 ) 36 33 40 38
+ 4 5 0 2
++ 0 2 0 0
Chronic 40 ) 40 40 36 40
+ 0 0 1 0
++ 0 0 3 0
Inflammatory process Acute 40 ) 22 16 24 16
+ 8 12 11 18
++ 10 10 5 6
+++ 0 2 0 0
Chronic 40 ) 18 23 29 17
+ 12 8 9 20
++ 10 9 2 3
3.2.1. Infection with T.cruzi I (clonal genotypes 19 and 20)
Histopathological results during both phases of the infection were not significantly different between ani-mals infected with genotypes 19 and 20 (Table 3). However, genotype 20 showed more severe parasitism during the AP than the genotype 19 (Table 4 and Figs. 3C and D). During the CP parasites were not observed in mice infected with these genotypes.
During the AP of the infection severe inflammatory reactions were observed only in mice infected with the genotype 20 (Table 4 and Fig. 3B). Moderate inflam-matory reaction (Figs. 3A, C, and D) was twice more frequent in mice infected with genotypes 19 and 20 in relation to the other genotypes (Table 4).
3.2.2. Infection with T. cruzi II (clonal genotypes 39 and 32)
Histopathological results were significantly different only during the CP of the infection for both the para-sitism and inflammatory process between animals in-fected with the genotypes 39 and 32 (Table 3). Stocks of
T. cruzi II showed during the AP of the infection only mild parasitism and only in mice infected with the ge-notype 32 (Table 4). Differently from the other three genotypes studied, only mice infected with stocks from the genotype 39 did not show parasitism during the AP of the infection. In contrast, this genotype was the only one that displayed parasitism during the CP of the in-fection (Table 4) especially in skeletal musculature and TGI. This was observed with three out of five stocks studied (Bug2149 c110, MN c12, and SO3 c15).
Mice infected with genotype 32 showed a higher number of organs/tissue with mild inflammatory reac-tion (Fig. 4D) in relareac-tion to animals of the other geno-types in both phases of the infection (Table 4). The lowest number of organs/tissue with inflammatory re-action among all genotypes was observed in mice in-fected with genotype 39 during the acute and also during
the CP of the infection when only mice infected with this genotype showed TP (Table 4 and Figs. 4A–C).
3.3. Statistical comparisons between T. cruzi I and T. cruzi II genotypes
Significant differences observed between the clonal genotypes 20 vs 39, 19 vs 39, 20 vs 32, and 19 vs 32 were 11, 9, 6, and 4, respectively (Table 3). In the comparison 20 vs 39, genotype 20 showed higher values of PP, MP, DMP, %INF, % +HC (both phases of the infection), PAR, TP AP, and IP AP than genotype 39, except TP CP (Table 3).
When genetic groups 19 vs 39 were compared, ge-notype 19 showed higher values of PPP, %INF, % +HC in both phases of the infection, TP AP and inflamma-tory process (CP) than genotype 39. On the other hand genotype 39 showed higher values of MP, PAR, and TP CP than genotype 19 (Table 3).
In the comparison of 20 vs 32, genotype 20 showed higher values of PP, MP, %INF, % +HC (CP), and PAR than genotype 32, except PPP (Table 3).
Finally in the comparison of 19 vs 32, genotype 19 showed higher values of %INF, % +HC (CP), and PAR than genotype 32 (Table 3). The MP was higher in group 32.
Overall, the decreased order of the four genetic groups considering all the parameters here studied for the 20 stocks is 20>19>32>39.
The result of the Mantel test evaluating the correla-tion between the matrices of 13 biological parameters (except PAR ¼ area under the curve of PAR) and ge-netic distances for all pairs of stocks was significant
ðP¼2:3103Þ.
4. Discussion
Many authors have tried to find a link between the genetic diversity ofT.cruziand this parasite’s biological diversity. The biological parameters tested were various in experimental conditions in vitro (Dvorak et al., 1980), behavior in vectors and in mice (Garcia and Dvorak, 1982;Andrade et al., 1983; Carneiro et al., 1991), and clinical manifestations of the disease in chagasic patients from which the parasite was isolated (Brenieere et al., 1985; Miles et al., 1981b). Andrade and Magalh~aaes (1997) studying 138T.cruzistocks isolated from various hosts and vast geographic areas of Lathi America clas-sified the stocks in three groups called ‘‘biodemes’’ which were correlated with ‘‘zymodemes.’’ Although the above-cited studies have brought significant contribu-tions, none of them relied on a clear population genetic framework. The present work, as well as previous ones published by other researchers of the same team (Lana et al., 1998; Laurent et al., 1997; Revollo et al., 1998),
Fig. 2. Curve of mean parasitemia in mice infected with the clonal genotypes 19, 20, 39, and 32 ofTrypanosoma cruzi.
aimed to fill up this gap. Based on the working hy-pothesis of T. cruzi clonal evolution (Tibayrenc et al., 1986), a standard set of 20 stocks representative of four ‘‘major clonets’’ (frequently isolated, ubiquitous clonal genotypes of major epidemiological relevance) as well as of the whole phylogenetic diversity ofT.cruzi, was an-alyzed for 14 different biological parameters.
The analysis of the 14 biological properties studied (all parameters of virulence and pathogenicity in mice) in relation with the genetic diversity is in agreement with the working hypothesis (Tibayrenc and Brenieere, 1988).
Our results are also consistent and corroborate previous observations in vitro and in BALB/c mice (Laurent et al., 1997), in acellular and cellular cultures (Revollo et al., 1998), and in Triatoma infestans (Lana et al., 1998) which confirmed the correlation between phylogenetic distance among T. cruzi clonal genotypes and their bi-ological properties. Although our data of experimental infection in BALB/c mice show the same general pattern as the results of Laurent et al. (1997), they cannot be compared directly because our animals were not immunosuppressed.
As for these previous analyses, a great standard de-viation in the majority of the parameters for a given clonet was observed again. Only the mortality parameter was similar for all genetic groups during AP although significant differences were observed between the genetic groups 20 and 39 during CP of the infection.
The great majority of clonal stocks studied were of low virulence. This fact associated with the low inocula used in the experiments could explain the relatively low TP observed in only 5 out of 8 organs/tissue and a generally discrete or moderate inflammatory reaction in
8 organs/tissue examined. Only the genotype 20, which is the more virulent, displayed severe inflammatory process. Such and other severe degenerative processes were never observed with the other clonal genotypes.
In previous studies (Lana et al., 1998; Laurent et al., 1997; Revollo et al., 1998), clonets 19 and 20 were plotted together, since they were very closely related and did not fall into distinct clusters when they were ana-lyzed with 22 isozyme loci (Barnabee et al., 2000). However, this could be due to the fact that isozyme markers lack resolution for the lowest levels of
phylo-Fig. 4. Microphotograph of BALB/c mice infected withTrypanosoma cruziII. (A) Skeletal muscle showing parasitism and mild inflammatory process during the chronic phase (110th day of infection) with MN cl2 stock, genotype 39 (660HE). (B) Fat tissue showing parasitism and mild in-flammatory process during the chronic phase with Bug2149 cl10 stock, genotype 39 (660HE). (C) Mild myocarditis and parasitism during the chronic phase of infection) with SO3 cl5 stock, genotype 39 (330HE). Insert showing amastigote nest (660HE). (D) Mild myocarditis and pericarditis with mononuclear infiltrate during the acute phase (30th day of infection) with MAS cl1 stock, genotype 32 (330HE). Arrows indicate amastigote nest.
genetic divergence. Although their clustering discrete-ness is not clear, these two clonal genotypes are reliably distinguished by one genetic marker, the isozyme locus 6 phosphogluconate dehydrogenase, which is homozy-gous for 19 and heterozyhomozy-gous for 20 (Tibayrenc et al., 1986). It is impossible to rule out the hypothesis that their medical and epidemiological relevance is different. In the present study, we have analyzed them separately. This made it possible to distinguish them for four im-portant variables of virulence during the AP of the in-fection (PPP, MP, %INF, and PAR), which demonstrated clearly the higher virulence of the genetic group 20 in comparison with genetic group 19. Al-though not always significant, histopathogical analysis also showed that mice infected with clones from this group showed more TP and inflammatory reaction in relation to all genotypes during the AP of infection. Genotypes 19 and 20, as well as ‘‘biodeme’’ III from Andrade and Magalh~aaes (1997), displayed similar be-havior and are classified asT.cruziI (Satellite Meeting, Rio de Janeiro, Anon, 1999).
On the other hand, genetic groups 39 and 32, closely related and phylogenetically distant from the genetics groups 19 and 20, were different in six parameters, four of them related with virulence, specially PAR that was higher due to the Bug2149 c10 stock from the genotype 39. The lowest PPP and DMP of this genotype, not only in relation to genetic group 32 but also in relation to the other genotypes, indicate its high virulence. However the lowest PP and % +HC during both phases of the infec-tion suggest its higher susceptibility to host’s immune response. These results corroborate those observed in mixed experimental infections in mice (Lana et al., 2000). In artificial mixtures involving either 19=20þ39 or 32þ39, the rates of successful reisolation were lower than for mixtures involving 19=20þ32 genotypes.
We have noticed an unexpected result in animals in-fected with stocks of the genotype 39 which did not show any TP AP of the infection, whereas data from the literature frequently show that detecting TP AP of the infection is easier, but not the contrary.
The other differences between 39 vs 32 were observed during the CP when the genotype 39 was the only one with TP, curiously not associated with inflammatory process, a fact already observed by other authors who have studied virulence and pathogenicity of differentT.
cruzistocks in animal experiments (Anselmi et al., 1965; Lana et al., 1992). Maybe this contrasting result ob-served with stocks of the genotype 39 can be explained by the fact that this genotype is a hybrid clonet, har-boring a combination of the genes of the two putative parental genotypes (Brisse et al., 2000).
Some previous results of Diego et al. (1998) concern-ing histopathological data were confirmed in the present work. These authors studied the AP of infection in Swiss mice infected with the 15 stocks of clonets 19, 20, and 39
that we have also analyzed. Similar results between these authors and us were observed: (i) for these three geno-types, the highest number of parasites and inflammatory lesions was observed in the skeletal muscles; (ii) the highest number of parasite in the skeletal muscles was observed with stocks of the genotype 39 during the CP. Contrary to Diego et al. (1998), we did not observe (i) parasites in lymphoid organs (liver and spleen) from mice infected with stocks of genotype 39; (ii) parasites and inflammatory lesions in the brain of mice infected with any genotype. Maybe the different inocula and lineage of mice used could explain these differences.
Considering the comparison between pairs of phy-logenetically distant genotypes the higher number of significant differences was observed between 20 vs 39 (11 differences), and 19 vs 39 (9 differences). These results are overall consistent with the working hypothesis that biological differences are proportional to the evolu-tionary divergence among the genotypes, since closely related genotypes (19 vs 20—T.cruziI and 32 vs 39—T.
cruzi II) show fewer differences than distantly related groups (19 vs 39 and 20 vs 39).
However only four and six significant differences were recorded between 19 vs 32, and 20 vs 32, respectively, also phylogenetically distant. Differences between ge-notypes 19 vs 32 were recorded in parameters linked to virulence: higher %INF, PAR, and % +HC during the CP of the infection for the genotype 19. In the com-parison of genotypes 20 vs 32 differences were also re-corded in parameters of virulence, which show clearly the higher virulence of the genetic 20. This genotype shows higher PP, MP, PAR, %INF, % +HC CP, and the lower PPP.
The working hypothesis of association between bio-logical parameters and evolutionary divergence among natural clones is even more strongly supported by the result of the nonparametric Mantel test, which showed a highly significant correlation (P¼2:3103) between
biological differences and genetic distances among pairs of stocks. This shows that evolutionary divergence and biological differences do not evolve independently, and can be statistically predicted from each other to a large extent. This is actually another manifestation of the linkage disequilibrium generated by predominant clonal evolution inT. cruzi(Tibayrenc et al., 1986). A similar pattern has been observed in the bacteriumEscherichia coli, which has a basically clonal population structure, although horizontal gene transfer is frequent in it (Miller and Hartl, 1986).
sus-ceptibility of the same set of stocks to Benznidazole and Itraconazole (Toledo et al., 2000) is also consistent with this hypothesis. Moreover, experiments dealing with artificial mixture of stocks pertaining to different clonal genotypes in vectors (Pinto et al., 2000) and in mice (Lana et al., 2000) suggested in some cases an interac-tion between different stocks. All these results taken together emphasize the fact that it is crucial to take into account the phylogenetic diversity of T. cruzi natural clones in all applied studies dealing with diagnosis, drug and vaccine design, epidemiological surveys, and clinical diversity of Chagas’ disease.
Acknowledgments
This work was supported by grants from FAPEMIG (Fundacß~aao de Amparo aa Pesquisa de Minas Gerais), Brasil.
References
Andrade, S.G., 1976. Tentative for grouping different Trypanosoma cruzi strains in some types. Revista do Instituto de Medicina Tropical de S~aao Paulo 18, 140–141.
Andrade, S.G., Magalh~aaes, J.B., 1997. Biodemes and zymodemes of
Trypanosoma cruzi strains: correlation with clinical data and experimental pathology. Revista da Sociedade Brasileira de Med-icina Tropical 30, 27–35.
Andrade, S.G., Magalh~aaes, J.B., Pontes, A.L., 1985. Evaluation of chemotherapy with Benznidazole and Nifurtimox in mice infected with Trypanosoma cruzistrains of different types. Bulletin of the World Health Organization 63, 721–726.
Andrade, S.G., Rassi, A., Magalh~aaes, J.B., Filho, F., Luquetti, A.O., 1992. Specific chemotherapy of Chagas disease: a comparison between the response in patients and experimental animals inocu-lated with the same strains. Transactions of the Royal Society of Tropical Medicine and Hygiene 86, 624–626.
Andrade, V., Brodskyn, C., Andrade, S.G., 1983. Correlation between isoenzyme patterns and biological behavior of different strains of
Trypanosoma cruzi. Transactions of the Royal Society of Tropical Medicine and Hygiene 77, 796–799.
Anon, 1999. International Symposium to commemorate the 90th anniversary of the discovery of Chagas disease. Recommmenda-tions from a Satellite Meeting, Rio de Janeiro, Brazil, 16-4-1999. Memoorias do Instituto Oswaldo Cruz. 94, (Suppl. I), pp. 429–432. Anselmi, A., Pifano, F.C., Suarez, A., Dominguez, A., Vazquez, A.O., Anselmi, G., 1965. Experimental Schizotrypanum cruzi myocard-itis. Correlation between histopathological and electrocardiographic findings in experimental Shags heart disease. American Heart Journal 72, 469–481.
Barbosa, A., 1985. Meetodo imuno-histoquıımico para a identificacß~aao de amastigotas de Trypanosoma cruziem cortes histoloogicos de rotina. Revista do Instituto de Medicina Tropical de S~aao Paulo 28, 91–96.
Barnabee, C., Brisse, S., Tibayrenc, M., 2000. Population structure and genetic typing of Trypanosoma cruzi, the agent of Chagas disease: a multilocus enzyme electrophoresis approach. Parasitology 150, 513–526.
Brener, Z., 1962. Therapeutic activity and criterion of cure on mice experimentally infected withTrypanosoma cruzi. Revista do Insti-tuto de Medicina Tropical de S~aao Paulo 4, 389–396.
Brener, Z., 1987. Pathogenesis and immunopathology of chronic Chagas disease. Memoorias do Instituto Oswaldo Cruz 82, 205–212.
Brenieere, S.F., Tibayrenc, M., Antezana, G., Pabon, J., Carrasco, R., Selaes, H., Desjeux, P., 1985. Reesultats preeliminaires en faveur d’une relation faible ou inexistante entre les formes cliniques de la maladie de Chagas et le souches isoenzymatiques deTrypanosoma cruzi. Comptes-Rendus de l’ Academie des Sciences de Paris 300, 555–558.
Brisse, S., Barnabee, C., Tibayrenc, M., 1998.Trypanosoma cruzi: how many relevant phylogenetic subdivisions are there? Parasitology Today 14, 178–179.
Brisse, S., Barnabee, C., Tibayrenc, M., 2000. Identification of six
Trypanosoma cruzi phylogenetic lineages by random amplified polymorphic DNA and multilocus enzyme electrophoresis. Inter-national Journal of Parasitology 30, 35–44.
Carneiro, M., Romanha, A.J., Chiari, E., 1991. Biological character-ization ofTrypanosoma cruzistrains from different zymodemes and schizodemes. Memoorias do Instituto Oswaldo Cruz 86, 387–393. Conares, W.J., 1980. Practical Non Parametric Statistics, second ed.
John Wiley & Sons, New York (Chapter 6).
Deane, M.P., Moriearty, P.L., Thomaz, N., 1984. Genes and other parasitic protozoa. In: Morel, C.M. (Ed.), Genes and Antigens of Parasites: A Laboratory Manual, second ed. Fundacß~aao Oswaldo Cruz, Rio de Janeiro, Brazil, pp. 11–21.
Dias, J.C.P., 1992. Epidemiology of Chagas disease. In: Wendel, S., Brener, Z., Camargo, M.E., Rassi, A. (Eds.), Chagas disease (American Trypanosomiasis): Its Impact on Transfusion and Clinical Medicine. ISBT BRAZIL-SBHH, S~aao, Paulo, pp. 49–80. Diego, J.A., Palau, M.T., Gamallo, C., Penin, P., 1998. Relationships
between histopathological findings and phylogenetic divergence in
Trypanosoma cruzi. Tropical Medicine and International Health 3, 222–233.
Dvorak, J.A., 1984. The natural heterogeneity ofTrypanosoma cruzi: Biological and medical implications. Journal of Cellular Biochem-istry 24, 357–371.
Dvorak, J.A., Hartman, D.L., Miles, M.A., 1980.Trypanosoma cruzi: correlation of growth kinetics to zymodeme type in clones derived from various sources. Journal of Protozoology 27, 472–474. Filardi, L.S., Brener, Z., 1987. Susceptibility and natural resistanceof
Trypanosoma cruzistrains to drugs used clinically in Chagas disease. Transactions of the Royal Society of Tropical Medicine and Hygiene 81, 755–759.
Garcia, E.S., Dvorak, J.A., 1982. Growth and development of two
Trypanosoma cruziclones in the arthropodDipetalogaster maximus. The American Journal of Tropical Medicine and Hygiene 31, 259–262.
Jaccard, P., 1908. Nouvelles recherches sur la distribution florale. Bulletin de la Societee vaudoise de Sciences Naturelles 44, 223–270. Lana, M., Chiari, E., Tafuri, W.L., 1992. Experimental Chagas disease
in dogs. Memoorias do Instituto Oswaldo Cruz 87, 59–71.
Lana, M., Pinto, A.S., Barnabee, C., Quesney, V., No€eel, S., Tibayrenc, M., 1998.Trypanosoma cruzi: compared vectorial transmissibility of three major clonal genotypes byTriatoma infestans. Experimental Parasitology 89, 1–5.
Lana, M., Pinto, A.S., Bastrenta, B., Barnabee, C., No€eel, S., Tibayrenc, M., 2000. Trypanosoma cruzi: Infectivity of clonal genotypes infections in acute and chronic phases in mice. Experimental Parasitology 96, 61–66.
Laurent, J.P., Barnabee, C., Quesney, V., No€eel, S., Tibayrenc, M., 1997. Impact of clonal evolution on the biological diversity of Trypan-osoma cruzi. Parasitology 114, 213–218.
Machado, C.A., Ayala, F.J., 2001. Nucleotide sequences provide evidence of genetic exchange among distantly related lineages of
Trypanosoma cruzi. Proceedings of the National Academy of Science USA 98 (13), 7396–7401.
Mantel, N., 1967. The detection of disease clustering and a generalized regression approach. Cancer Research 27, 209–220.
Marques De Arauujo, S., Chiari, E., 1988. Caracterizac ß~aao bioloogica de clones das cepas Y, CL e MR deTrypanosoma cruziem camun-dongos C3H isog^eenicos. Memoorias do Instituto Oswaldo Cruz 83,
175–181.
Melo, R.C., Brener, Z., 1978. Tissue tropism of differentTrypanosoma cruzistrains. Journal of Parasitology 64, 475–482.
Miles, M.A., Povoa, M.M., De Souza, A.A., Lainson, R., Shaw, J.J., Ketteridge, D.S., 1981a. Chagas disease in the Amazon Basin: II. The distribution ofTrypanosoma cruzizymodemes 1 and 3 Paraa state, north Brazil. Transactions of the Royal Society of Tropical Medicine and Hygiene 75, 667–674.
Miles, M.A., Povoa, M., Prata, A., Cedillos, R.A., De Souza, A.A., Macedo, V., 1981b. Do radically dissimilar Trypanosoma cruzi
strains (zymodemes) cause Venezuelan and Brazilian forms of Chagas disease? Lancet 8234, 1336–1340.
Miller, R.D., Hartl, D.L., 1986. Biotyping confirms a nearly clonal population structure in Escherichia coli. Evolution 40, 1–12.
Pinto, A.S., Lana, M., Britto, C., Bastrenta, B., Tibayrenc, M., 2000. Experimental Trypanosoma cruzi biclonal infection in
Triatoma infestans: detection of distinct clonal genotypes using kinetoplast DNA probes. International Journal for Parasitology 30, 843–848.
Rassi, A., Luquetti, A.O., 1992. Therapy of Chagas disease. In: Wendel, S., Brener, Z., Camargo, M.E., Rassi, A. (Eds.), Chagas Disease (American Trypanosomiasis): Its Impact on Transfusion and Clinical Medicine. ISBT BRAZIL’92, S~aao Paulo, pp. 237–256.
Revollo, S., Oury, B., Laurent, J.P., Barnabee, C., Quesney, V., Carrieere, V., No€eel, S., Tibayrenc, M., 1998. Trypanosoma cruzi:
impact of clonal evolution of the parasite on its biological and medical properties. Experimental Parasitology 89, 30–39.
Snedecor, G.W., Cochran, W.G., 1989. Statistical Methods, eighth ed. Iowa State University Press, Ames, 503pp.
Souto, R.P., Fernandes, O., Macedo, A.M., Campbell, D.A., Zingales, B., 1996. DNA markers define two major phylogenetic lineages of
Trypanosoma cruzi. Molecular and Biochemical Parasitology 83, 141–152.
Tibayrenc, M., 1995. Population genetics of parasitic protozoa and other microoganisms. Advanced in Parasitlogy 36, 47–115. Tibayrenc, M., Ayala, F.J., 1988. Isozyme variability inTrypanosoma
cruzi, the agent of Chagas disease: genetical, taxonomical, and epidemiological significance. Evolution 42, 277–292.
Tibayrenc, M., Brenieere, S.F., 1988.Trypanosoma cruzi: major clones rather than principal zymodemes. Memoorias do Instituto Oswaldo
Cruz 83, 249–255.
Tibayrenc, M., Neubauer, K., Barnabee, C., Guerrini, F., Skarecky, D., Ayala, F.J., 1993. Genetic characterization of six parasitic protozoa: parity between random-primer DNA typing and multilocus enzyme electrophoresis. Proceedings of the National Academy of Sciences of the USA 90, 1335–1339.
Tibayrenc, M., Ward, P., Moya, A., Ayala, F.J., 1986. Natural populations of Trypanosoma cruzi, the agent of Chagas disease, have a complex multiclonal structure. Proceeding of the National Academy of Sciences of the USA 83, 115–119.
Toledo, M.J.O., Lana, M., Bahia, M.T., Carneiro, C.M., Alves, C.F., Martins, H.R., Tibayrenc, M., Tafuri, W.L., 2000. Evaluation of chemotherapy with Benznidazole and Itraconazole in mice infected with different Trypanosoma cruziclonal genotypes. Memoorias do