Comparing the Effects of Different
Smoothing Algorithms on the Assessment of
Dimensionality of Ordered Categorical Items
with Parallel Analysis
Rudolf Debelak1,2, Ulrich S. Tran3*
1SCHUHFRIED GmbH, Mödling, Austria,2University of Zurich, Zurich, Switzerland,3University of Vienna, Vienna, Austria
Abstract
The analysis of polychoric correlations via principal component analysis and exploratory factor analysis are well-known approaches to determine the dimensionality of ordered cate-gorical items. However, the application of these approaches has been considered as critical due to the possible indefiniteness of the polychoric correlation matrix. A possible solution to this problem is the application of smoothing algorithms. This study compared the effects of three smoothing algorithms, based on the Frobenius norm, the adaption of the eigenvalues and eigenvectors, and on minimum-trace factor analysis, on the accuracy of various varia-tions of parallel analysis by the means of a simulation study. We simulated different data-sets which varied with respect to the size of the respondent sample, the size of the item set, the underlying factor model, the skewness of the response distributions and the number of response categories in each item. We found that a parallel analysis and principal compo-nent analysis of smoothed polychoric and Pearson correlations led to the most accurate results in detecting the number of major factors in simulated datasets when compared to the other methods we investigated. Of the methods used for smoothing polychoric correlation matrices, we recommend the algorithm based on minimum trace factor analysis.
Introduction
The assessment of dimensionality of a set of variables is a central issue in psychological and educational measurement, closely connected to theory building and psychological scale con-struction [1,2]. Very common exploratory approaches for determining the dimensionality of a set of variables are based on exploratory factor analysis (EFA) and principal component analy-sis (PCA), see [3]. Since an incorrect assessment of the dimensionality underlying a set of vari-ables can be of severe consequences for the interpretation of empirical data [4,5], multiple formal criteria have been developed to determine the number of factors or components to retain. For PCA, researchers have proposed, among other methods, the
eigenvalue-greater-OPEN ACCESS
Citation:Debelak R, Tran US (2016) Comparing the Effects of Different Smoothing Algorithms on the Assessment of Dimensionality of Ordered Categorical Items with Parallel Analysis. PLoS ONE 11(2): e0148143. doi:10.1371/journal.pone.0148143
Editor:Mansour Ebrahimi, Qom University, ISLAMIC REPUBLIC OF IRAN
Received:August 28, 2015
Accepted:January 13, 2016
Published:February 4, 2016
Copyright:© 2016 Debelak, Tran. This is an open access article distributed under the terms of the Creative Commons Attribution License, which permits unrestricted use, distribution, and reproduction in any medium, provided the original author and source are credited.
Data Availability Statement:All data files are available from the Figshare database (The DOI number is10.6084/m9.figshare.2064885).
Funding:This article was supported by the Open Access Publishing Fund of the University of Vienna.
than-one criterion [6], parallel analysis [7,8], the scree test [9], and Velicer’s Minimum Average Partial (MAP) rule [10]. In the context of EFA, an adaptation of parallel analysis [11], and, for maximum likelihood factor analysis, chi square significance tests and approaches based on information criteria like the Akaike Information Criterion [12] and the Bayesian Information Criterion [13] are among the methods which were suggested to assess the dimensionality of an item set. Among these methods, the adaptations of parallel analysis (PA) are commonly regarded to provide an accurate assessment under many conditions [2], although it has been noted that there is less evidence for the accuracy of PA in the context of EFA [14].
In applications of PA to discrete ordinal variables, Pearson correlations are often used, based on the assumption that a linear model underlies the variables. However, this approach has been shown to lead to biased results under specific conditions. The use of Pearson correla-tions may lead to biased results in binary data [15], and the application of tetrachoric correla-tions is recommended in this case. A more recent paper provided additional evidence that an EFA or PCA based on Pearson correlations may lead to biased results when compared to approaches based on tetrachoric or polychoric correlations, especially when response distribu-tions of the analyzed variables are skewed [16]. This result is in line with theoretical observa-tions, since it has been remarked by multiple authors that the possible range for Pearson correlation coefficients between ordered categorical variables is influenced by the relative fre-quency of the categories and may be limited in skewed variables, while the variables’skewness has no comparable effect on the estimations for tetrachoric and polychoric correlation coeffi-cients [17,18,19].
Some writers thus suggested the application of PCA or EFA based on tetrachoric or poly-choric correlations in ordinal variables as an alternative approach [2,15]. The use of polychoric and tetrachoric correlation coefficients assumes that a normally distributed latent variable underlies each of the observed ordinal variables, an assumption which may, however, be vio-lated in specific applications [18].
Multiple studies have been carried out to compare the accuracy of methods on the basis of polychoric correlation matrices with that of methods based on Pearson correlations. An exam-ple is [20], which compared maximum likelihood estimation based on Pearson correlations with weighted least squares mean and variance adjusted (WLSMV) estimation based on poly-choric correlations in the context of confirmatory factor analysis. In this simulation study, WLSMV estimation led to more accurate results in the analysis of categorical variables, espe-cially when the number of categories was small. A similar argument against the appropriate-ness of maximum likelihood estimation in the analysis of categorical data has been made by Olsson [21], again based on the results of a simulation study.
However, an often reported objection to the use of polychoric correlation matrices is the presence of indefinite correlation matrices [2,22]. As has been discussed by numerous authors (see, e.g., [23] and [19], p. 349) indefinite correlation matrices may be problematic for specific methods of multivariate analysis, like factor analysis. For this reason, several authors have advised against the use of tetrachoric and polychoric correlation matrices in factor analysis or described non-convergence as a severe problem [2,17]. Although specific variants of factor analysis have been proposed which may be applied to indefinite correlation matrices [24,25], the presence of negative eigenvalues forbids interpreting eigenvalues with regard to the vari-ance that is explained by the respective factors [16]. Several authors [2,15,26] have thus sug-gested to apply smoothing algorithms [27] which transform indefinite correlation matrices into positive definite ones, to avoid this problem. However, only few studies have investigated the effect of applying smoothing algorithms on dimensionality assessment with PCA or EFA in ordered categorical variables [2,16,26], and results were also mixed. While Garrido et al. [16] recommended the use of smoothed polychoric correlations to assess the dimensionality of sets
of ordinal items, Timmerman and Lorenzo-Seva [2] did not generally advise their use, because of computational problems, like convergence problems in the calculation of the polychoric matrices. The study of Debelak and Tran [26] indicated that the application of different smoothing algorithms may lead to slightly different results in the special case of a PCA of binary items which they investigated. Based on these results, little recommendations regarding the choice of an appropriate smoothing algorithm can be given to the practical researcher who wishes to apply PA to assess the dimensionality of ordinal variables. Thus, the present study examines the effect of various smoothing algorithms on dimensionality assessment with PCA or EFA in ordered categorical variables by the means of a simulation study.
This paper is organized as follows. In the next section, previous studies on the application of PA in EFA and PCA with and without smoothing algorithms to ordinal data are summarized. Subsequently, we discuss several smoothing algorithms for indefinite correlation matrices described in the literature. We then present the results of a simulation study on the application of a PCA and principal axes factoring of smoothed polychoric and Pearson correlations. A summary of our findings and recommendations for applied researchers are provided in the Discussion section.
The use of parallel analysis with ordinal data
Many authors recommended PA, a method which was suggested by Horn [8] in the context of PCA, to determine the number of factors or components in EFA or PCA [4,28]. In its original form, PA consists of two major steps: First, the eigenvalues of the correlation matrix of the dataset are computed. In a second step, a number of datasets which are comparable to the orig-inal dataset with respect to the sample size, the number of items and the distribution of the responses, but consist of uncorrelated items, are simulated. Based on these simulated datasets, the distribution of random eigenvalues is obtained. The number of dimensions underlying the dataset is determined by comparing the eigenvalues observed in the dataset and the distribu-tion of random eigenvalues which are observed when there is no reladistribu-tionship between the items. An alternative method for conducting PA in EFA, which was based on principal axis fac-toring (PAFA), has been described by [11] and [29]. In the alternative approach, a modified correlation matrix is used, which contains communality estimates in its diagonal. In the simu-lation study presented by Timmerman and Lorenzo-Seva [2], a comparison of this modified approach to the original PA of Horn [8] indicated that the original approach led to more accu-rate results. This study also investigated the accuracy of PA with minimum rank factor analysis (MRFA). This approach for EFA aims at minimizing the amount of unexplained variance given a predefined number of common factors under the constraint that the reduced correla-tion matrix is positive-definite [2]. It was found that PA, when applied with MRFA, led to slightly more accurate results than PA applied to PCA in the datasets of their simulation study. In this study, the latent factors underlying all datasets were uncorrelated.
Timmerman and Lorenzo-Seva [2] also compared the accuracy of PA when applied to a PCA and EFA of polychoric and Pearson correlations. They found that approaches based on polychoric correlations generally led to accurate results, but also reported problems with non-convergence of the polychoric correlation matrices in the calculation of critical eigenvalues. In their study, PA was regarded non-convergent if 25 simulated matrices in a row were found to be indefinite or did not converge. In all cases where the polychoric correlation matrices con-verged, PCA and MRFA based on polychoric correlation matrices was found to be more accu-rate than PCA and MRFA based on Pearson matrices. Nevertheless, Timmerman and
slightly more accurate results using the 95thor 99thpercentile of the random eigenvalue distri-butions [7] than their mean [8] in datasets with uncorrelated latent factors. The simulation study of Timmerman and Lorenzo-Seva [2] calculated polychoric correlations using the two-step algorithm of Olsson [30]. This algorithm is based on maximum likelihood estimation of the correlation coefficient, while the thresholds which define the relation between the latent continuous variables and the categories of the manifest ordinal variable are calculated directly from the observed cumulative marginal proportions of each category in the data (see also the Methodssection).
A recent simulation study [16] further investigated the accuracy of PA applied to PCA and MRFA in assessing the dimensionality of ordinal variables. Results indicated that PA with Pearson correlations is inaccurate with large levels of skewness and the use of PA with polycho-ric correlations was recommended for the dimensionality assessment of ordinal data. PCA tended to lead to more accurate solutions than MRFA in datasets with few (four) variables per factors, and also in datasets with correlated latent factors, whereas it was less accurate in data-sets with a medium (eight) or large (12) number of variables per factor. Garrido et al. [16] used a smoothing algorithm described by Knol and Berger [31] (see next section) to circumvent the problem of indefinite polychoric correlation matrices.
Some further improvements on the original PA approach have been suggested as well, e.g., [7,32]. While Horn [8] originally recommended the use of the mean of the distribution of the simulated eigenvalues in PA to determine the number of components to retain, Glorfeld [7] first advocated using the 95thpercentile as a threshold to determine the number of compo-nents. This leads to more accurate results in datasets with uncorrelated factors, while Horn’s original method seems to lead to more accurate results when factors are correlated [16,33,34].
Further, several authors criticized that the procedure used in traditional parallel analysis is based on a model with 0 underlying factors [32,35]. It has been argued that, while this proce-dure may be appropriate to assess the presence of a single common factor in the data, it may be inappropriate for evaluating the presence of additional factors. Green et al. [32] thus have sug-gested incorporating all precedent k factors or components in modeling the reference distribu-tion of the subsequent (k+1)th eigenvalue to improve the accuracy of parallel analysis. The (k +1)th critical eigenvalue is obtained by fitting a factor model with k factors on the dataset. In a second step, new datasets with the same number of variables and subjects as in the original dataset are simulated based on a model with k factors, whose loadings are identical to those observed in the original dataset. A descriptive statistic (like the mean or a specific percentile value) is calculated to summarize the distribution of the (k+1)th eigenvalue in these simulated datasets. This descriptive statistic is further used as a critical threshold for the (k+1)th eigen-value. This method has been further investigated in a row of recent studies [36,37].
Some smoothing procedures for indefinite correlation matrices
The application of polychoric correlation matrices in the analysis of discrete ordinal variables assumes that a latent continuous normally distributed variable underlies each observed vari-able. The polychoric correlation is a maximum likelihood estimator of the Pearson correlation between the two normally distributed underlying variables [19]. However, since the estimation of the polychoric correlation matrix is based on different marginals for each correlation coeffi-cient, the resulting matrix may be indefinite [31].
In order to apply PCA and factor analytical methods in these cases, several smoothing algo-rithms have been suggested, e.g., [2,16]. We will describe some selected algorithms below. All described smoothing algorithms have in common that they do not alter positive definite corre-lation matrices to which they are applied.
Higham [40] suggested an algorithm which searches for the symmetric positive definite matrix X which minimized the Frobenius norm to a given symmetrical matrix A. The Frobe-nius norm is defined bykA XkF¼
X
i;j ða xÞ2
i;j. This algorithm has been implemented in the R package Matrix [41].
An alternative approach for transforming indefinite correlation matrices into positive defi-nite ones was described by Bentler and Yuan [42]. Given a symmetric indefinite matrixR, [42] proved that a positive definite matrixRcan be obtained by
R¼DR0DþDR ð1Þ
Informula (1),R0results fromRby setting its diagonal entries to 0,DRis the diagonal
matrix containing the diagonal elements ofR. Furthermore,Δis a positive definite matrix
which meets the condition thatDR−Δ2(R−D) is positive definite, whereDis a diagonal matrix
with nonzero elements such that (R−D) is positive semidefinite. Bentler and Yuan [42] further
demonstrate a variation of their approach which is based on minimum trace factor analysis [43]. This approach can be applied using functions implemented in the R packages psych [44] and Rcsdp [45], see [26].
Knol and Berger [31] described another smoothing algorithm, which was later also sug-gested by [15] and applied in the simulation studies [16] and [26]. This smoothing algorithm is based on the idea to set eigenvalues which are smaller than a predefined thresholdδand to
cor-rect the associated eigenvectors accordingly to obtain a correlation matrix whose eigenvalues are thus greater than or equal toδ. LetR=KDKtbe the eigendecomposition of the symmetric
matrixR, withDbeing a diagonal matrix of its eigenvaluesλi,Kthe matrix of the
correspond-ing normalized eigenvectors, andD+a diagonal matrix in which all eigenvalues lower thanδ
have been replaced withδ, see [31]. Then, ifDiag(X) denotes the matrix containing the entries
of the main diagonal ofX, a correlation matrix with eigenvalues greater thanδcan be obtained
by calculating.R(δ) = [Diag(KD+Kt)]−1/2KD+Kt[Diag(KD+Kt)]−1/2. Debelak and Tran [26]
reported that this smoothing algorithm leads to results similar to those obtained with the algo-rithm of Higham [40] when used in PCA of binary items.
Another approach for smoothing indefinite correlation matrices has been proposed by Knol and ten Berge [23]. In contrast to the smoothing algorithms by Bentler and Yuan [42], Higham [40], and Knol and Berger [31], this smoothing algorithm allows defining rows and columns of the original correlation matrix which should not be altered by the smoothing algorithm. For the remaining parts of the correlation matrixR, an approximation matrixRis determined which is positive definite, symmetrical withDiag(R) =Iand additionally meets the criterion that the trace of (R−R)2is minimized. For finding this minimum, an iterative algorithm
many practical applications, it is, to our knowledge, currently not implemented in any widely available software program.
Additional smoothing algorithms have been made available in specific software programs and packages. For the users of the R programing language, appropriate functions are contained in several software packages, like sfsmisc [46] and psych [44]. However, these algorithms are based on similar ideas as the ones described above, and are therefore not described in further detail.
It should be noted that the approaches described by Bentler and Yuan [42] and Knol and Berger [31] generally alter only few cells in an indefinite correlation matrix to obtain a positive definite correlation matrix, which constitutes an important difference to the algorithm of Higham [40] that makes small modifications to the complete correlation matrix. In contrast to this algorithm, the method of Bentler and Yuan [42] is based on the idea of rescaling variables of the indefinite correlation matrix which correspond to Heywood cases. In their simulation study on binary variables, Debelak and Tran [26] found that the algorithm of Bentler and Yuan [42] led to more accurate results than the algorithm of Higham [40] under most examined conditions.
Goals of the current study
A number of studies compared the accuracy of PA in assessing the dimensionality of an item set in the context of PCA and EFA when applied to polychoric correlation matrices with its accuracy when applied to Pearson correlation matrices [2,15,16,26]. These studies generally found that PA based on polychoric matrices led to an accurate assessment of the dimensional-ity of an item set, but the problem of indefinite polychoric correlation matrices led to the rec-ommendation to use smoothing algorithms [15], and to the evaluation of various smoothing algorithms [2,16,26]. Although the application of smoothing algorithms has been shown to enhance the accuracy of PA of polychoric correlations, little is known on the effects of different smoothing algorithms on the accuracy of PA. Although this issue has been examined in [26], this study was constrained to the investigation of PCA applied to tetrachoric correlations, so the generalization of these results to more general conditions (i.e., items with three or more response categories) or to the application of EFA remains unclear. The main goal of the current study was therefore to evaluate the application of three different widely available smoothing algorithms, and their effect on the accuracy of Horn’s [8] and Glorfeld’s [7] variations of PA in the context of PCA and principal axes factor analysis (PAFA) ([11,29]) as a method of EFA. It should be noted that several recent simulation studies [2,16] included MRFA as a promising method of EFA. This method was not included in this simulation study, since it is, to the best of our knowledge, currently not available in published R packages.
Methods
We carried out a simulation study to compare the accuracy of PA with PCA and PAFA based on polychoric correlations, with and without applying a smoothing algorithm, with the results obtained from a PCA and PAFA based on Pearson correlations. In our study, responses from a person sample to an item set were simulated based on several specific factor models.
The simulated datasets varied in the following aspects: (a) the size of the respondent sample, (b) the size of the item set, (c) the number of response categories, (d) the skewness of the response distribution, (e) the underlying factor model, and (f) the applied correlation method and smoothing algorithm. The design of our simulation study resembles those of previous studies on the accuracy of PA reported in the literature, e.g., [2,15,26,33]. Under each condi-tion, the critical eigenvalue for determining the dimensionality of the item set was obtained as the mean (Horn [8]) or the 95thpercentile (Glorfeld [7]) of the random eigenvalue distribu-tions, respectively. When parallel analysis was applied, the random eigenvalue distribution was obtained by drawing 100 random samples from a simulated response matrix under each condi-tion. Under each condition, the random samples were generated through a permutation of the original response matrix.
In the context of PAFA, the approach of [11], in which the correlation matrix is modified to contain communality estimates in its diagonal, was further used to apply PA. In the cases where this approach was combined with a smoothing procedure, the smoothing procedure was first applied to obtain a positive definite correlation matrix. In a second step, the Humphreys and Ilgen approach [11] was then used to determine the dimensionality of the variable set.
Size of the respondent sample
Three different sizes of samples were used, which consisted of 200, 500 and 1000 respondents. This choice aimed to reflect the sample sizes found in practical applications of PCA and EFA. Numerous studies have already demonstrated that the size of the respondent sample has a sig-nificant impact on the accuracy of PA [2,16,26,33]. We therefore expected to obtain more accu-rate results in datasets with a greater respondent sample.
Underlying factor model
The response matrices analyzed in our study were based on a factor model which contained major, minor, and unique factors. Following earlier studies [2,48], the inclusion of many minor factors in our simulations aimed at simulating the effect of random factors on the observed var-iables which go beyond the effects of unique factors. These minor factors can be thought of as representing random influences on the observed variables and noise which cannot be con-trolled in applied research. Similar to the simulation study of Timmerman and Lorenzo-Seva [2], the population correlation matrix∑popof the latent variables underlying the discrete
responses to the items was given as
Spop¼wmaLmaL t
maþwmiLmiL t
miþwunIJ ð2Þ
In this formula,ΛmaandΛmistand for the factor loading matrices of the major and minor
factors, respectively, withLtmaandL t
mibeing the transposed loading matrices. In our
simula-tions, each major factor loaded on a constant number of variables, which was 5 or 15, depend-ing on the simulated condition. Since we simulated conditions with one or three major factors, cases with 5, 15 or 45 variables were simulated. If a major factor loaded on a specific variable, the specific loadingΛmawas set to 1, otherwise it was set to 0. The simulated factor models can
loadings of minor factors, which were included in some of our simulations. If minor factors were present, their number was set to be 40. The loadings of the minor factors on the variables were drawn from an uniform distribution in the interval [-1;1].IJis an identity matrix of size J,
with J being the number of the variables.wma,wmiandwunare weights which determined the
loadings of major and minor factors in the simulated dataset. The analyzed datasets differed with regard to the size of the loadings of the underlying factors on the observed variables. In conditions with high and medium factor loadings,wmawas set to be 0.5 and 0.3 respectively.
wmiwas set to 0 in simulated datasets where minor factors were absent, and to
0:2wma Eð^mi^tmiÞwhere
minor factors were present in the data.wunwas set to (1−wmi−wma). It follows thus that in
datasets without minor factors about 50% and 30% of the variance of the observed variables could be explained by the major factors in conditions with high and medium factor loadings, respectively. The resulting relationship between all major factors and the observed variables allowed us to use the number of major factors as criterion for the dimensionality of each data-set. Based on the population correlation matrix∑popa set of 5, 15 or 45 continuous variables
was defined which followed a multivariate standard normal distribution. This set was further transformed into a set of discrete ordinal variables by applying thresholds, which further defined the number of the response categories and the skewness of the response distribution.
Number of categories
In our simulation study, items with two, three or four response categories were simulated. While we expected the differences between methods based on Pearson and polychoric correla-tions to be most pronounced in condicorrela-tions with two response categories, items with three or more response categories are regularly used in psychological and clinical assessments.
Skewness of the response distribution
For each number of response categories, a symmetrical and a skewed distribution of the observed variables were simulated. In case of a symmetrical distribution, the expected frequen-cies of observations were set to be equal for all response categories. In the skewed response dis-tributions, the thresholds for defining the ordinal variables were set so that the response categories were observed with expected relative frequencies of [0.2; 0.8], [0.1; 0.2; 0.7], and [0.1; 0.1; 0.1; 0.7] under the conditions of simulated variables with two, three or four response cate-gories, respectively. This led to response distributions with an estimated skewness of about 1.4, which may be interpreted as a meaningful departure from normality, see [16]. We expected the difference between methods based on Pearson and polychoric correlation matrices to be more pronounced under skewed response distributions.
In summary, 2 (number of major factors) x 2 (number of variables per major factor) x 3 (number of simulated respondents) x 3 (number of the response categories) x 2 (skewness of the response distribution) x 2 (presence of minor factors) x 2 (factor loadings) = 288 different conditions were simulated. Under each condition, the datasets were analyzed using four differ-ent variations of PA, which were based on PCA or EFA and used the criterion of Horn [8] or Glorfeld [7], respectively. 100 response matrices were simulated under each condition. In each simulated dataset, it was assessed how many factors or components were retained, and whether this number was identical to the number of major factors. The code used in this simulation study can be provided by the first author.
approach appeared to be numerically more stable than an alternative procedure which esti-mated the threshold coefficients simultaneously for the whole matrix. For implementing the smoothing algorithms of Higham [40] and Bentler and Yuan [42], methods from the R pack-ages Matrix [41], psych [44] and Rcsdp [45] were used. In order to apply the smoothing algo-rithm of Knol and Berger [31], code was written in R, which can be obtained from the authors. In our simulations, the constantδwas set to 0.1. We further investigated the accuracy of each
parallel analysis method if no smoothing algorithm was applied.
Results
Overall results
We first present some tables which summarize the accuracy of the dimensionality assessment of each method under each condition. Each dimensionality assessment was considered as accu-rate if the number of major factors was correctly measured. In general, all smoothing algo-rithms led to comparable results across all simulated conditions. Therefore, only the results obtained with the algorithms of Bentler and Yuan [42] and Knol and Berger [31] will be pre-sented in detail. Overall, these two algorithms led to the most accurate assessments of dimensionality, with the algorithm of Bentler and Yuan [42] correctly identifying the number of greater factors in about 91.5% of the simulated datasets and the algorithm of Knol and Ber-ger [31] in about 90.7% of the simulated datasets. The algorithm of Higham [40] (90.3% correct assessments) and the analysis of the indefinite correlation matrices (89.14% correct assess-ments) led to only slightly less accurate results. The methods based on the analysis of Pearson correlation matrices led to a correct assessment of dimensionality in 91.3% of the simulated datasets. We now present several tables which present the percentage of simulated datasets in which the number of major factors was reported correctly by the application of parallel analy-sis. The entries in the individual cells of these tables are based on 3600 datasets (in columns which present results for different numbers of major factors or different numbers of variables per factor) or 2400 datasets (in columns which present results for different numbers of respon-dents or different response categories). The confidence intervals for the individual entries in these tables are smaller than ± 1.6 for entries based on 3600 datasets and smaller than ± 2 for entries based on 2400 datasets, based on a significance level of 0.05. However, it should be noted that the size of the confidence interval is smaller for entries closer to 0 and 100. For entries above 90, the respective confidence intervals are smaller than ± 1.0 for entries based on 3600 datasets and smaller than ± 1.2 for entries based on 2400 datasets, again based on a signif-icance level of 0.05. Additional detailed results for the accuracy of parallel analysis in datasets with high and medium factor loadings are provided inS1 Appendix.
Table 1summarizes the results of the simulations where the response distribution was sym-metrical, with no minor factors present.
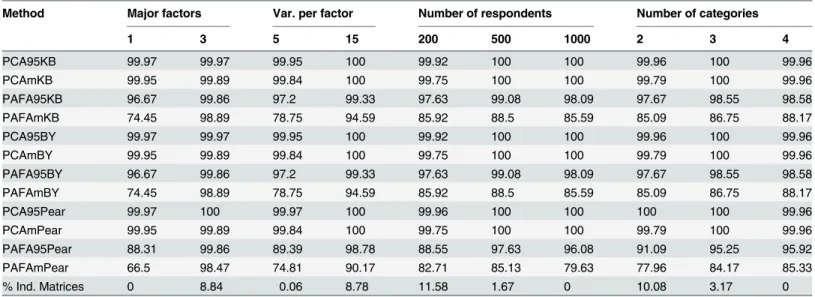
Table 2presents the analogous results of the simulations with symmetrical response distri-bution, with minor factors present.
The Tables3and4present the results with skewed response distribution without (Table 3) and with minor factors (Table 4).
Indefinite correlation matrices
Table 1. Rate (in percent) of correctly detected number of major factors under different variations of PA when minor factors were not present under a symmetrical response distribution.
Method Major factors Var. per factor Number of respondents Number of categories
1 3 5 15 200 500 1000 2 3 4
PCA95KB 100 99.95 99.95 100 99.92 100 100 99.92 100 100
PCAmKB 99.89 99.92 99.86 99.95 99.71 100 100 99.71 100 100
PAFA95KB 97.33 99.86 97.61 99.59 98.25 98.71 98.84 98.3 98.21 99.29
PAFAmKB 81.17 98.81 83.92 96.06 88.88 90.63 90.46 86.46 90.59 92.92
PCA95BY 100 99.95 99.95 100 99.92 100 100 99.92 100 100
PCAmBY 99.89 99.92 99.86 99.95 99.71 100 100 99.71 100 100
PAFA95BY 97.33 99.86 97.61 99.59 98.25 98.71 98.84 98.3 98.21 99.29
PAFAmBY 81.17 98.84 83.92 96.09 88.92 90.63 90.46 86.5 90.59 92.92
PCA95Pear 100 99.97 99.97 100 99.96 100 100 99.96 100 100
PCAmPear 99.86 99.89 99.86 99.89 99.63 100 100 99.67 99.96 100
PAFA95Pear 88.73 99.81 89.17 99.36 86.5 98.21 98.09 93.04 94.46 95.3
PAFAmPear 74.45 98.53 79.31 93.67 85.13 86.92 87.42 80.09 88.13 91.25
% Ind. Matrices 0 8.12 0 8.12 11.33 0.84 0 9.17 3 0
Note. PCA = Principal Component Analysis, PAFA = Principal Axes Factor Analysis; 95 = 95% eigenvalue, m = mean eigenvalue; KB = polychoric correlation with Knol-Berger smoothing algorithm, BY = polychoric correlation Bentler-Yuan smoothing algorithm, Pear = Pearson; Var. per factor = Variables per major factor; % Ind. Matrices = Percentage of indefinite correlation matrices
doi:10.1371/journal.pone.0148143.t001
Table 2. Rate (in percent) of correctly detected number of major factors under different variations of PA when major and minor factors were pres-ent under a symmetrical response distribution.
Method Major factors Var. per factor Number of respondents Number of categories
1 3 5 15 200 500 1000 2 3 4
PCA95KB 99.97 99.97 99.95 100 99.92 100 100 99.96 100 99.96
PCAmKB 99.95 99.89 99.84 100 99.75 100 100 99.79 100 99.96
PAFA95KB 96.67 99.86 97.2 99.33 97.63 99.08 98.09 97.67 98.55 98.58
PAFAmKB 74.45 98.89 78.75 94.59 85.92 88.5 85.59 85.09 86.75 88.17
PCA95BY 99.97 99.97 99.95 100 99.92 100 100 99.96 100 99.96
PCAmBY 99.95 99.89 99.84 100 99.75 100 100 99.79 100 99.96
PAFA95BY 96.67 99.86 97.2 99.33 97.63 99.08 98.09 97.67 98.55 98.58
PAFAmBY 74.45 98.89 78.75 94.59 85.92 88.5 85.59 85.09 86.75 88.17
PCA95Pear 99.97 100 99.97 100 99.96 100 100 100 100 99.96
PCAmPear 99.95 99.89 99.84 100 99.75 100 100 99.79 100 99.96
PAFA95Pear 88.31 99.86 89.39 98.78 88.55 97.63 96.08 91.09 95.25 95.92
PAFAmPear 66.5 98.47 74.81 90.17 82.71 85.13 79.63 77.96 84.17 85.33
% Ind. Matrices 0 8.84 0.06 8.78 11.58 1.67 0 10.08 3.17 0
Note. PCA = Principal Component Analysis, PAFA = Principal Axes Factor Analysis; 95 = 95% eigenvalue, m = mean eigenvalue; KB = polychoric correlation with Knol-Berger smoothing algorithm, BY = polychoric correlation Bentler-Yuan smoothing algorithm, Pear = Pearson; Var. per factor = Variables per major factor; % Ind. Matrices = Percentage of indefinite correlation matrices
Table 3. Rate (in percent) of correctly detected number of major factors under different variations of PA when only major factors were present under a skewed response distribution.
Method Major factors Var. per factor Number of respondents Number of categories
1 3 5 15 200 500 1000 2 3 4
PCA95KB 99.72 96.45 98.56 97.61 95.04 99.21 100 95.21 99.04 100
PCAmKB 99.03 93 96.78 95.25 90.38 97.79 99.88 91.29 96.75 100
PAFA95KB 85.11 91 88.67 87.45 84 88.25 91.92 77.8 89.34 97.04
PAFAmKB 54.75 83.42 65.97 72.2 62.67 69.46 75.13 53.83 68.67 84.75
PCA95BY 99.72 98.14 98.58 99.28 97.25 99.54 100 97.34 99.46 100
PCAmBY 99.03 95.72 96.86 97.89 93.88 98.38 99.88 94.5 97.63 100
PAFA95BY 85.11 93.7 88.7 90.11 87.13 89.17 91.92 81.13 90.04 97.04
PAFAmBY 54.81 86.78 66.03 75.56 67.08 70.17 75.13 57.88 69.67 84.84
PCA95Pear 99.92 99.25 99.53 99.64 98.84 99.92 100 98.75 100 100
PCAmPear 99.28 97.92 98.47 98.72 96.09 99.71 100 96.46 99.38 99.96
PAFA95Pear 76.5 98.19 81 93.7 74.71 92.46 94.88 81.29 87.83 92.92
PAFAmPear 51.39 93.2 68.31 76.28 67.09 73.92 75.88 60.09 73.17 83.63
% Ind. Matrices 1.11 23.14 3.06 21.2 27.04 8.58 0.75 23.67 8.42 4.29
Note. PCA = Principal Component Analysis, PAFA = Principal Axes Factor Analysis; 95 = 95% eigenvalue, m = mean eigenvalue; KB = polychoric correlation with Knol-Berger smoothing algorithm, BY = polychoric correlation Bentler-Yuan smoothing algorithm, Pear = Pearson; Var. per factor = Variables per major factor; % Ind. Matrices = Percentage of indefinite correlation matrices
doi:10.1371/journal.pone.0148143.t003
Table 4. Rate (in percent) of correctly detected number of major factors under different variations of PA when major and minor factors were pres-ent under a skewed response distribution.
Method Major factors Var. per factor Number of respondents Number of categories
1 3 5 15 200 500 1000 2 3 4
PCA95KB 99.64 95.06 98.22 96.48 93.25 98.79 100 95.67 98.71 97.67
PCAmKB 98.75 89.34 95.78 92.31 85.46 96.71 99.96 90.46 96.75 94.92
PAFA95KB 76.89 85.19 83.95 78.14 75.42 81.63 86.08 78.59 85.54 79
PAFAmKB 37.86 72.56 56.95 53.47 48.3 56.75 60.59 50.29 61.92 53.42
PCA95BY 99.67 97.36 98.28 98.75 96.25 99.29 100 97.67 99.38 98.5
PCAmBY 98.75 93.14 95.78 96.11 90.13 97.75 99.96 94 97.79 96.04
PAFA95BY 76.98 88.95 84 81.92 80.13 82.67 86.08 81.92 86.71 80.25
PAFAmBY 37.95 76.09 57 57.03 53.17 57.29 60.59 54 62.92 54.13
PCA95Pear 99.86 99.14 99.5 99.5 98.54 99.96 100 98.88 99.88 99.75
PCAmPear 99.14 97.42 98.28 98.28 95 99.84 100 96.5 99.42 98.92
PAFA95Pear 72.03 97.5 81.14 88.39 76.79 89.5 88 80.09 86.84 87.38
PAFAmPear 37.14 91.28 63.5 64.92 60.54 67 65.09 58.54 67.04 67.04
% Ind. Matrices 0.92 26.06 2.39 24.58 29.96 8.92 1.59 23.21 8.75 8.5
Note. PCA = Principal Component Analysis, PAFA = Principal Axes Factor Analysis; 95 = 95% eigenvalue, m = mean eigenvalue; KB = polychoric correlation with Knol-Berger smoothing algorithm, BY = polychoric correlation Bentler-Yuan smoothing algorithm, Pear = Pearson; Var. per factor = Variables per major factor; % Ind. Matrices = Percentage of indefinite correlation matrices
distribution was symmetrical, and when the number of response categories was low, compared with conditions with a higher number of response categories. In general, fewer indefinite corre-lation matrices were observed when factor loadings were lower.
Overall effects of study characteristics on the accuracy of dimensionality
assessment
Independent of the approach used in dimensionality assessment, some general statements can be made with regard to which conditions allowed a higher accuracy in the detection of the major factors in a dataset. In general, the number of major factors could be detected more accu-rately when the number of respondents was large, the response distribution was symmetrical, the number of response categories was large, when the factor loadings were high, and when no minor factors were present in the dataset.
Accuracy of approaches based on polychoric correlation matrices and of
approaches based on Pearson correlations
In datasets where indefinite polychoric correlation matrices were observed, the accuracy of meth-ods based on Pearson correlations could be compared against methmeth-ods based on the three smoothing algorithms. Compared to methods based on polychoric correlation matrices which applied the smoothing algorithm of Bentler and Yuan [42], which led to the most accurate dimensionality assessments in our simulation study, methods based on Pearson correlations were slightly less accurate. For both methods, 1152 dimensionality assessments were obtained, resulting from the four used variations of PA which were applied under 288 simulated conditions described in the method section. In these dimensionality assessments, the approach based on polychoric correlation matrices led to more accurate results in 213 cases, to less accurate results in 190 cases, and to equally accurate results in 749 cases. In general, methods based on Pearson correlations led to more accurate results only in datasets with medium factor loadings, no minor factors and a skewed response distribution, when the number of respondents was small.
Of all methods investigated in this study, the application of the modified PA of Glorfeld to a PCA of Pearson correlation and to a PCA of polychoric correlation matrices which were smoothed used the smoothing algorithm of Bentler and Yuan were the most accurate over all conditions simulated in this study. While the application of parallel analysis to a PCA of Pear-son correlations led to an accurate assessment in 99.76% of all datasets, the application of PCA to polychoric correlations which were smoothed using the algorithm of Bentler and Yuan led to an accurate assessment in 99.34% of all datasets.
Comparison of the accuracy of parallel analysis based on PCA and
parallel analysis based on PAFA
correlation matrices led in general to an accurate assessment of the dimensionality of a dataset, while parallel analysis with PAFA of Pearson correlation matrices was less accurate than when applied to polychoric correlation matrices when the response distribution was symmetrical, or skewed with high factor loadings, but more accurate when the response distribution was skewed with medium factor loadings.
Discussion
The use of polychoric and tetrachoric correlation coefficients in the application of PA and PCA has long been considered as an important alternative to approaches based on Pearson correla-tion coefficients. Timmerman and Lorenzo-Seva [2] compared both approaches, but found that the calculation of the polychoric correlation matrix often was not possible due to the non-convergence of the estimation procedure of Olsson [30] or led to non-positive definite correla-tion matrices. In this paper, we investigated the applicacorrela-tion of the smoothing algorithms described by Knol and Berger [31], Higham [40] and Bentler and Yuan [42], which are avail-able via R software packages, to circumvent the problem of indefinite correlation matrices. In line with previous studies, we observed indefinite correlation matrices more often when the number of simulated respondents was small [16,26], when the number of simulated variables was large [26], when the factor loadings were high [15,26], and when the distribution of the responses was skewed over the response categories.
Like Timmerman and Lorenzo-Seva [2], we observed in a preliminary study that the two-step estimation procedure by Olsson [30] did not always converge. For this reason, we applied a variation of the two-step estimation procedure of Olsson [30] in our simulation study, which used an item-pair specific estimation of the threshold parameters for the estimation of the polychoric correlation coefficient. It should be noted that this approach deviates from the com-monly utilized model underlying the calculation of the polychoric correlation coefficient, which assumes that the item specific threshold are invariant over all item pairs. Therefore, we do not recommend the application of this algorithm especially in large datasets; in small data-sets, which were also simulated as part of our simulation study, the application of this proce-dure seems to be necessary to avoid convergence problems which occur if threshold
measures of the number of major factors present in a dataset, which we used as a measure of dimensionality. A similar result was reported by Timmerman and Lorenzo-Seva [2]. Garrido et al. [16] also stated that the application of PA is not suited for EFA on theoretical reasons. This result is in our view of major practical importance, since PCA is mainly used as a data reduction technique, while EFA is based on the common factor model (for a more detailed dis-cussion of both approaches, see [1], pp. 274–276). Although PA combined with PCA seems to lead to more accurate dimensionality assessment, it should be pointed out that PCA is not based on a common factor model, and therefore an additional application of exploratory factor analysis could be considered, if this model is found to be appropriate.
Recent simulation studies [2,16] have recommended the use of PA and MRFA as a method of EFA to determine the dimensionality of an item set. To the best of our knowledge, this method is currently implemented in the Factor software [48], but not available in any pub-lished R package. Since it is not clear if an implementation of this method in R would lead to comparable results as the Factor software, we did not investigate this method in our simulation study. However, the simulation study of Garrido et al. [16] investigated the accuracy of PA and MRFA in categorical data while using the smoothing algorithm of Knol and Berger [31] if indefinite polychoric correlation matrices were observed. Based on these results, it can be con-cluded that PA based on MRFA leads to accurate results when applied to smoothed polychoric or tetrachoric correlation matrices if the smoothing algorithm of Knol and Berger [31] is used. Therefore, the use of PA and MRFA can be recommended for practical application based on the results reported so far in the literature, especially if the latent factors underlying a dataset can be expected to be uncorrelated and if the number of variables per factor is large. However, future studies should investigate which effect the choice of smoothing algorithm has on the accuracy of the analysis when PA is applied to MRFA.
We observed that all methods tended to estimate the number of underlying dimensions to be higher than the number of major factors contained in the data when minor factors were present in the data and when the number of respondents increased. This result was to be expected, since the presence of minor factors influences the dimensionality of an item set. However, this result is relevant for the practical application of PA and PCA of smoothed poly-choric and Pearson correlation matrices as a measure of dimensionality, since minor factors may be present in realistic datasets [49]. Under these conditions, the use of additional measures of dimensionality may be advisable to assess the practical influence of each obtained dimension for modeling the observed data. A recent paper [50] described an approach based on a numeri-cal convex hull-based heuristic, which may be appropriate for this problem.
It has already been noted that over all conditions and methods simulated in our study, choosing the 95thpercentile of the random eigenvalue distribution seems to lead to a more accurate assessment of the number of major factors, especially when larger item sets were examined. This observation has already been reported in a similar simulation study [2], but seems to contradict the recommendations of Garrido et al. [16], who found that using the mean of the random eigenvalue distribution in a PCA of polychoric correlations led to superior results. As Garrido et al. [16] noted, the use of the mean as a summary statistic for parallel anal-ysis led to superior results in conditions with correlated factors, few variables per factor, and small sample sizes of 100 respondents. Since these conditions were only partly met in our simu-lations, our results thus do not contradict the results reported by Garrido et al. [16]. Results of Garrido et al. [16] and our own results concurrently indicate that the effect of the number of variables per factor on the accuracy of PA may interact with other effects, such as the effect of correlations between factors.
the algorithm of Higham [40] is based on the idea of minimizing the distance, defined by the Frobenius norm, between the observed correlation matrix and the smoothed correlation matrix, the algorithm of Bentler and Yuan [42] is based on the idea of rescaling specific rows and columns of the correlation matrix. The algorithm of Knol and Berger [31] is based on the idea of retaining the original eigenvalues while replacing eigenvalues below a predefined con-stant with this concon-stant. Of all algorithms, the approach of Bentler and Yuan [42] is associated with the fewest changes to the correlation matrix and may thus be considered to be preferable from a theoretical point of view. In our simulation study, methods based on the algorithms of Knol and Berger [31], Higham [40], and Bentler and Yuan [42] showed a comparable perfor-mance with regard to the accuracy to detect the number of underlying major factors, with a slightly better performance of methods based on the Bentler andYuan [42] algorithm. We therefore recommend the application of the algorithm of Bentler and Yuan [42] for the assess-ment of dimensionality.
When compared with methods based on Pearson correlations, we found methods based on smoothed polychoric correlation matrices to be of comparable accuracy for dimensionality assessment, especially if the smoothing algorithm of Bentler and Yuan [42] was applied. More-over, it should be noted that the application of the modified parallel analysis of Glorfeld to a PCA of Pearson correlation was among the most accurate methods in this study. Similar find-ings have been reported by Cho et al. [33] and Timmerman and Lorenzo-Seva [2].
However, we observed that the differences in the accuracy of the various methods based on Pearson correlations and on polychoric correlations depended on the characteristics of the ana-lyzed datasets. In datasets with skewed response distributions, high factor loadings and a suffi-ciently large sample of respondents, the differences between methods based on Pearson correlations and methods based on polychoric correlations were especially pronounced. These findings are in line with recommendations by Garrido et al. [16]. Furthermore, it should be noted that methods based on smoothed polychoric correlation matrices seem to be more accu-rate than methods based on the analysis of indefinite polychoric correlation matrices. Timmer-man and Lorenzo-Seva [2] noted that they experienced convergence problems with their smoothing algorithm. In their study, a smoothing algorithm described by [50] was used
(Lorenzo-Seva, personal communication). We did not experience similar problems in any of our simulated datasets, although these problems could occur in applied research. Based on the results found in our study, convergence problems could be avoided if polychoric correlations are esti-mated using the variation of the two-step procedure of Olsson [30], which was used in our study.
In datasets with medium factor loadings, a skewed response distribution and a small sample of respondents, PA of Pearson correlations tended to be more accurate than PA based on poly-choric correlations. This finding may be surprising given the results reported in a previous sim-ulation study [16], which found that a PCA of polychoric correlations is more accurate than a PCA of Pearson correlations in datasets with a skewed response distribution. A close examina-tion of our results shows that under these condiexamina-tions, the critical eigenvalues reported by paral-lel analysis are very close to each other. On the other hand, the variance of the expected eigenvalues is larger for the polychoric correlation matrices in small samples than for the Pear-son correlation matrices. It follows that the dimensionality assessment of PA with PCA or EFA of polychoric correlations is thus more dependent on the characteristics of the analyzed sample than with methods based on Pearson correlations under these conditions.
less accurate under specific conditions. However, in the presence of minor factors, this method may over-estimate the dimensionality of an item set as measured by the number of present major factors. Therefore, we advise against the use of PA with PAFA extraction as a measure of dimensionality under conditions similar to those simulated in our study in practical research.
There are several limitations to the generalizability of our study. First, the data which were analyzed in the simulation study were constructed according to a specific rationale which resembles those used in previous simulation studies [2,16] and were aimed to resemble datasets used in practical research. Empirical datasets may differ from the conditions simulated in our study with regard to several characteristics which influence the accuracy of PA, like the under-lying factor structure. Moreover, our data construction was based on a common factor model, which may not be the appropriate model in practical measurements. Furthermore, the simu-lated datasets were based on a simple structure model with uncorresimu-lated factors, in which par-allel analysis has been shown to perform better than in datasets with correlated factors [16]. In real datasets, significant correlations between latent factors may be observed. It should be noted that the presence of correlated factors might also affect the accuracy of methods based on parallel analysis which are applied to smoothed polychoric correlation matrices, and that their effect on accuracy may depend on the chosen smoothing algorithm. It follows that the conditions simulated in our study should be considered as an idealized scenario, and do not measure the robustness of PA under specific conditions which include non-linearity.
Second, the methods used for dimensionality assessment were restricted to PCA and PAFA, two methods which were also investigated in several recent studies [2,32,34]. However, this is to the best of our knowledge the first study which compared the effect of different smoothing algorithms on the accuracy of these methods in the presence of minor factors. Several varia-tions have been suggested to these methods, which may be less common, but may be more accurate than those used in our study under specific conditions [2].
However, despite these limitations, our study allows some recommendations for the applied researcher who wishes to use PA to determine the dimensionality of a set of ordinal variables: First, the application of PCA of Pearson correlations or smoothed polychoric correlations seems to be more accurate to determine the number of major factors underlying a set of ordinal variables than PAFA. This difference seems to be more pronounced in the presence of minor factors, which may be the case in many real datasets, and if the response distribution is skewed. Second, under the conditions simulated in our study, the modified PA of Glorfeld [7] seems to lead to a more accurate assessment of dimensionality than the original approach of Horn [8]. This effect is more pronounced when PA is used in the context of EFA. Third, under certain conditions the choice of an appropriate smoothing algorithm can affect the accuracy of dimensionality assessments based on PA. Of the smoothing algorithms used in our study, the algorithm described by Bentler and Yuan [42] seems to lead to more accurate results when used with PA based on PCA and can therefore be recommended.
Supporting Information
S1 Appendix. Detailed results for the accuracy of parallel analysis in datasets with high and medium factor loadings.
(DOCX)
Author Contributions
References
1. Fabrigar LR, Wegener DT, MacCallum RC, Strahan EJ. Evaluating the use of exploratory factor analy-sis in psychological research. Psychol Methods. 1999; 4: 272–99.
2. Timmerman ME, Lorenzo-Seva U. Dimensionality Assessment of Ordered Polytomous Items With Par-allel Analysis. Psychol Methods. 2011; 16: 209–20. doi:10.1037/a0023353PMID:21500916
3. Harlow LL, Korendijk E, Hamaker EL, Hox J, Duerr SR. A Meta-View of Multivariate Statistical Inference Methods in European Psychology Journals. Multivariate Behav Res. 2013; 48: 749–74. doi:10.1080/ 00273171.2013.822784PMID:26741061
4. Reckase MD. Multidimensional Item response Theory. Dordrecht: Springer; 2009.
5. Zwick WR, Velicer WF. Comparison of five rules for determining the number of components to retain. Psychol Bull. 1986; 99: 432–42.
6. Kaiser HF. The application of electronic computers to factor analysis. Educ Psychol Meas. 1960; 20: 141–51.
7. Glorfeld LW. An improvement on Horn’s parallel analysis methodology for selecting the correct number of factors to retain. Educ Psychol Meas. 1995; 55: 377–93.
8. Horn JL. A rationale and test for the number of factors in factor analysis. Psychometrika. 1965; 30: 179–85. PMID:14306381
9. Cattell RB. The scree test for the number of factors. Multivariate Behav Res. 1966; 1: 245–76. 10. Velicer WF. Determining the number of components from the matrix of partial correlations.
Psychome-trika. 1976; 41: 321–27.
11. Humphreys LG, Ilgen DR. Note on a criterion for the number of common factors. Educ Psychol Meas. 1969; 29: 571–78.
12. Akaike H. Information theory and an extension of the maximum likelihood principle. In: Petrox BN, Caski F, editors. Second International Symposium on Information Theory. Budapest, Hungary: Akade-miai Kiado. 1973, p. 267.
13. Schwartz R. Estimating the dimension of a model. Ann Stat. 1978; 6: 461–64.
14. Steger MF. An illustration of issues in factor extraction and identification of dimensionality in psychologi-cal assessment data. J Pers Assess. 2006; 86: 263–72. PMID:16740111
15. Tran US, Formann AK. Performance of Parallel Analysis in Retrieving Unidimensionality in the Pres-ence of Binary Data. Educ Psychol Meas. 2009; 60: 50–61.
16. Garrido LE, Abad FJ, Ponsoda V. A New Look at Horn's Parallel Analysis With Ordinal Variables. Psy-chol Methods. 2013; 18: 454–74. doi:10.1037/a0030005PMID:23046000
17. Gorsuch RL. Factor analysis 2nd ed. Hillsdale NJ: Erlbaum; 1983.
18. Lord FM. Application of item response theory to practical testing problems. Hillsdale, NJ: Lawrence Erlsbaum Associates; 1980.
19. Lord FM, Novick MR. Statistical theories of mental test scores. Reading, MA: Addison & Wesley; 1968.
20. Beauducel A, Herzberg PY. On the Performance of Maximum Likelihood Versus Means and Variance Adjusted Weighted Least Squares Estimation in CFA. Struct Equ Modeling. 2006; 13: 186–203. 21. Olsson U. On the robustness of factor analysis against crude classification of observations. Multivariate
Behav Res. 1979; 14: 485–500. doi:10.1207/s15327906mbr1404_7PMID:26804442
22. Weng L-J, Cheng C-P. Parallel analysis with unidimensional binary data. Educ Psychol Meas. 2005; 65: 697–716.
23. Knol DL, ten Berge JMF. Least-squares approximation of an improper correlation matrix by a proper one. Psychometrika. 1989; 54: 53–61.
24. Babakus E, Ferguson CE, Jöreskog KG. The sensitivity of confirmatory maximum likelihood factor anal-ysis to violations of measurement scale and distributional assumptions. J Mark Res. 1987; 24: 222–28. 25. Flora DB, Curran PJ. An empirical evaluation of alternative methods of estimation for confirmatory
fac-tor analysis with ordinal data. Psychol Methods. 2004; 9: 466–91. PMID:15598100
26. Debelak R, Tran US. Principal Component Analysis of Smoothed Tetrachoric Correlation Matrices as a Measure of Dimensionality. Educ Psychol Meas. 2013; 73: 63–77.
27. Yuan K-H, Wu R, Bentler PM. Ridge structural equation modeling with correlation matrices for ordinal and continuous data. Br J Math Stat Psychol. 2010; 64: 107–33.
29. Humphreys LG, Montanelli RG. An investigation of the parallel analysis criterion for determining the number of common factors. Multivariate Behav Res. 1975; 10: 193–206.
30. Olsson U. Maximum likelihood estimation of the polychoric correlation coefficient. Psychometrika. 1979; 44: 443–60.
31. Knol DL, Berger MPF. Empirical comparison between factor analysis and multidimensional item response models. Multivariate Behav Res. 1991; 26: 457–77. doi:10.1207/s15327906mbr2603_5 PMID:26776713
32. Green SB, Levy R, Thompson MS, Lu M, Lo W-J. A proposed solution to the problem with using completely random data to assess the number of factors with parallel analysis. Educ Psychol Meas. 2012; 72: 357–74.
33. Cho S, Li F, Bandalos D. Accuracy of the parallel analysis procedure with polychoric correlations. Educ Psychol Meas. 2009; 69: 748–59.
34. Crawford AV, Green SB, Levy R, Lo W, Scott L, Svetina D et al. Evaluation of parallel analysis methods for determining the number of factors. Educ Psychol Meas. 2010; 70: 885–901.
35. Turner NE. The Effect of Common Variance and Structure Pattern on Random Data Eigenvalues: Impli-cations for the Accuracy of Parallel Analysis. Educ Psychol Meas. 1998; 58: 541–68.
36. Green SB, Redell N, Thompson MS, Levy R. Accuracy of revised and traditional parallel analyses for assessing dimensionality with binary data. Educ Psychol Meas. 2015; Epub 2015 April 21.
37. Green SB, Thompson MS, Levy R, Lo W-J. Type I and II error rates and overall accuracy of the revised parallel analysis method for determining the number of factors. Educ Psychol Meas. 2015; 75: 428–57. 38. Mulaik SA. The foundations of factor analysis. Chapman & Hall/CHC: Boca Raton, FL; 2010. 39. Peres-Neto PR, Jackson DA, Somers KM. How many principal components? Stopping rules for
deter-mining the number of non-trivial axes revisited. Comput Stat Data Anal. 2005; 49: 974–97.
40. Higham N. Computing the nearest correlation matrix—a problem from finance. IMA Journal of Numeri-cal Analysis. 2002; 22: 329–43.
41. Bates D, Maechler M. Matrix: Sparse and Dense Matrix Classes and Methods. R package version 1.0–
6. 2011. Available:http://CRAN.R-project.org/package=Matrix.
42. Bentler P, Yuan K-H. Positive definiteness via off-diagonal scaling of a symmetric indefinite matrix. Psy-chometrika. 2011; 76: 119–23. PMID:21566679
43. ten Berge JMF, Nevels K. A general solution to Mosier's oblique Procrustes problem. Psychometrika. 1977; 42: 593–600.
44. Revelle W. psych: Procedures for Personality and Psychological Research. R Package version 1.2.4. 2014. Available:http://CRAN.R-project.org/package = psych.
45. Bravo HC. Rcsdp: R interface to the CSDP semidefinite programming library. R package version 0.1–
41. 2010. Available:http://CRAN.R-project.org/package=Rcsdp.
46. Maechler M et al. sfsmisc: Utilities from Seminar fuer Statistik ETH Zurich. R package version 1.0–26. 2014. Available:http://CRAN.R-project.org/package = sfsmisc.
47. R Development Core Team. R: A language and environment for statistical computing. 2011. R Founda-tion for Statistical Computing, Vienna, Austria. ISBN 3-900051-07-0, Available:http://www.R-project. org/.
48. Lorenzo-Seva U, Ferrando PJ. Factor. Version 10.3.01. 2015. Available:http://psico.fcep.urv.es/ utilitats/factor/index.html.
49. Tucker LR, Koopman RF, Linn RL. Evaluation of Factor Analytic Research Procedures by Means of Simulated Correlation Matrices. Psychometrika. 1969; 34: 421–59.