The use of diffuse reflectance spectroscopy for the characterization of iron ores
Geraldo Magela da Costa
a,*, Vidal Barrón
b, César Mendonça Ferreira
c, José Torrent
b aChemistry Department, Universidade Federal de Ouro Preto, Ouro Preto, MG, BrazilbDepartamento de Ciencias y Recursos Agrícolas y Forestales, Universidad de Córdoba, 14071 Córdoba, Spain cGeology Department, Universidade Federal de Ouro Preto, Ouro Preto, MG, Brazil
a r t i c l e
i n f o
Article history: Received 16 March 2009 Accepted 7 July 2009 Available online 5 August 2009
Keywords: Iron ores Goethite Martite Specularite Reflectance
a b s t r a c t
The aim of this work was to develop a diffuse reflectance methodology for quantifying minerals in pow-dered iron ores, which is a key quality control requirement for these materials. Selected samples ranging widely in their concentrations of hematite (as specularite and martite), goethite, magnetite, and quartz were collected in mines from the Iron Quadrangle, Minas Gerais State, and also in the Carajás region, Pará State, Brazil. A chemometric analysis based on the concentrations of the different minerals as deter-mined with a combination of conventional methods (chemical analysis, X-ray diffraction, Mössbauer spectroscopy, light-reflected microscopy, and magnetic susceptibility) and the principal components derived from the diffuse reflectance spectra in the visible range was performed. Principal component regression analysis provided successful calibration for the concentrations of goethite (r2= 0.94; standard
error of validation (SEv) = 4.2%) and hematite (r2= 0.89; SEv = 7.4%), in addition to good estimates for
quartz (r2= 0.83; SEv = 7.4%), specularite (r2= 0.80; SEv = 11.6%), and martite (r2= 0.78; SEv = 10.6%).
Our results suggest that diffuse reflectance spectroscopy is a promising tool for the simultaneous deter-mination of minerals in iron ores within a few minutes only.
Ó2009 Elsevier Ltd. All rights reserved.
1. Introduction
The steel industry requires accurate quantification of the main iron (Fe) oxides and oxyhydroxides present in iron ores, which en-tails determining goethite, magnetite and hematite present in ore concentrates, and also the distribution of hematite into martite and specularite. Quantifying quartz, which is invariably present in the ores, is also essential for various processes, particularly the flotation step (Santos and Brandão, 2003; Santos et al., 2005).
In recent years, optical microscopy has become the standard technique for quantifying the minerals in iron ores. An experienced operator can easily identify all the previous mentioned phases by reflected light with an absolute uncertainty of roughly 5–10%. Quantification is done by counting a total of at least 500 particles and then converting the volumetric percentage into weight by using the density of each phase (Donskoi et al., 2007; Ferreira, 1993). However, this technique is time-consuming and takes from 30 to 180 min depending on the particular size fractions studied. Furthermore, its results may vary with the sample preparation pro-cedure, operator, and absolute mineral densities. Thus, densities of goethite, specularite, martite and magnetite are dependent on
var-ious factors such as porosity, and degree of oxidation and hydra-tion (Donskoi et al., 2008). Also, there is no alternative technique to cross-check the results for martite and specularite, which pre-cludes the suppression of systematic errors.
One other analytical technique suitable for studying of iron oxi-des (a term used here to oxi-designate all Fe oxioxi-des, oxyhydroxioxi-des and hydroxides) and other iron-bearing phases is Mössbauer spectros-copy (Bancroft, 1973). Identification of the iron-oxide phases relies on comparing the derived hyperfine parameters with those for well-characterized samples reported in the literature, and their quantification is based on the relative areas for each mineral. The main advantage of this technique over optical microscopy is that the densities of the involved phases need not be known. However, each spectrum takes 5–12 h of measuring time, which makes this technique unsuitable for routine analyses. Some comparative studies have exposed a relatively good consistency between both methods (de Sá et al., 1999; Toríbio et al., 2001) and also that the room-temperature Mössbauer spectra for samples containing var-iable proportions of martite and specularite are essentially identical.
X-ray diffraction (XRD) analysis is widely used for the identifi-cation of crystalline substances, but rarely used for quantifiidentifi-cation of the identified phases owing to the potential influence of texture, stress and crystal size, among other factors, on peak intensity (
Jen-kins and Snyder, 1996). The Rietveld method can be used to
quan-tify crystalline phases, but the operational procedure is far from
0892-6875/$ - see front matterÓ2009 Elsevier Ltd. All rights reserved. doi:10.1016/j.mineng.2009.07.003
* Corresponding author. Address: Departamento de Química, Universidade Federal de Ouro Preto, Campus Universitário, Morro do Cruzeiro, 35400 Ouro Preto, MG, Brazil. Tel.: +55 31 35591714; fax: +55 31 35591660.
E-mail address:[email protected](G.M. da Costa).
Contents lists available atScienceDirect
Minerals Engineering
straightforward for samples exhibiting textural effects (Rietveld,
1969; Pöllmann and Angélica, 2002). In addition, the structural
parameters for martite and specularite are identical, which pcludes their discrimination. In spite of these shortcomings, XRD re-search work on some preliminarily well-characterized iron-ore samples revealed that magnetite, goethite, martite and specularite can be effectively quantified by combining the results of chemical and X-ray diffraction analyses (da Costa et al., 2002).
Diffuse reflectance spectroscopy has previously been used for the identification of Fe oxides in soils and sediments (Torrent
and Barrón, 1993; and references therein). Iron oxides are
impor-tant soil chromophores exhibiting absorption bands in the visible spectral range (Sherman and Waite, 1985). However, overlap and weakness in some bands requires the use of derivative transforma-tions of the raw diffuse reflectance spectrum in order to quantify hematite and goethite (Torrent and Barrón, 2008). Chemometric methods have been successfully applied to visible and near-infra-red spectra in many agricultural fields, particularly in the study of soils, where iron oxides and other components can thus be accu-rately identified and quantified (Ben-Dor and Banin, 1990; Reeves
et al., 1999; Malley et al., 2004; Viscarra-Rossel et al., 2006).
Equip-ment for in-line mineral quantification based on diffuse reflectance spectroscopy was recently made commercially available (de Waal, 2007). To the best of our knowledge, however, diffuse reflectance has never previously been used to quantify minerals in iron ores. This led us to investigate the use of this technique for quantifying the major phases in various iron ores. As shown below, the results were very promising.
2. Experimental
Eighty-four iron-ore samples containing variable proportions of martite, specularite, magnetite, goethite and quartz were obtained from different locations in Brazil. Most were collected in mines from the well-known Iron Quadrangle, Minas Gerais State (Rosière
and Chemale, 2000). Other samples were collected in the Carajás
region, Pará State (Rosière and Chemale 2000). One sample con-taining 92% specularite, 1% magnetite and 7% quartz, and another one containing 83% martite, 14% magnetite and 1% quartz, were mixed in different proportions in order to obtain 11 samples span-ning the whole composition range at intervals of about 10% in terms of specularite–martite. Samples were sieved and the frac-tions below 100 mesh chosen for analysis.
Mössbauer spectra (MS) were acquired at room-temperature with a spectrometer using a constant-acceleration drive with trian-gular reference signal, 512 or 1024 channels and velocities over the range11 to +11 mm/s. Velocity calibration was achieved by using the spectrum for a standard
a
-Fe foil at room temperature, andiso-mer shifts are quoted relative to
a
-Fe. Spectra were fitted eitherwith discrete Lorentzian sextets/doublets or with one model-inde-pendent hyperfine-field distributions (Vandenberghe et al., 1994). Relative areas were calculated on the assumption that ferrous and ferric ions have the same recoil fraction. The amount of each iron-bearing phase was calculated from its relative area and the to-tal iron content as obtained by chemical analysis.
A reflected light microscope (Leica, model MPS30) at 200 magni-fication was used to count particles. The powdered samples were mounted in epoxy resin blocks which were then polished. At least 500 particleswere identifiedand countedby reflectedlight. Volumet-ric percentages were converted into weight percentages by using the following average densities: specularite = 5.2 g cm3; martite =
3.9 g cm3; goethite = 3.0 g cm3; magnetite = 5.0 g cm3; quartz =
2.65 g cm3.
Powder XRD patterns were obtained on a Shimadzu XRD 6000 instrument fitted with an Fe tube and a graphite monochromator.
The main purpose of these measurements was to check for the ab-sence of any spurious phases such as kaolinite or micas. None of the samples, however, exhibited any such phases.
Total and ferrous iron were determined by titration with potas-sium dichromate after dissolution in hot concentrated HCl. The res-idues of the attacks were weighted and assumed to be, based on the X-ray diffraction results, quartz.
Magnetic susceptibilities were measured with a Bartington MS-2B dual frequency sensor (Bartington Instruments Ltd., Oxford, UK). The magnetite concentration was calculated by using a mag-netic susceptibility value of 500106m3kg1(Dearing, 1999).
Diffuse reflectance measurements were made on powder sam-ples sieved below 100 mesh and placed in a sample holder with a quartz window 17 mm in diameter. In order to investigate the particle-size effect on the reflectance spectra, we also obtained the spectra for micaceous hematite ranging from 5
l
m to 500l
min particle size. No sample preparation (e.g. cleaning) was required. The spectrum for a white standard (Halon, polytetrafluoroethylene powder) was periodically obtained in order to calibrate the equip-ment. Spectra were recorded on a Cary 5000 Vis–IR spectropho-tometer (Varian Inc., Palo Alto, CA) equipped with an integrating sphere of 110 mm. Reflectance values were acquired at 1 nm inter-vals over the 320–800 nm range. Because four replicates were re-corded, about 10 min per sample were required. The visible portion of the spectrum was used to calculate color parameters, namely: the tristimulus values (X,Y, andZ), using the equations provided by Wyszecki and Stiles (1982), which were converted into Munsell notation (Hue, Value, and Chroma) with the aid of software downloaded fromhttp://wallkillcolor.com. Whole spectra were used for the chemometric analysis, where reflectance data were transformed into absorbance measurements [Log10
(1/Reflec-tance)]. Other data transformations such as the Kubelka–Munk function [(1–Reflectance)2/(2
Reflectance)], scatter and smooth-ing corrections, or derivative pre-treatments, were also tested, but their results were not significantly better. Principal component analysis (PCA) using the NIPALS algorithm (Martens and N
s, 1989) and partial least-squares regression (PLSR) analysis (Geladiand Kowalski, 1986) as implemented in the commercial software
package Unscrambler 9.02 (CAMO technologies, Inc., Woodbridge, NJ) were used in order to relate spectra to mineral composition. The calibration accuracy was evaluated via the determination coef-ficient,r2, and the root mean square errors of calibration (SEc). The
results were validated by using the one-out cross validation proce-dure, which involves withdrawal of each sample in turn from the whole set and development of a calibration equation from that set with prediction of the value for the withdrawn sample; this method provides a good estimate of the standard error of predic-tion (SEv) (Shenk and Westerhaus, 1996).
3. Results and discussion
3.1. Iron ore mineralogy
Hematite was the major constituent in the studied ore samples
(Table 1), which is typical of Brazilian iron ores. The water contents
Table 1
Mineralogical composition of the samples.
Mean Standard deviation Minimum Maximum
Hematite (%) 61.5 22.8 6.1 92.0
Specularite (%) 37.3 25.9 0.0 92.0
Martite (%) 24.1 21.2 0.0 83.0
Goethite (%) 13.4 16.9 0.0 86.3
Magnetite (%) 3.6 4.1 0.0 17.0
Total Fe (%) 54.1 12.7 4.3 69.2
of Brazilian ores are low relative to Australian ores, which typically contain greater amounts of goethite (Morris, 2003). In addition, Brazilian ores have low Fe2+contents (i.e. low magnetite contents)
and insubstantial amounts of alumina. The other major iron-bear-ing phase in addition to hematite was goethite. This oxyhydroxide is normally present as fine-grained material, which is named ‘‘earthy goethite” in order to distinguish it from the high-crystal-linity variety.
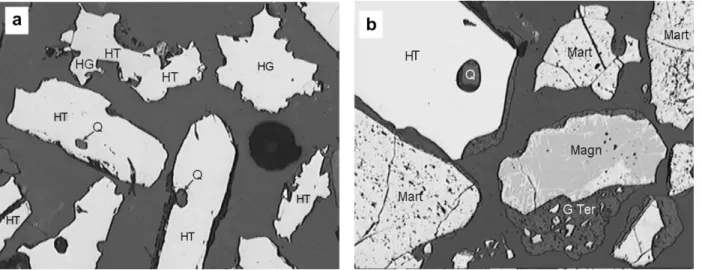
The hematite crystals in the ores exhibited various morpholo-gies that were normally classified as tabular (HT) or granular (HG) as seen under the optical microscope (Fig. 1a). The main dif-ference between tabular and granular hematite is that the former has a higher aspect ratio and more regular edges. Micro granular hematite was observed in some samples. Non-porous crystals were collectively grouped as ‘‘specularite”. The identification of martite was quite simple as the mineral exhibited a porous structure with occasional magnetite relicts. ‘‘Earthy goethite” was seen as a brown material, whereas magnetite exhibited a pink color. Quartz grains appeared as black spots. All these phases were present in the sam-ple ofFig. 1b.
The studied samples were chosen in such a way to span the broadest possible range of compositions, even if economically unviable (e.g. ores that contain goethite as the major iron-bearing phase). These samples were included in order to check whether the method would be applicable to all kinds of compositions. As can be seen fromTable 1, the mineralogy varied widely except for magne-tite, which exhibited peak content of about 17%.
The results for micaceous hematite in particles sizes from 60
l
m to 500l
m exhibited no significant differences.3.2. Color
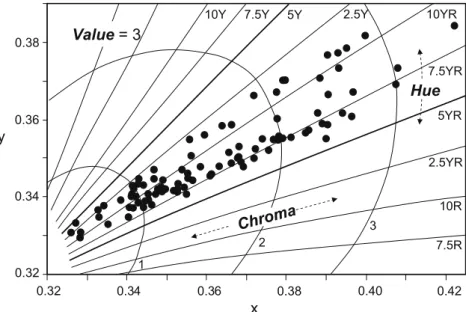
Munsell color ranged from dark gray to yellowish red and rela-tively little in hue (from 5.6YR to 3.5Y) and value (from 3 to 5.3), but somewhat more in chroma (from 0.6 to 3.9), which is the great-est contributor to color (Fig. 2). Samples with a high content in lamellar specularite, which possesses metallic luster exhibited gray colors with low chroma (Fig. 3c). Increasing concentrations of mar-tite and/or goethite resulted in increasing chroma by effect of the high pigmentation power of the small-sized particles of these min-erals. Sub-micrometric goethite and hematite (martite) exhibit an absorption band marked with arrows inFig. 3b and d, which has been assigned to an electron pair transition (Sherman and Waite,
1985; Scheinost et al., 1998) that is closely related to hue. Because
this band is clearly shifted to lower wavelengths for goethite, the samples with increased proportions of this mineral exhibited yel-lowish hues (close to 2.5Y,Fig. 2). No significant bands were ob-served in the visible range for quartz (Fig. 3a) or magnetite
(Fig. 3e). Consequently, the effect of these minerals was to increase
(quartz) or decrease (magnetite) the Munsell value (V).
3.3. Chemometric analysis of the reflectance curves
The principal component analysis of the reflectance data showed that 99.9% of spectral variance could be accounted for by the first three components—and 99.999% by the first 10 (Fig. 4). TheXmatrix, which contained 95 rows (samples) and 480 columns (absorbance data from 320 to 800 nm in 1-nm steps) was reduced by using the iterative NIPALS algorithm (Martens and Naes, 1989) to:
X¼TPþE1
whereTis the matrix of scores,Pare the spectral loadings andE1 the residuals.Tis a new reduced matrix consisting of 95 rows but only 10 columns and still retaining virtually all significant spectral information. This is so because the spectra contained much redun-dant information (i.e. high multi-collinearity).
Multiple correlation by least squares regression between theY
matrix containing 95 rows and 7 columns (hematite, specularite, martite, goethite, magnetite, total Fe and quartz) and T matrix (9510) of scores of the principal component led to the following equation:
Y¼TBþE2
whereBare the matrix coefficients andE2 are the residuals. The software used theBmatrix to construct a model in order to predict the mineral content of new samples based upon the diffuse reflec-tance spectra. Other statistical parameters derived from the least-squares regression confirmed the accuracy of this technique. Thus, the correlation coefficients for calibrationðr2
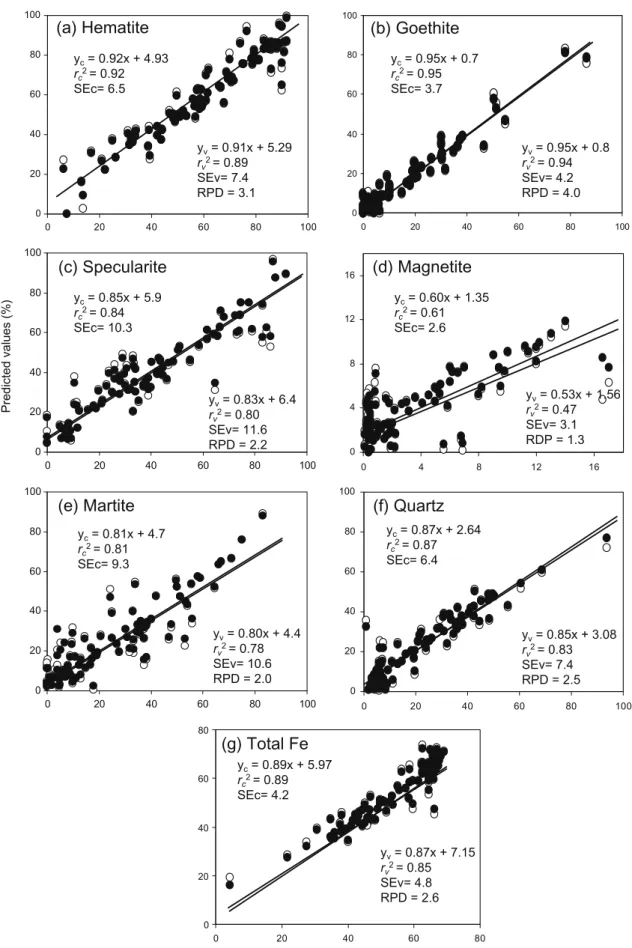
cÞbetween predicted and measured values were close to 0.9 for all minerals except mag-netite (Fig. 5a–g). The correlations for specularite and martite
(Fig. 5c and e) were also relatively goodðr2
c>0:8Þ, which indicates that the diffuse reflectance spectrum is sensitive not only to compo-sition, but also to grain size distribution, as can be inferred from dif-ferences in diffuse reflectance spectra [see selected spectra for samples with a high content of specularite (Fig. 3c) and martite
(Fig. 3d)]. The best correlation was that for goethite (Fig. 5b),
probably because its reflectance curve exhibited the best defined bands (Fig. 3b). This can be also the reason for its low standard error of calibration (SEc = 3.7%) relative to hematite and quartz.
The cross-validation test was more restrictive with a view to evaluating the accuracy of the proposed method. As expected, the values of the two cross-validation statistics (r2
vand SEv) were
invariably slightly lower than their calibration counterparts (r2
c and SEc) (Fig. 5). One other statistical criterion which is commonly used in chemometric analysis to compare different constituents is the ratio of performance deviation (RPD), which was calculated by dividing the standard deviation by the standard error of validation
(Table 1). Use of the guidelines ofMalley et al. (2004)for
evaluat-ing calibration for environmental samples such as soils or sedi-ments resulted in excellent calibration (r2> 0.95, RPD > 4) for goethite, successful calibration (r2= 0.90–0.95, RPD = 3–4) for
hematite, moderately successful calibration (r2= 0.8–0.9,
RPD = 2.25–3) for quartz, and moderately useful ones (r2= 0.7–
0.8, RPD = 1.75–2.25) for specularite and martite. Except for mag-netite, all calibrations fell in these four categories; even for this mineral, however, the procedure was useful for screening pur-poses. In any case, magnetite abundance can be estimated from magnetic susceptibility.
In studies on soil samples and other materials analysed by applying chemometric procedures to near infrared reflectance data
(Malley et al., 2004; Viscarra-Rossel et al., 2006, and references
therein), partial least-squares regression (PLSR) typically provided more robust calibration than did PCA regression. For our samples, however, the results were comparable, i.e.r2
c, SEC,r2v, SEv and RPD
were not significantly different.
In conclusion, diffuse reflectance spectroscopy is a fast—only about 10 min/sample—inexpensive, accurate, environmentally safe—no chemical extractants—tool for the simultaneous quantifi-cation of the minerals commonly found in iron ores powders. Although we used a limited number of samples and composition range, the proposed methodology is quite dynamic and allows the introduction of other samples simply by remodeling the cali-bration curves. The influence of contaminants such as kaolinite and carbonates on the regression curves was not evaluated since Brazilian iron-ores generally contain only small amounts of these phases. However, their influence on reflectance spectra in the vis-ible range can be anticipated to be quite weak. The particle-size ef-fect on reflectance, which was evaluated through the spectra for
0.32 0.34 0.36 0.38 0.40
0.32 0.34 0.36 0.38
0.42
x
y
7.5YR
7.5R 10R 5YR 10YR 2.5Y
5Y 7.5Y 10Y
2
1
3
Chr
om
a
Hue
2.5YR
Value
= 3
Fig. 2.Plot on the plane of Munsell value = 3 of thexandychromaticity coordinates for the studied iron-ores samples.
Wavelength (nm)
Diffuse reflectance (%)
a
b
c
d e
400 500 600 700
10 20 30 40 50 60
Fig. 3.Selected spectra for: (a) quartz obtained from the complete deferrification of a mixture of iron-ores samples; (b) commercial goethite powder (BayferroxÒ
920, Bayer); (c) a sample with a high content (92%) of specularite; (d) a sample with a high content (83%) of martite and (e) commercial magnetite powder (BayferroxÒ 318 M, Bayer).
Principal component
Cumulative variance explained (%)
0 20 40 60 80 100
0 1 2 3 4 5 6 7 8 9 10
0 20 40 60 80 100
Predicted values (%)
0 20 40 60 80 100
yc= 0.92x + 4.93
rc2= 0.92
SEc= 6.5
yv= 0.91x + 5.29
rv2= 0.89
SEv= 7.4 RPD = 3.1
(a) Hematite
0 20 40 60 80 100
yc= 0.85x + 5.9
rc2= 0.84
SEc= 10.3
yv= 0.83x + 6.4
rv2= 0.80
SEv= 11.6 RPD = 2.2
(c) Specularite
0 20 40 60 80 100
yc= 0.81x + 4.7
rc2= 0.81
SEc= 9.3
yv= 0.80x + 4.4
rv2= 0.78
SEv= 10.6 RPD = 2.0
(e) Martite
yc= 0.95x + 0.7
rc2= 0.95
SEc= 3.7
(b) Goethite
yv= 0.95x + 0.8
rv2= 0.94
SEv= 4.2 RPD = 4.0
0 4 8 12 16
yc= 0.60x + 1.35
rc2= 0.61
SEc= 2.6
(d) Magnetite
yv= 0.53x + 1.56
rv2= 0.47
SEv= 3.1 RDP = 1.3
0 20 40 60 80 100
0 20 40 60 80 100
0 20 40 60 80 100
0 20 40 60 80 100
0 20 40 60 80 100
0 4 8 12 16
0 20 40 60 80 100
yc= 0.87x + 2.64
rc2= 0.87
SEc= 6.4
(f) Quartz
yv= 0.85x + 3.08
rv2= 0.83
SEv= 7.4 RPD = 2.5
0 20 40 60 80
0 20 40 60 80
yc= 0.89x + 5.97
rc2= 0.89
SEc= 4.2
(g) Total Fe
yv= 0.87x + 7.15
rv2= 0.85
SEv= 4.8 RPD = 2.6
Measured values (%)
micaceous hematite, was found to be insignificant for particles ranging from 60
l
m to 500l
m in size. Our results, along withoth-ers recently reported, show that diffuse reflectance is a very prom-ising technique for the mineralogical analysis of various types of ores. Quantitative or semi-quantitative analyses can be easily per-formed once the reflectance spectra for previously well-character-ized samples are obtained to construct the calibration model.
Acknowledgments
This work was partially funded by Fapemig and CNPq (Brazil) and by Spain´s Ministerio de Educación y Ciencia, Project AGL2006–10927 and FEDER funds.
References
Bancroft, G.M., 1973. Mössbauer Spectroscopy: An Introduction for Inorganic Chemists and Geochemists. John Wiley & Sons, New York.
Ben-Dor, E., Banin, A., 1990. Diffuse reflectance spectra of smectite minerals in the near infrared and their relationship to chemical composition. Sciences Geologiques Bulletin 43, 117–128.
da Costa, G.M., Resende, V.G., Toríbio, N.M., 2002. Quantitative phase analysis of iron ore concentrates. Revista da Escola de Minas 55, 263–266.
De Sá, K.G., Toríbio, N.M., da Costa, G.M., Vieira, C.B., 1999. Caracterização mineralógica de minérios de ferro: um estudo comparativo. In: Anais II Simpósio Brasileiro de Minério de Ferro, ABM 50, pp. 33-43.
Dearing, J., 1999. Environmental Magnetic Susceptibility: Using Bartington MS2 System. Chi Publishing, Kenilworth.
De Waal, P., 2007. Tomorrow´ s technology—out of Africa—today. In: The Fourth Southern African Conference on Base Metals 1, pp. 1-9.
Donskoi, E., Suthers, S.P., Fradd, S.B., Young, J.M., Campbell, J.J., Raynlyn, T.D., Clout, J.M.F., 2007. Utilization of optical image analysis and automatic texture classification for iron ore particle characterization. Minerals Engineering 20, 461–471.
Donskoi, E., Suthers, J.J., Campbell, T., abd Raynlyn, T., 2008. Modelling and optimization of hydrocyclone for iron ore fines beneficiation—using optical image analysis and iron ore texture classification. International Journal of Mineral Processing 86, 106–119.
Ferreira, C.M., 1993. Método de caracterização tecnológica de minério – Diretrizes para aplicação a minérios de ferro dos tipos ‘‘sinter feed” e ‘‘pellet feed”. In: Anais do Workshop em Geologia e Estratigrafia de Minério de Ferro, SBG Bol 12, pp. 374–375.
Geladi, P., Kowalski, B.R., 1986. Partial least-squares regression: a tutorial. Analytica Chimica Acta 185, 1–17.
Jenkins, R., Snyder, R.L., 1996. Introduction to X-ray Powder Diffractometry. John Wiley & Sons, Inc., New York.
Malley, D.F., Martin, P.D., Ben-Dor, E., 2004. Application in analysis of soils. In: Roberts, C.A., Workman, J., Reeves, J.B. (Eds.), Near-Infrared Spectrosculture. Soil Science Society of America, Madison, WI, pp. 729–784.
Martens, H., Ns, T., 1989. Multivariate Calibration. John Wiley & Sons, Chichester. Morris, R.C., 2003. Iron ore genesis and post-ore metasomatism at Mount Tom Price. Transactions of the Institution of Mining and Metallurgy, Section B: Applied Earth Science 112, 56–67.
Pöllmann, U.K., Angélica, R.S., 2002. O refinamento de Rietveld como um método para o controle de qualidade de minérios de ferro. Revista da Escola de Minas 55, 111–114.
Reeves III, J.B., McCarty, G.W., Meisinger, J.J., 1999. Near infrared reflectance spectroscopy for the analysis of agricultural soils. Journal of Near Infrared Spectroscopy 7, 179–193.
Rosière, C.A., Chemale Jr., F., 2000. Brazilian iron formations and their geological setting. Revista Brasileira de Geociências 30, 274–278.
Rietveld, H.M., 1969. A profile refinement method for nuclear and magnetic structures. Journal of Applied Crystallography 2, 65–71.
Santos, L.D., Brandão, P.R.G., 2003. Morphological varieties of goethite in iron ores from Minas Gerais, Brazil. Minerals Engineering 16, 1285–1289.
Santos, L.D., Brandão, P.R.G., Sampaio, D.A., 2005. Mineralogical and morphological characterization of iron ore types from Minas Gerais, Brazil – influences on the specific surface area of concentrates. Minerals and Metallurgical Processing 22, 116–120.
Scheinost, A.C., Chavernas, A., Barrón, V., Torrent, J., 1998. Use and limitations of second-derivative diffuse reflectance spectroscopy in the visible to near-infrared range to identify and quantify Fe oxides in soils. Clays and Clay Minerals 46, 528–536.
Shenk, J.S., Westerhaus, M.O., 1996. Calibration the ISI way. In: Davies, A.M.C., Williams, P.C. (Eds.), Near Infrared Spectroscopy: The Future Wave. NIR Publications, Chichester, UK, pp. 198–202.
Sherman, D.M., Waite, T.D., 1985. Electronic spectra of Fe3+ oxides and oxyhydroxides in the near infrared to ultraviolet. American Mineralogist 70, 1262–1269.
Toríbio, N.M., da Costa, G.M., de Sá, K.G., Vieira, C.B., 2001. A comparative study of iron ore concentrates by Mössbauer spectroscopy and optical microscopy. Hyperfine Interactions 134, 187–191.
Torrent, J., Barrón, V., 1993. Laboratory measurement of soil color: theory and practice. In: Bigham, J.M., Ciolkosz, E.J. (Eds.), Soil Color, vol. 31. SSSA Special Publication, Madison, pp. 21–33.
Torrent, J., Barrón, V., 2008. Diffuse reflectance spectroscopy. In: Ulery, A.L., Drees, L.R. (Eds.), Methods of Soil Analysis. Part 5. Mineralogical Methods, SSSA Book Series, vol. 5. Soil Science Society of America, pp. 367–387.
Vandenberghe, R.E., De Grave, E., de Bakker, P.M.A., 1994. On the methodology of the analysis of Mössbauer spectra. Hyperfine Interactions 83, 29–49. Viscarra-Rossel, R.A., Walvoort, D.J.J., McBratney, A.B., Janik, L.J., Skjemstad, J.O.,
2006. Visible, near-infrared, mid-infrared or combined diffuse reflectance spectroscopy for simultaneous assessment of various soil properties. Geoderma 131, 59–75.