© Author(s) 2017. CC Attribution 3.0 License.
Connecting spatial and temporal scales of tropical precipitation in
observations and the MetUM-GA6
Gill M. Martin1, Nicholas P. Klingaman2, and Aurel F. Moise3 1Met Office, Exeter, UK
2National Centre for Atmospheric Science-Climate and Department of Meteorology, University of Reading, UK 3Bureau of Meteorology, Melbourne, Australia
Correspondence to:Gill M. Martin ([email protected])
Received: 28 July 2016 – Published in Geosci. Model Dev. Discuss.: 13 September 2016 Revised: 1 December 2016 – Accepted: 13 December 2016 – Published: 6 January 2017
Abstract.This study analyses tropical rainfall variability (on a range of temporal and spatial scales) in a set of parallel Met Office Unified Model (MetUM) simulations at a range of hor-izontal resolutions, which are compared with two satellite-derived rainfall datasets. We focus on the shorter scales, i.e. from the native grid and time step of the model through sub-daily to seasonal, since previous studies have paid relatively little attention to sub-daily rainfall variability and how this feeds through to longer scales. We find that the behaviour of the deep convection parametrization in this model on the na-tive grid and time step is largely independent of the grid-box size and time step length over which it operates. There is also little difference in the rainfall variability on larger/longer spa-tial/temporal scales. Tropical convection in the model on the native grid/time step is spatially and temporally intermittent, producing very large rainfall amounts interspersed with grid boxes/time steps of little or no rain. In contrast, switching off the deep convection parametrization, albeit at an unrealistic resolution for resolving tropical convection, results in very persistent (for limited periods), but very sporadic, rainfall. In both cases, spatial and temporal averaging smoothes out this intermittency. On the ∼100 km scale, for oceanic regions, the spectra of 3-hourly and daily mean rainfall in the config-urations with parametrized convection agree fairly well with those from satellite-derived rainfall estimates, while at∼ 10-day timescales the averages are overestimated, indicating a lack of intra-seasonal variability. Over tropical land the re-sults are more varied, but the model often underestimates the daily mean rainfall (partly as a result of a poor diurnal cycle) but still lacks variability on intra-seasonal timescales. Ulti-mately, such work will shed light on how uncertainties in
modelling small-/short-scale processes relate to uncertainty in climate change projections of rainfall distribution and vari-ability, with a view to reducing such uncertainty through im-proved modelling of small-/short-scale processes.
Copyright statement
The work published in this journal are distributed under the Creative Commons Attribution 3.0 License. This license does not affect the Crown copyright work, which is re-usable under the Open Government Licence (OGL). The Creative Commons Attribution 3.0 License and the OGL are interop-erable and do not conflict with, reduce or limit each other. ©Crown copyright 2016
1 Introduction
with rainfall variability (droughts, floods) are relatively com-monplace. Although there have been some improvements in some aspects of the representation of precipitation between the 3rd and 5th phases of the Climate Model Intercompar-ison Project (CMIP3, Meehl et al., 2007, and CMIP5, Tay-lor et al., 2012, respectively), as described, for example, in Koutroulis et al. (2016), uncertainties in hydrological predic-tions from the current generation of models still pose a seri-ous challenge to the reliability of projections across temporal and spatial scales (Trenberth, 2011).
Previous studies have highlighted that climate model bi-ases on multi-year and global scales develop within a few days of the start of the simulation (e.g. Martin et al., 2010) and are closely related to deficiencies in the simulation of processes on much shorter and smaller scales (e.g. Stephens et al., 2010). Such mean state biases in rainfall can be asso-ciated with other biases such as in sea surface temperatures (e.g. Levine and Turner, 2012) and can contribute to uncer-tainty in projections of future tropical rainfall (e.g. Kent et al., 2015). Deep convection parametrizations in these mod-els often produce very intermittent rainfall at the level of the model’s time step and gridscale, and also produce a poor rep-resentation of the processes and timing associated with the diurnal cycle of convection over land (e.g. Stratton and Stir-ling, 2012). Such deficiencies can have a significant impact on the regional-scale circulation and water cycle (e.g. Birch et al., 2014). Studies such as Kendon et al. (2014) illustrated that representing rainfall characteristics on short and small scales may be paramount in order to eliminate these biases and thereby provide confidence in projections of the spatial and temporal characteristics of heavy rainfall in a future cli-mate.
The sheer volume of data required for analyses of rainfall variability at sub-daily timescales and kilometre-scale res-olutions can deter model developers. Analysis of sub-daily rainfall variability is therefore relatively limited in the scien-tific literature. However, the importance of studying changes in the location, type, amount, frequency, intensity and dura-tion of precipitadura-tion, and especially to changes in extremes, has been highlighted by several authors in recent years (e.g. Trenberth, 2011; Tripathi and Dominguez, 2013; Cortez-Hernandez et al., 2015). Studies of sub-daily rainfall and ex-tremes in observations (e.g. Westra et al., 2014) and in mod-els (e.g. Rosa and Collins, 2013) are becoming more com-mon in the literature and highlight discrepancies between models and observations and sensitivities to model resolu-tion and physical parametrizaresolu-tions.
Klingaman et al. (2017) showed how these large data volumes can be condensed to a manageable set of di-agnostics (Analysing Scales of Precipitation Version 1.0, ASoP1) with which we can both increase understanding of observed rainfall variability and compare model behaviour on a range of timescales and space scales. The ASoP di-agnostics include correlations with distance and time, as well as one-dimensional (1-D) and 2-D spectra of rainfall
amounts, and can be applied to data on any timescale or space scale, although the diagnostics are designed for the range of time step/gridscale up to sub-seasonal/meso-α scale (∼90 days/∼500 km). Klingaman et al. (2017) applied ASoP1 to Indo-Pacific Warm Pool precipitation data from 10 mod-els used in the “Vertical structure and physical processes of the Madden–Julian Oscillation” model-evaluation project (Xavier et al., 2015). The authors found large inter-model variations in the degree of spatial and temporal intermittency in time step precipitation, but that the models’ scales of pre-cipitation were highly similar when the prepre-cipitation data were averaged to the 3 h, 600 km scale.
Motivated by those results, in the present study we use the ASoP1 methods to examine how the spatial and tempo-ral intermittency of tropical precipitation in the Met Office global general circulation model (GCM) varies with horizon-tal resolution – and, by extension, time step length – and the treatment of deep convection. In Klingaman et al. (2017), the Met Office Unified Model (MetUM) displayed particularly high spatial and temporal intermittency in time step and grid-scale precipitation. Here, we analyse sub-daily precipitation intermittency in the simulations across a range of horizontal resolutions with parametrized convection, as well as in a sim-ulation with an explicit representation of mid-level and deep convection. In all cases, we examine how sub-daily precipi-tation intermittency may influence rainfall characteristics at longer timescales (up to∼20 days), in order to demonstrate how the ASoP1 diagnostics can be used routinely as part of model parametrization development.
The paper is arranged as follows. In Sect. 2 we provide de-tails of the model and observation datasets used in this study, in Sect. 3 we analyse the temporal and spatial coherence of the tropical rainfall on sub-daily timescales, in Sect. 4 we ex-amine the spectral distributions of rainfall amounts at a range of timescales and space scales up to∼20 days and our dis-cussion and conclusions are presented in Sect. 5.
2 Datasets used in this study 2.1 Model description
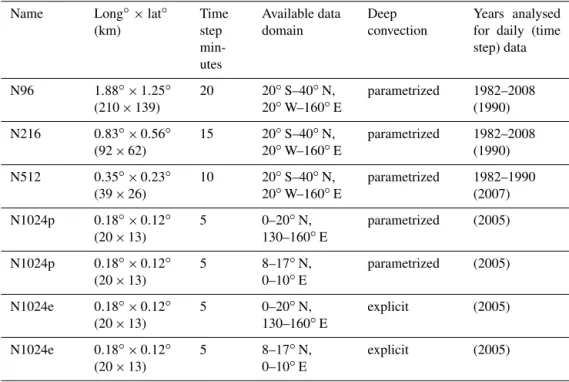
simula-Table 1.For each MetUM-GA6.0 simulation: the name of the simulation, the horizontal resolution in degrees (to the nearest 0.01 ) and the equivalent in kilometres at the Equator, the time step, the largest domain over which data were extracted, the representation of deep convection (either a sub-gridscale parametrization or entirely “explicit” convection) and the years of daily (time step) data analysed. Note that data are limited to June, July, August, and September of any given year. Models are listed in order of decreasing horizontal grid spacing, as in the figures.
Name Long◦
×lat◦ (km) Time step min-utes Available data domain Deep convection Years analysed for daily (time step) data
N96 1.88◦
×1.25◦ (210×139)
20 20◦S–40◦N, 20◦W–160◦E
parametrized 1982–2008 (1990)
N216 0.83◦
×0.56◦ (92×62)
15 20◦S–40◦N, 20◦W–160◦E
parametrized 1982–2008 (1990)
N512 0.35◦
×0.23◦ (39×26)
10 20◦S–40◦N, 20◦W–160◦E
parametrized 1982–1990 (2007)
N1024p 0.18◦
×0.12◦ (20×13)
5 0–20◦N,
130–160◦E
parametrized (2005)
N1024p 0.18◦
×0.12◦ (20×13)
5 8–17◦N,
0–10◦E
parametrized (2005)
N1024e 0.18◦
×0.12◦ (20×13)
5 0–20◦N,
130–160◦E
explicit (2005)
N1024e 0.18◦×0.12◦ (20×13)
5 8–17◦N,
0–10◦E
explicit (2005)
tions are forced with daily observed sea surface temperature (SST) and sea ice forcings from the OSTIA product (Donlon et al., 2012), bilinearly interpolated from the OSTIA 1/20◦ resolution to the MetUM horizontal grids.
The MetUM-GA6 naming conventions and parameter set-tings for the different resolutions used in the current study match those described by Johnson et al. (2016) for MetUM-GA3. As discussed by Johnson et al. (2016), very few param-eters in the MetUM are changed with resolution, but there are a few that must be changed to ensure numerical stability. In the MetUM-GA6 simulations analysed in our study, most of the parameter settings for the different resolutions match those shown in Johnson et al. (2016; their Table 2). Note that the inclusion of the ENDGAME dynamical core improved model stability, negating the need for targeted diffusion of moisture. An additional resolution, termed “N1024”, with a 0.18◦
×0.12◦
grid, is also included. The settings at N1024 resolution are also kept the same, except for the dynamical core’s alternating-direction implicit (ADI) pseudo-time step, which is related to the efficiency of the implicit solver at high latitudes. This is reduced to 7×10⁻⁵in the N1024 simula-tions.
Table 1 contains details of the MetUM-GA6 simulations and the domains over which we analyse the precipitation data. Time step rainfall data for an extended tropical region (40◦S–40◦N) were archived for only one June–September
season (JJAS) due to their computational and storage costs. The year of output depended on when the time step diag-nostics were enabled manually; for the N512 simulation this was originally 1985. However, due to a technical error in the original diagnostic output, the simulation had to be repeated, using the same configuration and with time step diagnostics enabled, for June–September 2007, due to the availability of a 1 June restart file for that year. Daily data were available for at least 8 years (often 27 years), from 1982 onwards, in all but the N1024 simulations, which were run for only 4 years due to computational cost. Due to the relatively small amount of daily data available for the N1024 simulations, only the time step data for these configurations are included in this study. Despite time step data being available for dif-fering years between the runs, we consider that the sample is sufficiently large for the results to be robust. Comparison of other model runs (not shown) where more than one sea-son of time step data was available have also shown that the results have little sensitivity to the year used. In the anal-ysis of spatial and temporal intermittency, for most of the simulations we analyse a tropical domain covering the equa-torial Indian Ocean, Maritime Continent and the far west-ern Pacific Ocean (10◦
S–10◦
N, 60–160◦
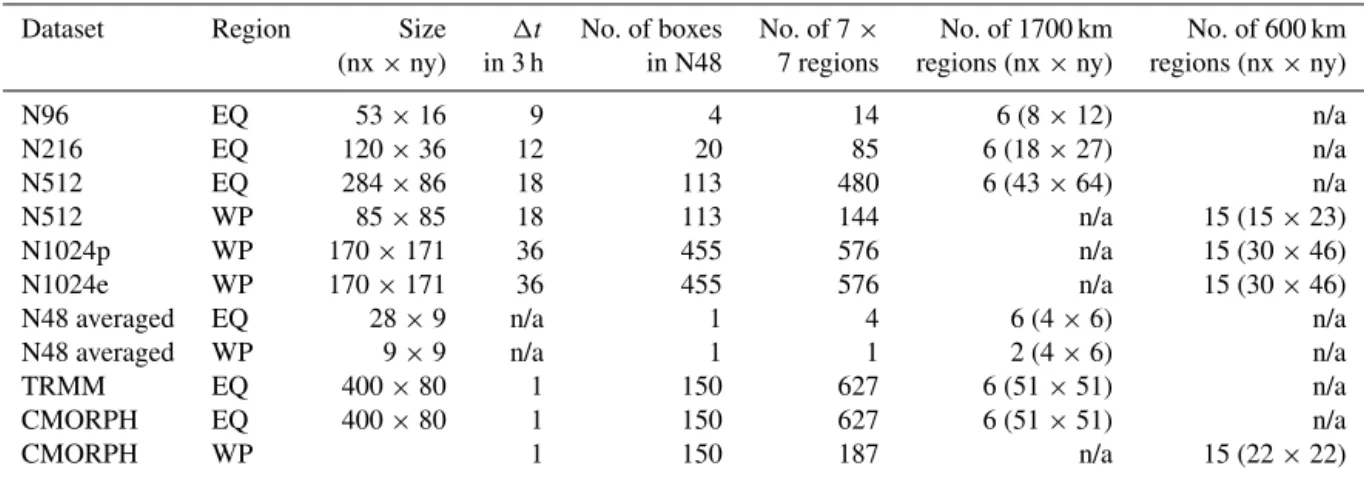
Table 2.For each MetUM-GA6 resolution, as well as TRMM and CMORPH: the analysis region used; the dimensions of each region in native grid boxes; the number of model time steps in 3 h; the number of native grid boxes in an N48 grid box (rounded to the nearest whole grid box); the number of 7×7 native grid box regions in the analysis domain; and the number of “equal-area” 1700 and 600 km regions in the analysis domain, with the dimensions of the regions (in native grid boxes) shown in parentheses.
Dataset Region Size 1t No. of boxes No. of 7× No. of 1700 km No. of 600 km (nx×ny) in 3 h in N48 7 regions regions (nx×ny) regions (nx×ny)
N96 EQ 53×16 9 4 14 6 (8×12) n/a
N216 EQ 120×36 12 20 85 6 (18×27) n/a
N512 EQ 284×86 18 113 480 6 (43×64) n/a
N512 WP 85×85 18 113 144 n/a 15 (15×23)
N1024p WP 170×171 36 455 576 n/a 15 (30×46)
N1024e WP 170×171 36 455 576 n/a 15 (30×46)
N48 averaged EQ 28×9 n/a 1 4 6 (4×6) n/a
N48 averaged WP 9×9 n/a 1 1 2 (4×6) n/a
TRMM EQ 400×80 1 150 627 6 (51×51) n/a
CMORPH EQ 400×80 1 150 627 6 (51×51) n/a
CMORPH WP 1 150 187 n/a 15 (22×22)
two limited domains that were available to us (due to stor-age and computational limits), one in the western Pacific Ocean (0–20◦
N, 130–160◦
E; hereafter the “WP” domain), and the other over western Africa (8–17◦
N, 0–10◦
E, here-after the “WA” domain). We use data from the next-finest resolution (N512) to demonstrate that there are limited dif-ferences in sub-daily precipitation characteristics over ocean between the EQ and WP domains. The domains used are il-lustrated in Fig. 1.
As an additional test of the ability of the ASoP1 diagnos-tics to identify different behaviour in rainfall variability, we also analyse a N1024 simulation where parametrized deep convection is switched off (N1024e). Although this simula-tion has a horizontal resolusimula-tion at which explicit convecsimula-tion is unlikely to be realistic, it is worth exploiting the oppor-tunity afforded by this pair of simulations to compare the rainfall variability with and without parametrized deep con-vection, but at the same horizontal resolution and model time step.
2.2 Satellite-based rainfall analyses
We compare the models’ precipitation data with two sets of satellite-derived analyses: those from the Tropical Rainfall Measuring Mission 3B42 product, version 7 (TRMM; Kum-merow et al., 1998a; Huffman et al., 2007, 2010) and those from the CPC MORPHing technique version 1.0 (CMORPH; Joyce et al., 2004). Both products are derived from a com-bination of infrared and microwave sounders and calibrated against gauge data. TRMM and CMORPH are available at 3-hourly and daily time resolution and a maximum horizon-tal resolution of 0.25◦
×0.25◦
. We analyse daily averages of these products across a common period of 2001–2012, while JJAS from the year 2005 is used for analysis of the raw 3-hourly data, for comparison against the single JJAS of
3-hourly data from each model configuration. Comparisons of the results for 3-hourly data between this single JJAS sea-son and all JJAS seasea-sons from each dataset show only small differences (not shown), confirming that the use of a single season is justified.
3 Sub-daily spatial and temporal intermittency 3.1 Behaviour on the native grid and time step
Figure 1.Map illustrating the regions used in this study. “WA”: western Africa; “WP” western Pacific; “EQ”: equatorial region. See text for further details.
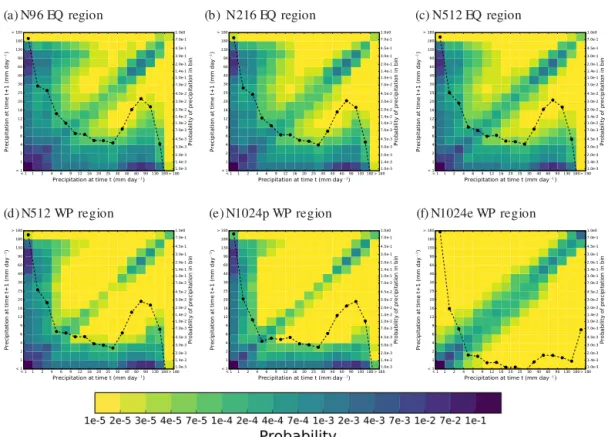
Perhaps most striking is the consistency of the time step rain-rate PDFs (dashed line) among the parametrized-convection configurations, regardless of the horizontal reso-lution. Resolution hardly alters the PDF of time step rain-fall, when converted to daily rates, which indicates that the convective parametrization is not strongly affected by changes in grid-box area or the associated changes in the strength of the dynamical forcing. We hypothesize that this is due to an “all-or-nothing” behaviour in the MetUM convec-tive parametrization; when deep convection is triggered, the parametrization often produces the maximum possible rain rate, even for relatively weak forcing. This is consistent with the lack of moderate time step rain rates (9–30 mm day−1)at all resolutions with parametrized convection. We note that the rain-rate PDFs would differ with resolution if we ex-pressed the rain rates as per time step values, but this would not provide a clean comparison between the simulations.
The intermittent behaviour in the tropical deep convective rainfall is caused by the choice of closure at GA6, in which the mass flux amplitude is set to depend on the Convective Available Potential Energy (CAPE) detected in the grid box, rather than the rate of atmospheric destabilization (A. Stir-ling, personal communication, 2016). The resultant heating applied produces an inversion at the top of the boundary layer on the next time step that the diagnosis deems too strong to allow convection to initiate. It remains in this state until the inversion has been eroded by a combination of heating in the boundary layer and large-scale ascent. Examination of time series of tropical rainfall from the start of each simulation (not shown) indicates that this behaviour occurs immediately at the start of the simulation with very little spin-up (less than 1 day), regardless of grid size or time step length.
Switching from a parametrized to an explicit treat-ment of deep convection at N1024 resolution transforms MetUM-GA6 from producing highly intermittent precipita-tion (Fig. 2e) to highly persistent precipitaprecipita-tion (Fig. 2f). In the 2-D PDF of time step, grid-box precipitation, N1024e produces high values on the diagonal and low values on the axes, reminiscent of the most persistent models anal-ysed by Klingaman et al. (2017). However, the highly
bi-modal 1-D rain-rate PDF (dashed line in Fig. 2f) shows that N1024e exhibits even stronger “all-or-nothing” behaviour than N1024p. On average, only 2 % of time steps precip-itate at rates ≥2 mm day−1, but most of those have rates ≥180 mm day−1. This is almost certainly due to the ex-tremely strong forcing required to lift a∼20 km× 14 km grid box, and confirms that N1024e is a very coarse resolu-tion at which to use an explicit representaresolu-tion of deep convec-tion. Future work will investigate how this behaviour changes as the resolution is increased in convection-permitting simu-lations.
(a) N96 EQ region (b) N216 EQ region (c) N512 EQ region
(d) N512 WP region (e) N1024p WP region (f) N1024e WP region
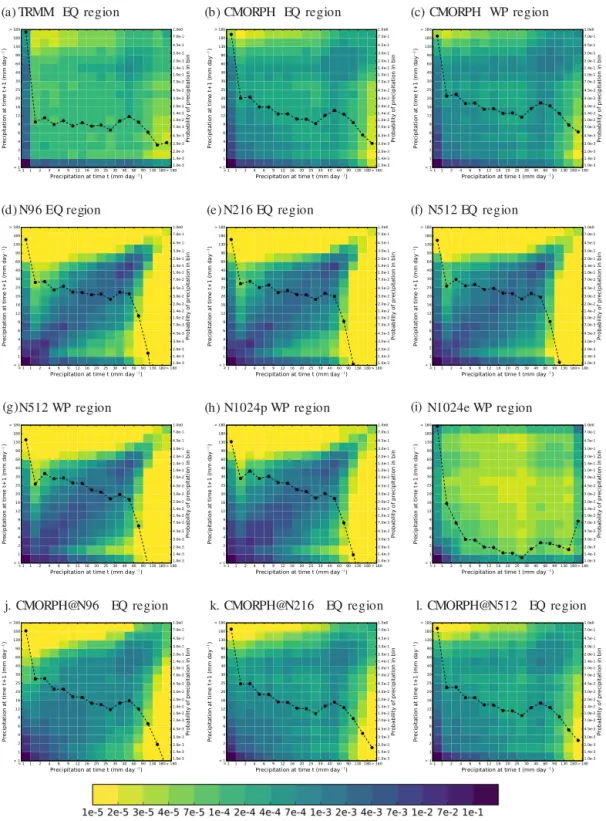
Figure 2. For each MetUM GA6 configuration in Table 1, the filled blocks show the 2-D histogram of binned rain rates (in mm day−1) on consecutive time steps at the same grid box, aggregated over all grid boxes; the dashed line shows the 1-D histogram of binned precip-itation, using the right-hand vertical axis. Bins were chosen qualitatively such that 3-hourly TRMM analyses over the EQ region have an approximately uniform distribution for rain rates greater than 1 mm day−1. Note the logarithmic colour scale.
3.2 Effects of temporal averaging
To examine whether the characteristics of grid box, time step precipitation discussed in Sect. 3.1 persist at longer timescales, we apply the 2-D histogram diagnostic from Klingaman et al. (2017) to 3 h averaged time step precipi-tation data (Fig. 4). Such temporal averaging reduces pre-cipitation intermittency at all resolutions with parametrized convection, producing higher probabilities along the central diagonal and lower probabilities along the axes relative to Fig. 2. This implies that, when averaged over 3 h, the con-vection scheme starts to display sensitivity to the large-scale forcing, as the strength thereof determines the frequency with which the convection scheme can be activated. In contrast, such averaging leads to much greater intermittency for the N1024e configuration (Fig. 4i). The temporal persistence seen in the N1024e time step data (Fig. 2f) does not carry across to the 3-hourly scale, likely because the decorrelation time of gridscale precipitation in the explicit-convection con-figuration is much longer than a time step (5 min) but shorter than 6 h (i.e. two consecutive 3 h periods, as considered in the 2-D histograms). This suggests that the grid-box precipi-tation features in N1024e, as well as the associated gridscale forcing, often have lifetimes of 3 h or fewer.
N1024e-WP also has consecutive 3 h steps with very high (> 180 mm day−1)rainfall, which occurs about 35 % of the time that there is rainfall in this bin (i.e. 35 % of the time that there is > 180 mm day−1 in one 3 h window, there is also > 180 mm day−1in the next 3 h window). All configura-tions with parametrized convection produce 3 h rain rates that are too persistent relative to CMORPH and TRMM, whether the analyses are considered on their native grids (Fig. 4a– c) or averaged to the same grids as the model configurations (shown for CMORPH only; Fig. 4j–l). Comparing CMORPH across resolutions shows an increase in precipitation inter-mittency at finer gridscales, which MetUM-GA6 also shows, but to a more limited extent. TRMM rainfall is somewhat more intermittent than CMORPH, but the results from all model configurations are outside the range of those from the satellite-derived analyses.
3.3 Effects of spatial averaging
To test the effects of spatial averaging on the characteristics of time step precipitation, we average the data from each model to a horizontal resolution of 3.75◦×
2.5◦
N96 EQ region N216 EQ region
N512 EQ region N512 WP region
N1024p WP region N1024e WP region
(a) (b)
(c) (d)
(e) (f)
Equator) Equator)
Equator) Equator)
Equator) Equator)
TRMM EQ region CMORPH EQ region CMORPH WP region
N96 EQ region N216 EQ region N512 EQ region
N512 WP region N1024p WP region N1024e WP region
j. CMORPH@N96 EQ region k. CMORPH@N216 EQ region l. CMORPH@N512 EQ region
(a) (b) (c)
(d) (e)
(g) (h) (i)
(f)
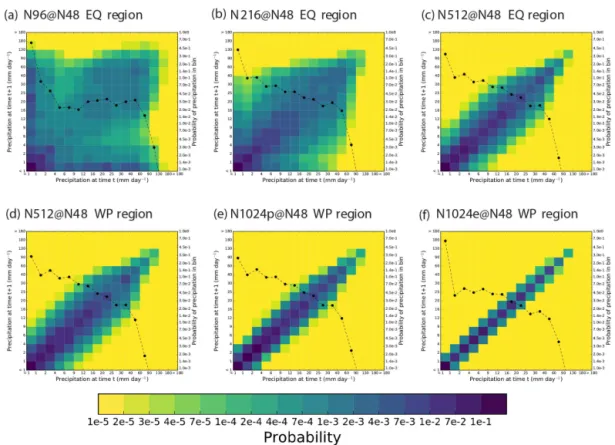
Figure 5. As in Fig. 2, but using time step rain rates that were first spatially averaged to a 3.75◦×2.5◦ horizontal grid (MetUM N48 resolution).
use N48 to ensure that all models are subject to some de-gree of spatial averaging, following Klingaman et al. (2017). Table 2 shows the number of native-resolution grid boxes in each 3.75◦
×2.5◦
region for each model. Spatial averag-ing reduces temporal intermittency in precipitation at all res-olutions, whether with parametrized or explicit convection (cf. Fig. 5 with Fig. 2). All configurations produce higher probabilities on the central diagonal and lower probabilities on the horizontal and vertical axes. The reductions in inter-mittency are greatest for the finest-resolution configurations, with N512 (Fig. 5c) showing much more persistent precipita-tion than N96 (Fig. 5a) over the EQ region. This is due to the much greater number of N512 grid boxes (113 boxes) aver-aged together to create each N48 grid box, compared with N96 (4 boxes). Applying 2×2 spatial averaging to N512 yielded a highly similar 2-D PDF as in the N96 simulation averaged to N48 (not shown). Even at N48 resolution, when 450 boxes are averaged together, the precipitation from the N1024e configuration (Fig. 5f) remains more persistent than that from the N1024p configuration (Fig. 5e), with far fewer precipitating grid boxes.
3.4 Effects of temporal and spatial averaging
In a similar manner to the results of Klingaman et al. (2017), we find that applying temporal and spatial averaging to 3 h
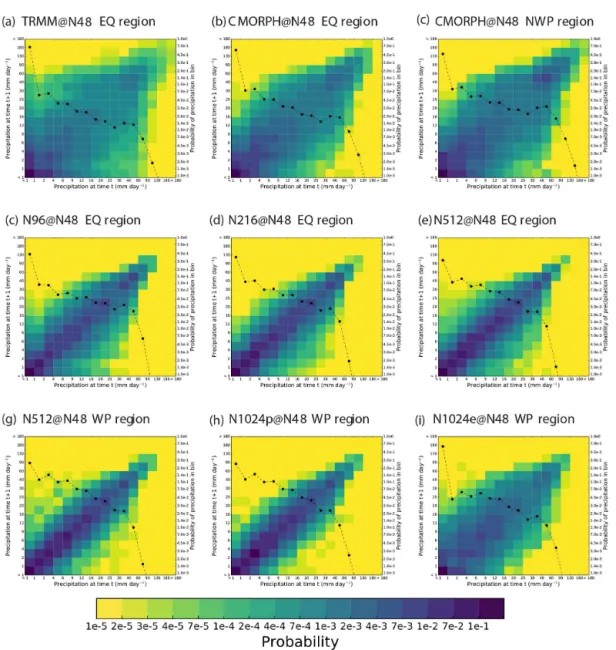
and∼400 km resolution, respectively, leads to similar 2-D PDFs for all resolutions of this MetUM configuration that have parametrized convection, and that these are all too per-sistent relative to TRMM and CMORPH at the same resolu-tions (Fig. 6). The rain-rate PDFs are also remarkably simi-lar between the resolutions, except for slightly more frequent heavy rainfall (and fewer near-zero values) at finer resolu-tions. In contrast, following temporal and spatial averaging, the configuration with explicit convection strongly resem-bles CMORPH and TRMM in temporal persistence and rain-rate PDF, except for having more near-zero values and fewer heavy-rain values. This is discussed further in Sect. 4.3.
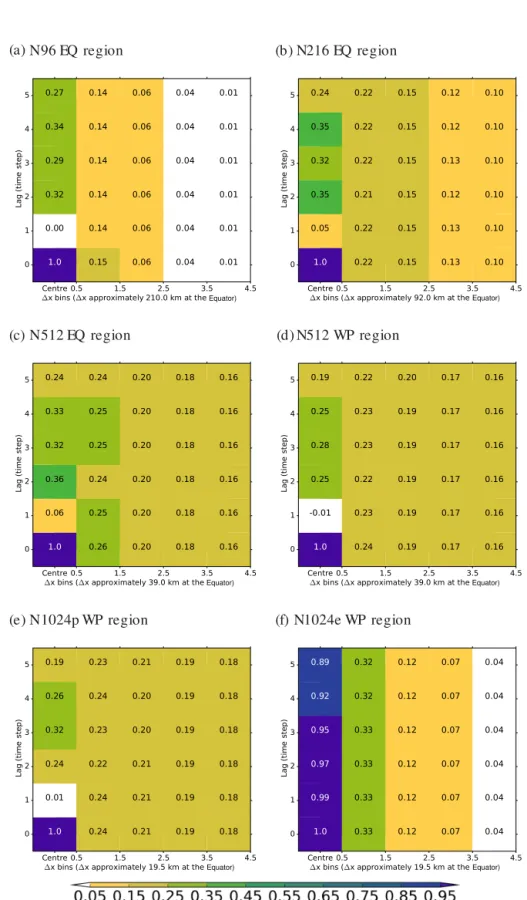
3.5 Correlations with physical distance and time
To summarize the spatial and temporal coherence of grid box, time step precipitation in the model configurations, as well as the effects of spatial and temporal averaging on that coherence, we present correlations of precipitation as func-tions of physical distance (in kilometres) and time (in min-utes). These diagnostics allow the model results to be com-pared more easily than in Fig. 6, because they show correla-tions as funccorrela-tions both of the number of model grid boxes or time steps and of physical distance and time.
Figure 6.As in Fig. 2, but using 3 h mean rain rates interpolated the 3.75◦×2.5◦grid (MetUM N48 horizontal resolution).
then correlate the rainfall in each grid box in each region against the central grid box in the region; correlation values are binned by the distance from the central grid box, with a bin width equal to1x(see Klingaman et al., 2017, for de-tails). In the EQ region, we use 1700 km×1700 km regions so that the region is at least 41xwide at the coarsest resolution considered (N48). In the WP region, we use 600 km×600 km regions for native-resolution data, due to the limited size of the region, but 1700 km×1700 km regions for N48 data for the reasons discussed above. Table 2 gives the number and dimensions of the equal-area regions for each MetUM-GA6 resolution in each region, including the N48-averaged data, as well as for TRMM and CMORPH.
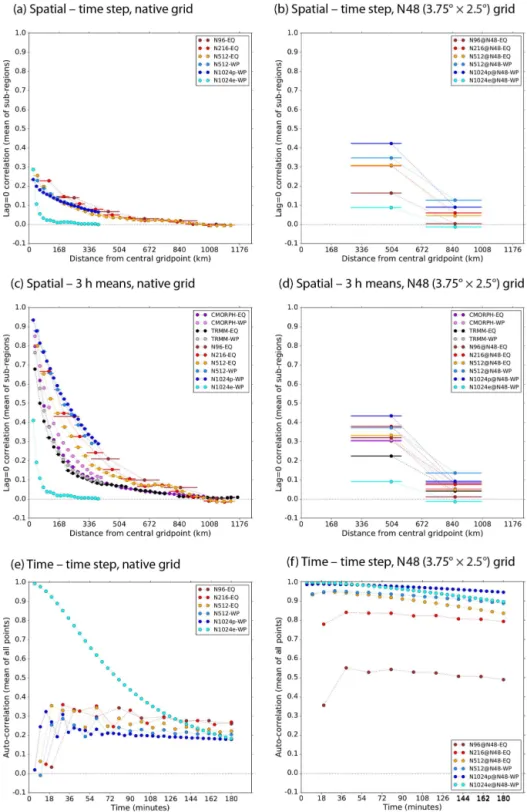
Correlations with distance show that all configurations with parametrized convection produce similar spatial scales of time step precipitation, regardless of resolution, whereas
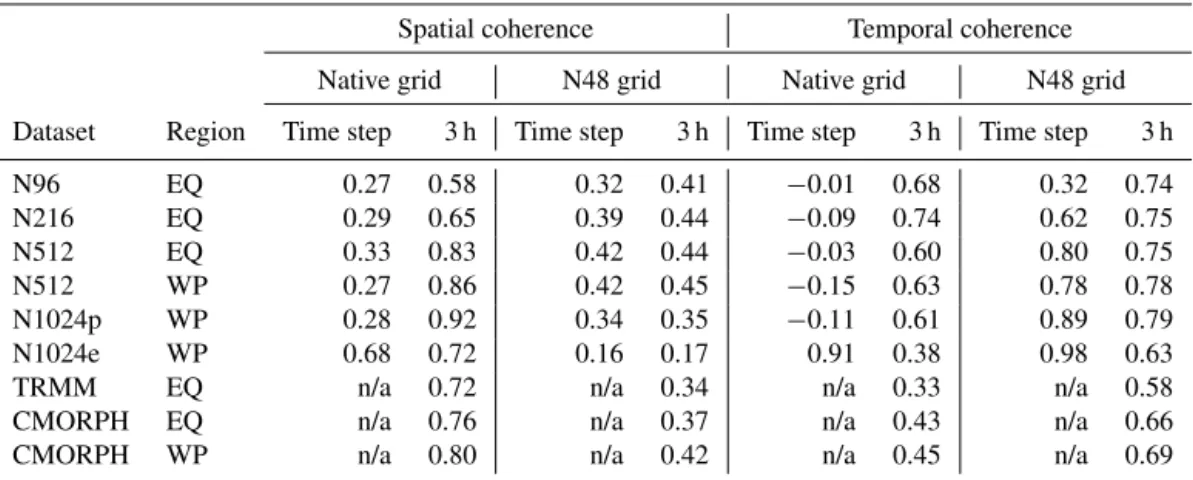
Table 3.Summary metrics of spatial and temporal coherence in precipitation using time step and 3 h data on the native horizontal grid and averaged to the N48 (3.75◦×2.5◦) grid. Positive values indicate that coherence is more common than intermittency. Higher positive (negative) magnitudes indicate stronger coherence (intermittency). The time step column is marked “n/a” for TRMM and CMORPH because these datasets exist only as 3 h values.
Spatial coherence Temporal coherence
Native grid N48 grid Native grid N48 grid
Dataset Region Time step 3 h Time step 3 h Time step 3 h Time step 3 h
N96 EQ 0.27 0.58 0.32 0.41 −0.01 0.68 0.32 0.74
N216 EQ 0.29 0.65 0.39 0.44 −0.09 0.74 0.62 0.75
N512 EQ 0.33 0.83 0.42 0.44 −0.03 0.60 0.80 0.75
N512 WP 0.27 0.86 0.42 0.45 −0.15 0.63 0.78 0.78
N1024p WP 0.28 0.92 0.34 0.35 −0.11 0.61 0.89 0.79
N1024e WP 0.68 0.72 0.16 0.17 0.91 0.38 0.98 0.63
TRMM EQ n/a 0.72 n/a 0.34 n/a 0.33 n/a 0.58
CMORPH EQ n/a 0.76 n/a 0.37 n/a 0.43 n/a 0.66
CMORPH WP n/a 0.80 n/a 0.42 n/a 0.45 n/a 0.69
Correlations with time show that all configurations with parametrized convection show a strong lag-1 decrease in the auto-correlation of time step precipitation (Fig. 7e), which persists even when spatial averaging is applied (Fig. 7f), al-though it reduces in magnitude as more grid boxes are av-eraged together in the finer-resolution models. This further demonstrates the intermittent nature of parametrized convec-tion in MetUM-GA6, which is insensitive to horizontal reso-lution. The N1024e configuration produces a smooth auto-correlation function for time step data, which asymptotes to the same value as the N1024p configuration within the 3 h window considered. While the two configurations have similar temporal coherence of precipitation at a 3 h lag, the N1024p configuration achieves this by averaging intermit-tent time step convection, whereas the N1024e configura-tion achieves this by averaging persistent convective events of various lifetimes ranging from a few time steps to several hours.
3.6 Summary metrics
Table 3 presents summary metrics from ASoP1 of the spa-tial and temporal coherence in precipitation using time step and 3 h data on the native horizontal grids and averaged to the N48 grid. These metrics are computed from the co-herence of upper-quartile and lower-quartile precipitation in space and time; higher positive values indicate greater co-herence. The metrics reflect the findings above. All models with parametrized convection show temporal intermittency in time step data on the native grid, regardless of model resolution; spatial coherence is also low. After averaging to 3 h scales on the models’ native grids, there is a large in-crease in temporal and spatial coherence of tropical rain-fall in all model simulations with parametrized convection. In this case, there is a noticeable increase in spatial
coher-ence as model resolution increases (reflecting the decreasing grid size, since the metrics are computed on the native grid), while there remains no systematic change in temporal coher-ence with resolution. The spatial cohercoher-ence at this timescale is similar to that in the satellite-derived datasets, while the temporal coherence is noticeably greater.
Both the satellite-derived rainfall datasets and the model simulations show a reduction in spatial coherence of tropical rainfall at the 3 h timescale following averaging to the coarser N48 resolution, while the temporal coherence increases. The reduction in spatial coherence at N48 relative to the native grids occurs because the metrics are computed based on a fixed distance in gridpoints (of the input data), rather than a fixed physical distance; a coarser grid would be expected to have less coherent precipitation, due to the greater physical distance between gridpoints. On the N48 scale there is a more systematic increase in temporal coherence at finer model res-olutions, particularly for the time step data (partly, at least, due to the decreasing time step with increasing model reso-lution). Overall, the values show that, following spatial and temporal averaging, the simulations with parametrized con-vection show only slightly larger spatial and temporal coher-ence than the satellite-derived rainfall, and little systematic change in either temporal or spatial coherence with resolu-tion.
rarely last for longer than 3 h and are followed by prolonged dry intervals).
Ultimately, following averaging to the N48 grid and 3 h scale, the temporal and spatial coherence of tropical rain-fall from all the model simulations is similar to that from the satellite-derived datasets.
4 Spectral characteristics
To examine the distribution of precipitation intensity on a range of spatial and temporal scales, and its sensitivity to temporal and spatial averaging, we compute the contribu-tions of discrete bins of precipitation intensity to the total precipitation at a grid box. The result is a spectrum that shows the relative importance of precipitation events in a given intensity bin to the total precipitation. As in Klinga-man et al. (2017), we use 100 bins of varying width, defined by the following equation and sampling rainfall intensities in the range of 0.005–2360 mm day−1:
bi=e
ln(0.005)+
i·(ln(120)−ln59(0.005))2
1 2 , (1)
whereiis the number of the bin and ranges from 1 to 100, and ln(x)is the natural logarithm ofx. A further lower bin edge is added at 0.0 to ensure that a histogram of counts computed using these bins sums to the number of valid data points in the sample. By calculating these contributions at many grid boxes in a region, we produce maps of the con-tributions of various precipitation intensity bins to the total precipitation at each grid box (e.g. Fig. 8). Regional averages of the spectra can also be produced for direct comparison be-tween datasets, although it should be noted that this process introduces a spatial averaging of the spectra themselves and hence is best done for relatively small regions only.
Analysis of the spectral characteristics of these runs pro-vides further evidence of the points made in Sect. 3, and al-lows us to investigate the influence on rainfall amounts at longer timescales. They also illustrate the effects of tempo-ral and/or spatial averaging of time step/grid-box data, which can indicate temporal and spatial intermittency. We analyse the spectral characteristics on each given timescale at each grid box of the dataset (at whichever resolution is being anal-ysed). We then use spectra averaged over particular regions to illustrate the characteristics of this model configuration. The regions were chosen based on typical climatological bias re-gions illustrated in Walters et al. (2016): wet bias rere-gions of the equatorial Indian Ocean, southern China and the western Pacific, and the western Africa dry bias region.
We first compare the rainfall spectra at the native grid and time step among model resolutions. Noting that the time step length is shorter at the higher horizontal resolutions (see Ta-ble 1), the broad similarity, particularly over the ocean, be-tween the spectral maps at native resolution, even as the hor-izontal resolution is increased 5-fold, is remarkable (Fig. 8) and suggests that the convection parametrization behaviour in the tropics is not very scale aware (except perhaps for larger rainfall events). Closer examination of the spectra in different regions (Fig. 9a and b, solid lines) reveals that the higher-resolution simulations do, as expected, produce more frequent, higher intensity time step events on the native grid, particularly for the land region of western Africa (WA do-main; Fig. 9b). However, when the higher resolutions are all averaged to N48 (Fig. 9a and b, dashed lines), the rainfall spectra are shifted to smaller intensities in all cases and the differences in the tail of the distribution are no longer appar-ent, suggesting that those events were spatially isolated. We also note that the effects of spatial averaging are larger for the higher model resolutions in which more grid boxes are included in the average. This illustrates the spatial intermit-tency that was highlighted in Sect. 3. However, the largest impact of spatial averaging is seen for the N1024e configu-ration. This is discussed further in Sect. 4.3.
When the precipitation data are all averaged to the N48 grid and 3 h timescale (in a similar manner to Sect. 3.4), Fig. 9c–f show that the models all tend to underestimate the 3-hourly rainfall amounts compared with TRMM and CMORPH, and that increasing the horizontal resolution does not improve the comparison on this timescale for tropical rainfall over the ocean. Indeed, we see little evidence that increasing the horizontal resolution has any overall effect on the rainfall distribution over ocean on these scales in the simulations with parametrized convection. Over the western African land region, the higher-resolution configurations do show an increase in the fractional contribution from higher 3 h totals and a corresponding decrease in the lower amounts, but this is not apparent over southern China. We note that the largest change in the spectral characteristics is seen when the convection parametrization is switched off. This is discussed further in Sect. 4.3.
4.2 Looking across timescales
Figure 8.Spectral maps of time step precipitation in JJAS from three MetUM GA6 configurations:(a)N96,(b)N216 and(c)N512. Data are analysed on each configuration’s native grid. For each panel, the fractional contributions from all bins within the given intensity range are summed at each grid box. Time step lengths and years analysed are shown in Table 1.
are also used for comparison, using the years mentioned in Sect. 2. Two oceanic regions and two land regions are se-lected in order to highlight the main findings.
The movement of the spectra towards smaller values when averaged to successively longer timescales indicates that there is variability at the longer timescale (such that including drier periods in the average decreases the longer timescale mean). For all of the regions shown in Fig. 10, the pro-gressive shift of the spectra from CMORPH towards smaller values as the timescale is increased from 3 h to 20 days is not matched by the model results, which tend to show less movement and therefore lack variability on the longer timescales. This is particularly noticeable for tropical rain-fall over the oceans; for the two regions shown in Fig. 10a and c the N96 configuration underestimates the rainfall to-tals at shorter timescales but overestimates them at longer timescales. The spectra of daily mean values agree reason-ably well with those from CMORPH, but the model lacks variations on timescales of∼10 days so that the spectra for the 10-day and 20-day means peak at larger values in the model than in CMORPH. This is confirmed in Fig. 11a and c where auto-correlations of daily rainfall with increasing time lag for these regions are consistently higher in the model
Figure 9. (a, b)Precipitation spectra averaged over different regions for the five model configurations. Solid lines show spectra at native resolution and time step while dashed lines show the spectra from each configuration when precipitation data are averaged to the N48 grid: (a)“WP” domain;(b)“WA” domain.(c–f)Precipitation spectra averaged to the N48 grid and 3 h timescale, for(c)“WP” domain,(d)“WA” domain,(e)equatorial Indian Ocean (60–80◦E, 10◦S–5◦N),(f)southern China (103–119◦E, 23–32◦N). N1024 data are not available for the latter two regions. Also included in each panel are results from the CMORPH and TRMM satellite-based rainfall analyses averaged to the same spatial and temporal scale.
in the models compared with satellite-based estimates over the western African region.
Figures 11 and 12 show the same comparison but for the N512 configuration. As indicated in Sect. 4.1, this 5-fold in-crease in horizontal resolution has little consistent impact on these characteristics of tropical rainfall variability. Compar-ison across these timescales of spectra derived from these two configurations at their native resolutions, compared with CMORPH data averaged to each of those model grids (not shown), indicates a similar lack of consistent improvement at the higher resolution.
4.3 Explicit vs. parametrized convection
high-Figure 10.Spectra of 3-hourly, daily, 10-day and 20-day rainfall totals (in mm day−1)from the MetUM-GA6 N96 configuration (solid lines), averaged over four regions:(a)“WP” domain;(b)“WA” domain,(c)equatorial Indian Ocean (10◦S–5◦N, 60–80◦E) and(d)southern China (23–32◦N, 103–119◦E). Corresponding spectra from CMORPH are shown by the dashed lines. Rainfall data were first averaged to the N48 grid in both cases.
intensity time step events are isolated to only one or two grid boxes any given time, so spatial averaging has a large impact (cf. the pairs of green and purple lines in Fig. 13a and c). Further, once spatial averaging has been carried out, the sub-sequent effects of temporal averaging between time step and 3 h scales are negligible (the light purple curves in Fig. 13a and c are almost hidden by the dark purple curves). In con-trast, for N1024p (see Fig. 13b, d) there are effects from both temporal and spatial averaging of the time step data because they are both temporally and spatially intermittent. However, once again, following spatial averaging of the time step data to∼400 km scales, the subsequent effects of averaging to 3 h scales are negligible.
In both cases, the spatially averaged spectra of fractional contributions to 3-hourly rainfall peak at lower intensities than the satellite rainfall datasets. In N1024p, both spatial and temporal intermittency contribute to this underestimate. In N1024e, even the excessive rainfall amounts in isolated grid boxes are not sufficient to compensate for the large number of surrounding grid boxes with no rainfall. How-ever, for the WA region, the N1024e simulation does appear to represent the distribution of 3-hourly rainfall rather bet-ter than N1024p. In configurations with parametrized con-vection, some of the underestimate in the 3 h totals over the
Figure 11.Auto-correlations of precipitation at different time lags, computed using daily precipitation on the N48 horizontal grid, averaged over the four regions shown in Fig. 10.
these characteristics change as resolution is increased further towards the∼100 m scale.
5 Discussion and conclusions
In order to have confidence in climate model projections of precipitation, it must be demonstrated that the modelled rain-fall responds appropriately to changing atmospheric condi-tions on all scales. The ASoP1 methods designed by Klinga-man et al. (2017) provided an additional tool for comparing and evaluating simulated rainfall variability between model configurations and with various observational datasets. Anal-ysis of the spatial and temporal characteristics of rainfall in a set of parallel configurations of the MetUM-GA6 model us-ing the ASoP1 methods has allowed several characteristics of tropical convection in these model configurations to be iden-tified:
1. Precipitation produced by the convection parametriza-tion on the native grid and time step in MetUM-GA6 is
both spatially and temporally intermittent, regardless of the horizontal resolution and time step of the model, at least for the broad range of resolutions (20–200 km) and time steps (5–20 min) considered here. This behaviour is caused by the choice of closure at GA6, in which the mass flux amplitude is set to depend on the CAPE de-tected in the grid box, rather than the rate of atmospheric destabilization. The resultant heating applied produces an inversion at the top of the boundary layer on the next time step that the diagnosis deems too strong to allow convection to initiate. It remains in this state until the inversion has been eroded by a combination of heating in the boundary layer, and large-scale ascent. This be-haviour occurs immediately at the start of the simula-tion with no spin-up, regardless of grid size or time step length. Klingaman et al. (2017) found similar behaviour in 2-day forecasts with an earlier MetUM version.
Figure 12.As Fig. 10 but for the MetUM-GA6 N512 configuration.
the native grid and time step are also largely insensitive to horizontal resolution and time step in MetUM-GA6. 3. When the convection parametrization is switched off,
albeit at an unrealistic resolution for explicit convec-tion to be represented properly, the time step precipi-tation becomes very persistent on scales up to the or-der of a few hours, but even more isolated on the grid-scale, likely due to the considerable dynamical forcing required to lift a 20 km×13 km grid box. Convective heating associated with explicit convection sets up sig-nificant ascent in the convecting column, which contin-ues the destabilization of the column, while adjacent columns experience descent and so convection is sup-pressed.
4. For MetUM-GA6 configurations with parametrized convection, spatial and temporal averaging to scales ∼400 km and∼3 h reduces the spatial and temporal in-termittency considerably. At these scales, the convec-tion scheme starts to display sensitivity to the large-scale forcing, as the strength of this is what determines the frequency with which the convection scheme can be activated. However, MetUM-GA6 produces precip-itation features that are too broad relative to the TRMM and CMORPH satellite-derived analyses.
5. For the MetUM-GA6 configuration with explicit con-vection used here, temporal averaging to scales of∼3 h has little effect on the rainfall intensities, while spatial averaging to scales of∼400 km has a very large effect, due to the large spatial intermittency.
6. Comparison of the model configurations’ tropical pre-cipitation variability on horizontal scales of∼400 km and timescales from daily to 20 days (intraseasonal) shows no systematic difference in behaviour between the different resolutions. In all cases, the model tends to underestimate the amplitude of the intra-seasonal vari-ations (i.e. there are not enough drier days), over the ocean, at all resolutions.
7. The lack of intra-seasonal variability contributes to an overall wet bias in some oceanic regions (e.g. the equa-torial Indian Ocean, the western Pacific and southern China), while underestimations of rainfall intensity on sub-daily and daily timescales in western Africa are as-sociated with a climatological dry bias.
Attributing climatological biases in regional precipitation to deficiencies in model physical parametrizations remains a challenge for model developers. Such biases can have impli-cations for weather and climate modelling on a wide range of temporal and spatial scales, from inhibiting moisture trans-port through intra-seasonal propagation of convection (e.g. Bush et al., 2015; Kim et al., 2016) to contributing to uncer-tainty in projections of future tropical rainfall (e.g. Kent et
al., 2015). By examining the behaviour of modelled tropical rainfall at a wide range of spatial and temporal scales, we can hope to shed light on the way in which such biases de-velop. Our results suggest that, in many regions, sub-seasonal tropical rainfall in the MetUM-GA6 configuration lacks vari-ability on all but the smallest available temporal and spatial scales (i.e. the model time step and gridscale). This suggests a lack of response from the convection parametrization to changing atmospheric conditions. Instead, at the time step and gridscale, the spatial and temporal intermittency appears to be quasi-random, much like the MetUM-GA3 configura-tion analysed by Klingaman et al. (2017). Such analysis pro-vides information to model developers, which should help to inform the future direction of parametrization development.
The apparent lack of sensitivity to horizontal resolution is, at first sight, in contrast with other model studies, which sug-gest an improvement in rainfall characteristics as horizontal resolution is increased (e.g. Wehner et al., 2010; Kopparla et al., 2013; Prein et al., 2013; Tripathi and Dominguez, 2013). However, several of these studies compare the results on the native grid of each model with observations at resolutions that are often higher than in any of the model configurations. This will, naturally, highlight the improved representation of the natural spatial variability of rainfall arising from lo-cal dynamilo-cal gradients, orography, etc., in higher-resolution models. Indeed, Prein et al. (2013) commented that “The major advantages of high-resolution simulations are found for small scales” and that, at scales above ∼100 km, their higher-resolution runs show only “small advantages” over their lower-resolution runs. However, Kopparla et al. (2013) point out that such comparisons differ between regions.
Finally, the increasing number of studies using convection-permitting resolutions with grid-lengths of a few kilometres (e.g. Fosser et al., 2015; Kendon et al., 2012; Prein et al., 2013) suggests that, while such models do exhibit improved sub-daily characteristics and diurnal cycles of rainfall, prob-lems remain with excessive rainfall rates and too persistent precipitation events at these resolutions. It is clear that simi-lar analyses of tropical rainfall characteristics in convection-permitting models at resolutions <∼1 km would be enlight-ening and of significant use in model development.
6 Code and data availability
The source code for the model used in this study, Me-tUM, is free to use. To apply for a licence for MetUM go to http://www.metoffice.gov.uk/research/collaboration/ um-partnership (Met Office UM Partnership Team, 2016). The availability of the ASoP1 diagnostics package is detailed in Klingaman et al. (2017). MetUM-GA6 model data are archived at the Met Office, and are currently available to UM partners. TRMM 3B42 version 7A data can be obtained from http://disc.sci.gsfc.nasa.gov/TRMM (National Aeronautics and Space Administration, 2016). CMORPH version 1.0 data can be obtained from ftp://ftp.cpc.ncep.noaa.gov/precip/ global_CMORPH/3-hourly_025deg (National Centers for Environmental Prediction Climate Prediction Center, 2016).
Author contributions. N. Klingaman analysed the spatial and tem-poral intermittency and G. Martin and A. Moise analysed the spec-tral characteristics of the rainfall data. G. Martin and N. Klingaman wrote the manuscript with input from A. Moise.
Competing interests. The authors declare that they have no conflict of interest.
Acknowledgements. G. Martin was supported by the Joint UK BEIS/Defra Met Office Hadley Centre Climate Programme (GA01101). N. Klingaman was supported by an Independent Research Fellowship from the UK Natural Environment Research Council (NE/L010976/1). A. Moise was supported by funding from the Australian Climate Change Science Program. The authors are grateful to the model development teams at the Met Office, who ran the MetUM-GA6 simulations as part of the Global Atmosphere 6.0 development process, and to Alison Stirling for helpful comments on the manuscript.
Edited by: S. Arndt
Reviewed by: two anonymous referees
References
Birch, C. E., Parker, D. J., Marsham, J. H., Copsey, D., and Garcia-Carreras, L.: A seamless assessment of the role of convection in the water cycle of the West African Monsoon, J. Geophys. Res., 119, 2890–2912, doi:10.1002/2013JD020887, 2014.
Bush, S. J., Turner, A. G., Woolnough, S. J., Martin, G. M., and Klingaman, N. P.: The effect of increased convective en-trainment on Asian monsoon biases in the MetUM general circulation model, Q. J. Roy. Meteorol. Soc., 141, 311–326, doi:10.1002/qj.2371, 2015.
Cortés-Hernández, V. E., Zheng, F., Evans, J., Lambert, M., Sharma, A., and Westra, S.: Evaluating regional climate models for sim-ulating sub-daily rainfall extremes, Clim. Dyn., 47, 1613–1628, doi:10.1007/s00382-015-2923-4, 2015.
Donlon, C. J., Martin, M., Stark, J., Roberts-Jones, J., Fiedler, E., and Wimmer, W.: Remote sensing of environment the operational sea surface temperature and sea ice analysis (OSTIA) system, Remote Sens. Environ., 116, 140–158, doi:10.1016/j.rse.2010.10.017, 2012.
Fosser, G., Khodayar, S., and Berg, P.: Benefit of convection permit-ting climate model simulations in the representation of convec-tive precipitation, Clim. Dyn., 44, 45–60, doi:10.1007/s00382-014-2242-1, 2015.
Hohenegger, C., Brockhaus, P., and Schär, C.: Towards climate simulations at cloud-resolving scales, Meteor. Z., 17, 383–394, doi:10.1127/0941-2948/2008/0303, 2008.
Huffman, G. J., Adler, R. F., Bolvin, D. T., Gu, G., Nelkin, E. J., Bowman, K. P., Hong, Y., Stocker, E. F., and Wolff, D. B.: The TRMM multi-satellite precipitation analysis: quasi-global, mul-tiyear, combined-sensor precipitation estimates at fine scale, J. Hydrometeorol., 8, 38–55, 2007.
Huffman, G. J., Adler, R. F., Bolvin, D. T., and Nelkin, E. J.: The TRMM multi-satellite precipitation analysis (TMPA), in: Satel-lite rainfall applications for surface hydrology, edited by: Hos-sain, F. and Gebremichael, M., 3–22, Springer Verlag, 2010. Jin, E. K., Choi, I.-J., Kim, S.-Y., and Han, J.-Y.: Impact of model
resolution on the simulation of diurnal variations of precipita-tion over East Asia, J. Geophys. Res.-Atmos., 121, 1652–1670, doi:10.1002/2015JD023948, 2016.
Johnson, S. J., Levine, R. C., Turner, A. G., Martin, G. M., Woolnough, S. J., Schiemann, R., Mizielinski, M. S., Roberts, M. J., Vidale, P. L., Demory, M.-E., and Strachan, J.: The resolution sensitivity of the South Asian Monsoon and Indo-Pacific in a global 0.35 deg AGCM, Clim. Dyn., 46, 807–831, doi:10.1007/s00382-015-2614-1, 2016.
Joyce, R. J., Janowiak, J. E., Arkin, P. A., and Xie, P.: CMORPH: A method that produces global precipitation estimates from passive microwave and infrared data at high spatial and temporal resolu-tion, J. Hydrometeorol., 5, 487–503, 2004.
Kendon, E. J., Roberts, N. M., Senior, C. A., and Roberts, M. J.: Re-alism of rainfall in a very high resolution regional climate model, J. Climate, 25, 5791–5806, 2012.
Kendon, E. J., Roberts, N. M., Fowler, H. J., Roberts, M. J., Chan, S. C., and Fowler, C. A.: Heavier summer downpours with climate change revealed by weather forecast resolution model, Nature Climate Change, 4, 570–576, doi:10.1038/NCLIMATE2258, 2014.
Pre-00613.1, 2015.
Kim, H.-M., Kim, D., Vitart, F., Toma, V. E., Kug, J.-S., and Web-ster, P. J.: MJO Propagation across the Maritime Continent in the ECMWF Ensemble Prediction System, J. Climate, 29, 3973– 3988, doi:10.1175/JCLI-D-15-0862.1, 2016.
Klingaman, N. P. and Woolnough, S. J.: Using a case-study ap-proach to improve the Madden-Julian oscillation in the Hadley Centre model, Q. J. Roy. Meteor. Soc., 140, 2491–2505, 2014. Klingaman, N. P., Martin, G. M., and Moise, A.: ASoP (v1.0): a set
of methods for analyzing scales of precipitation in general circu-lation models, Geosci. Model Dev., 10, 57–83, doi:10.5194/gmd-10-57-2017, 2017.
Kopparla, P., Fischer, E. M., Hannay, C., and Knutti, R.: Im-proved simulation of extreme precipitation in a high-resolution atmosphere model, Geophys. Res. Lett., 40, 5803–5808, doi:10.1002/2013GL057866, 2013.
Koutroulis, A. G., Grillakis, M. G., Tsanis, I. K., and Papadim-itriou, L.: Evaluation of precipitation and temperature simulation performance of the CMIP3 and CMIP5 historical experiments, Clim. Dynam., 47, 1881–1898, doi:10.1007/s00382-015-2938-x, 2016.
Kummerow, C., Barnes, W., Kozu, T., Shiue, J., and Simpson, J.: The Tropical Rainfall Measuring Mission (TRMM) sensor pack-age, J. Atmos. Ocean. Tech., 15, 809–817, 1998.
Levine, R. C. and Turner, A. G.: Dependence of Indian monsoon rainfall on moisture fluxes across the Arabian Sea and the impact of coupled model sea surface temperature biases, Clim. Dyn., 38, 2167–2190, doi:10.1007/s00382-011-1096-z, 2012.
Martin, G. M., Milton, S. F., Senior, C. A., Brooks, M. E., Ineson, S., Reichler, T., and Kim, J.: Analysis and Reduc-tion of Systematic Errors through a Seamless Approach to Modelling Weather and Climate, J. Climate, 23, 5933–5957, doi:10.1175/2010JCLI3541.1, 2010.
Meehl, G. A., Covey, C., Delworth, T., Latif, M., McAvaney, B., Mitchell, J. F. B., Stouffer, R. J., and Taylor, K. E.: The WCRP CMIP3 multi-model dataset: A new era in climate change re-search, B. Am. Meteor. Soc., 88, 1383–1394, 2007.
Met Office UM Partnership Team: Unified Model Partner-ship, available at: http://www.metoffice.gov.uk/research/ collaboration/um-partnership, 2016.
Molinari, J. and Dudek, M.: Parameterization of convective precipitation in mesoscale numerical models: A critical re-view, Mon. Weather Rev., 120, 326–344, doi:10.1175/1520-0493(1992)120<0326:POCPIM>2.0.CO;2, 1992.
National Centers for Environmental Prediction Climate Prediction Center: CMORPH 3-hourly 0.25 degree data, available at: ftp://ftp.cpc.ncep.noaa.gov/precip/global_CMORPH/3-hourly_ 025deg, 2016.
Prein, A. F., Holland, G. J., Rasmussen, R. M., Done, J., Ikeda, K., Clark, M. P., and Liu, C. H.: Importance of regional cli-mate model grid spacing for the simulation of heavy precipi-tation in the Colorado headwaters, J. Climate, 26, 4848–4857, doi:10.1175/JCLI-D-12-00727.1, 2013.
Rosa, D. and Collins, W. D.: A case study of subdaily simulated and observed continental convective precipitation: CMIP5 and mul-tiscale global climate models comparison, Geophys. Res. Lett., 40, 5999–6003, doi:10.1002/2013GL057987, 2013.
convection in GCMs, Q. J. Roy. Meteor. Soc., 138, 1121–1134, doi:10.1002/qj.991, 2012.
Stephens, G. L., L’Ecuyer, T., Forbes, R., Gettlemen, A., Golaz, J.-C., Bodas-Salcedo, A., Suzuki, K., Gabriel, P., and Haynes, J.: The dreary state of precipitation in global models, J. Geophys. Res., 115, D24211, doi:10.1029/2010JD014532, 2010.
Taylor, K. E., Stouffer, R. J., and Meehl, G. A.: An Overview of CMIP5 and the experiment design, B. Am. Meteor. Soc., 93, 485–498, doi:10.1175/BAMS-D-11-00094.1, 2012.
Tian, Y., Peters-Lidard, C. D., and Eylander, J. B.: Real-time bias reduction for satellite-based precipitation estimates, J. Hydrom-eteorol., 11, 1275–1285, doi:10.1175/2010JHM1246.1, 2010. Trenberth, K. E.: Changes in precipitation with climate change,
Cli-mate Res., 47, 123–138, 2011.
Tripathi, O. P. and Dominguez, F.: Effects of spatial resolution in the simulation of daily and subdaily precipitation in the southwestern US, J. Geophys. Res.-Atmos., 118, 7591–7605, doi:10.1002/jgrd.50590, 2013.
National Aeronautics and Space Administration: TRMM – GES DISC – Goddard Earth Sciences Data and Information Sciences Center, available at: https://disc.sci.gsfc.nasa.gov/TRMM, 2016. Vosper, S. B., Wells, H., and Brown, A. R.: Accounting for nonuni-form static stability in orographic drag parametrization, Q. J. Roy. Meteor. Soc., 135, 815–822, doi:10.1002/qj.407, 2009. Walters, D. N., Best, M. J., Bushell, A. C., Copsey, D., Edwards,
J. M., Falloon, P. D., Harris, C. M., Lock, A. P., Manners, J. C., Morcrette, C. J., Roberts, M. J., Stratton, R. A., Webster, S., Wilkinson, J. M., Willett, M. R., Boutle, I. A., Earnshaw, P. D., Hill, P. G., MacLachlan, C., Martin, G. M., Moufouma-Okia, W., Palmer, M. D., Petch, J. C., Rooney, G. G., Scaife, A. A., and Williams, K. D.: The Met Office Unified Model Global Atmo-sphere 3.0/3.1 and JULES Global Land 3.0/3.1 configurations, Geosci. Model Dev., 4, 919–941, doi:10.5194/gmd-4-919-2011, 2011.
Walters, D., Brooks, M., Boutle, I., Melvin, T., Stratton, R., Vosper, S., Wells, H., Williams, K., Wood, N., Allen, T., Bushell, A., Copsey, D., Earnshaw, P., Edwards, J., Gross, M., Hardiman, S., Harris, C., Heming, J., Klingaman, N., Levine, R., Manners, J., Martin, G., Milton, S., Mittermaier, M., Morcrette, C., Riddick, T., Roberts, M., Sanchez, C., Selwood, P., Stirling, A., Smith, C., Suri, D., Tennant, W., Vidale, P. L., Wilkinson, J., Willett, M., Woolnough, S., and Xavier, P.: The Met Office Unified Model Global Atmosphere 6.0/6.1 and JULES Global Land 6.0/6.1 configurations, Geosci. Model Dev. Discuss., doi:10.5194/gmd-2016-194, in review, 2016.
Wehner, M. F., Smith, R. L., Bala, G., and Duffy, P.: The effect of horizontal resolution on simulation of very extreme US pre-cipitation events in a global atmosphere model, Clim. Dyn., 34, 241–247, doi:10.1007/s00382-009-0656-y, 2010.
Westra, S., Fowler, H. J., Evans, J. P., Alexander, L. V., Berg, P., Johnson, F., Kendon, E. J., Lenderink, G., and Roberts, N. M.: Future changes to the intensity and frequency of short-duration extreme rainfall, Rev. Geophys., 52, 522–555, doi:10.1002/2014RG000464, 2014.
D. N., West, A., Woollings, T., and Xavier, P. K.: The Met Office Global Coupled model 2.0 (GC2) configuration, Geosci. Model Dev., 8, 1509–1524, doi:10.5194/gmd-8-1509-2015, 2015. Wood, N., Stainforth, A., White, A., Allen, T., Diamantakis, M.,
Gross, M., Melvin, T., Smith, C., Vosper, S., Zerroukat, M., and Thuburn, J.: An inherently mass-conserving implicit semi-Lagrangian discretisation of the deep-atmosphere global nonhy-drostatic equations, Q. J. Roy. Meteor. Soc., 140, 1505–1520, doi:10.1002/qj.2235, 2014.