Relation between Rice Crop Quality (Protein Content)
and Fertilizer Amount as Well as Rice Stump Density
Derived from Helicopter Data
Kohei Arai 1
Graduate School of Science and Engineering Saga University
Saga City, Japan
Masanoori Sakashita
1Information Science, Saga University Saga, Japan
Osamu Shigetomi
2Saga Prefectural Agricultural Research Institute Saga Prefectural Government, Japan
Yuko Miura
2Saga Prefectural Agricultural Research Institute Saga Prefectural Government, Japan
Abstract—Relation between protein content in rice crops and fertilizer amount as well as rice stump density is clarified with a multi-spectral camera data mounted on a radio-wave controlled helicopter. Estimation of protein content in rice crop and total nitrogen content in rice leaves through regression analysis with Normalized Difference Vegetation Index: NDVI derived from camera mounted radio-controlled helicopter is already proposed. Through experiments at rice paddy fields which is situated at Saga Prefectural Research Institute of Agriculture: SPRIA in Saga city, Japan, it is found that total nitrogen content in rice leaves is linearly proportional to fertilizer amount and NDVI. Also, it is found that protein content in rice crops is positively proportional to fertilizer amount for lower fertilizer amount while protein content in rice crop is negatively proportional to fertilizer amount for relatively high fertilizer amount.
Keywords—Rice Crop; Rice Leaf; Total nitrogen content; Protein content; NDVI; Fertilizer amount; Rice stump density
I. INTRODUCTION
Vitality monitoring of vegetation is attempted with photographic cameras [1]. Grow rate monitoring is also attempted with spectral reflectance measurements [2]. Bi-Directional Reflectance Distribution Function: BRDF is related to the grow rate for tealeaves [3]. Using such relation, sensor network system with visible and near infrared cameras is proposed [4]. It is applicable to estimate total nitrogen content and fiber content in the tealeaves in concern [5]. Therefore, damage grade can be estimated with the proposed system for rice paddy fields [6]. This method is validated with Monte Carlo simulation [7]. Also Fractal model is applied to representation of shapes of tealeaves [8]. Thus the tealeaves can be asse3ssed with parameters of the fractal model. Vitality of tea trees are assessed with visible and near infrared camera data [9]. Rice paddy field monitoring with radio-control helicopter mounting visible and NIR camera is proposed [10] while the method for rice quality evaluation through total nitrogen content in rice leaves is also proposed [10]. The method which allows evaluation of rice quality with protein
content in rice crop estimated with NDVI1 which is acquired with visible and NIR camera mounted on radio-control helicopter is also proposed [10]. The fact that protein content in rice crops is highly correlated with NDVI which is acquired with visible and Near Infrared: NIR camera mounted on radio-control helicopter is well reported [10]. It also is reported that total nitrogen content in rice leaves is correlated to NDVI as well.
Protein content in rice crop is negatively proportional to rice taste. Therefore, rice crop quality can be evaluated through NDVI observation of rice paddy field. Relation among total nitrogen content in rice leaves, amount of fertilizer amount, NDVI and protein content in rice crops as well as stump density has to be clarified in this paper.
The proposed method is described in the next section followed by experiments. The experimental results are validated in the following section followed by conclusion with some discussions.
II. PROPOSED METHOD FOR ESTIMATION OF PROTEIN
CONTENT IN RICE CROPS
A. Radio Controlled Helicopter Based Near Infrared Cameras Utilizing Agricultural Field Monitoring System The helicopter used for the proposed system is
“GrassHOPPER”2
manufactured by Information & Science Techno-Systems Co. Ltd. The major specification of the radio controlled helicopter used. Canon Powershot S10023 (focal length=24mmكis mounted on the GrassHOPPER. It allows acquire images with the following Instantaneous Field of
1
Normalized Difference Vegetation Index: NDVI is expressed with the following equation,
NDVI=(NIR-R)/(NIR+R)
where NIR, R denotes Near Infrared and Red wavelength region of reflectance
2
http://www.ists.co.jp/?page_id=892
View: IFOV at the certain altitudes, 1.1cm (Altitude=30mك 3.3cm (Altitude=100mكand 5.5cmقAltitude=150mك.
Spectral response functions of filters attached to the camera used are sensitive to Green, Red and Near Infrared bands.
In order to measure NIR reflectance, standard plaque whose reflectance is known is required. Spectralon4provided by Labsphere Co. Ltd. is well known as well qualified standard plaque. It is not so cheap that photo print papers are used for the proposed system. Therefore, comparative study is needed between Spectralon and the photo print papers.
The system consist Helicopter, NIR camera, photo print paper. Namely, photo print paper is put on the agricultural plantations, rice leaves in this case. Then farm areas are observed with helicopter mounted Visible and NIR camera. Total nitrogen content in rice leaves, protein content in rice crops can be estimated with the camera data based on the previously established regressive equation [12].
B. Rice Paddy Field at Saga Prefectural Agricultural Research Institute: SPARI
Specie of the rice crop is Hiyokumochi4 which is one of the late growing types of rice species. Hiyokumochi5 is one of low amylase (and amylopectin rich) of rice species (Rice No.216).
Paddy fields of the test site of rice paddy field at SPARI6 which is situated at 33°13'11.5" North, 130°18'39.6"East, and the elevation of 52 feet. The paddy field C4-2 is for the investigation of water supply condition on rice crop quality. There are 14 of the paddy field subsections of which water supply conditions are different each other.
There are two types of water supply scheduling, short term and standard term. Water supply is stopped in the early stage of rice crop growing period for the short term water supply subsection fields while water supply is continued comparatively longer time period comparing to the short term water supply subsection fields.
Meanwhile, there are three types of water supply conditions, rich, standard, and poor water supply subsection fields. On the other hand, test sites C4-3 and C4-4 are for investigation of total nitrogen of chemical fertilizer amount dependency on rice crop quality. There are two types of paddy subsections, densely and sparsely planted paddy fields. Hiyokumochi rice leaves are planted 15 to 20 fluxes per m2 on June 22 2012. Rice crop fields are divided into 10 different small fields depending on the amount of nutrition including total nitrogen ranges from zero to 19 kg/10 a/total nitrogen.
Total nitrogen of chemical fertilizer amount is used to put into paddy fields for five times during from June to August. Although rice crops in the 10 different small fields are same
4
http://www.labsphere.com/products/reflectance-standards-and-targets/reflectance-targets/spectralon-targets.aspx
5 http://ja.wikipedia.org/wiki/%E3%82%82%E3%81%A1%E7%B1%B3
6
http://www.pref.saga.lg.jp/web/shigoto/_1075/_32933/ns-nousisetu/nouse/n_seika_h23.html
species, the way for giving chemical fertilizer amount are different. Namely, the small field No.1 is defined as there is no chemical fertilizer amount at all for the field while 9, 11, and 13 kg/10a/ total nitrogen of after chemical fertilizer amount are given for No.2 to 4, respectively, no initial chemical fertilizer amount though. Meanwhile, 9, 11, 13 kg/10 a/total nitrogen are given as after chemical fertilizer amount for the small field No.5, 6, and 7, respectively in addition to the 3 kg/10 a/total nitrogen of initial chemical fertilizer amount. On the other hand, 12, 14, and 16 kg/10 a /total nitrogen are given for the small fields No.5, 6, 7, respectively as after chemical fertilizer amount in addition to the initial chemical fertilizer amount of 3 kg/ 10 a/ total nitrogen for the small field No. 15, 17, 19, respectively. Therefore, rice crop grow rate differs each other paddy fields depending on the amount of total nitrogen of chemical fertilizer amount.
III. EXPERIMENTS
A. Acquired Near Infrared Camera Imagery Data
Radio wave controlled helicopter mounted near infrared camera imagery data is acquired at C4-2, C4-3, C4-4 in SPARI on 18 and 22 August 2013 with the different viewing angle from the different altitudes. In the acquired camera images, there is Spectralon of standard plaque as a reference of the measured reflectance in between C4-3 and C4-4. Just before the data acquisition, some of rice crops and leaves are removed from the subsection of paddy fields for inspection of total nitrogen content in rice leaves. Using the removed rice leaves, total nitrogen content in rice leaves is measured based on the Keldar method and Dumas method7(a kind of chemical method) with Sumigraph NC-220F8 of instrument. The measured total nitrogen content in rice leaves and protein content in rice crops are compared to the NDVI.
The camera images are acquired on 18 August and 22 August. Meanwhile, these images have influences due to shadow and shade of rice leaves and water situated under the rice leaves as well as narrow roads between rice paddy fields. In order to eliminate the influences, thresholding process is applied to the acquired images.
Measured total nitrogen contents in rice leaves of rice paddy fields of partitioned A1 to A8 and B1 to B8 on 14 and 22 August 2013 are shown in Table 1 and 2, respectively.
Before estimation of total nitrogen content in rice leaves, geometric correction is applied to the acquired camera image after extraction of intensive study areas. Also it is found that total nitrogen of chemical fertilizer amount; water management as well as plant density is different from each other partitioned rice paddy fields as aforementioned.
B. Total nitrogen Content in Rice Leaves
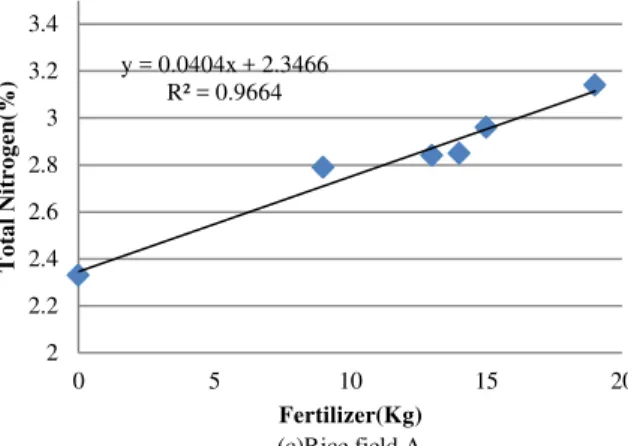
Total nitrogen content in the rice leaves seem to reflect the fact of chemical fertilizer amount of total nitrogen, water supply management, and plantation density, obviously. Fig.1 shows the relation between fertilizer amount and total nitrogen content in the rice leaves.
7
http://note.chiebukuro.yahoo.co.jp/detail/n92075
8
TABLE I. MEASURED TOTAL NITROGEN CONTENT IN RICE LEAVES ON
14AUGUST 2013
Farm Area Total nitrogen (%)
A1 2.61
A3 2.85
A5 2.84
A8 2.77
B1 2.82
B3 2.74
B5 3.16
B8 2.78
TABLE II. MEASURED TOTAL NITROGEN CONTENT IN RICE LEAVES ON
22AUGUST 2013
Farm Area Total nitrogen (%)
A1 2.46
A2 2.88
A4 2.97
A5 2.89
A6 2.67
A8 3.22
B1 2.33
B2 2.79
B4 2.84
B5 2.85
B6 2.96
B8 3.14
(a)Overall
(b)Rice field A
(c)Rice field A
Fig. 1. Relation between fertilizer amount and total nitrogen content in the
rice leaves
The chemical fertilizer amount is put into paddy fields four times. Fertilizer amount denotes total chemical fertilizer amount. Fig.1 (a) shows overall relation between fertilizer amount and total nitrogen content in the rice leaves while Fig.1 (b) and (c) shows the relation for measured total nitrogen content in rice leaves on August 18 and August 22, respectively. Rice crops are harvested in the begging of October. Therefore, rice crops and rice leaves are grown up a little bit for four days. These figures show the proportional relation between both. The regressive equations for rice paddy field A is expressed in equation (1) while that for rice paddy field B is represented in equation (2), respectively.
y = 0.032x + 2.4717 (1)
R² = 0.6535
y = 0.0404x + 2.3466 (2)
R² = 0.9664
These regressive coefficients are very similar (the difference of proportional coefficients for both rice paddy fields is just 20.79 % while that of bias coefficients is 5.06 %). Therefore, the relationship between fertilizer amount and total nitrogen content in the rice leaves is clarified. In total, regressive equation between fertilizer amount and total nitrogen content in rice leaves is expressed with equation (3)
y = 0.0223x + 2.5733 (3)
R² = 0.4659
R square value (determination value9) is around 0.5. This implies that the fertilizer amount is proportional to the total nitrogen in rice leaves.
C. NDVI and Protein Content in Rice Crops
Meanwhile, protein content in rice crops shows different relation against the relation between total nitrogen in rice leaves and fertilizer amount. Namely, there is proportional relation between protein content in rice crops and fertilizer amount ranged from zero to 12 Kg while there is negatively proportional relation between both for the fertilizer amount ranged from 12 to 16 Kg. Rice taste depends on protein content in the rice crops. Namely, protein rich rice crops taste
9
where y, f, and m denotes observed value, predicted value and mean value, respectively.
y = 0.0223x + 2.5733 R² = 0.4659
2 2.2 2.4 2.6 2.8 3 3.2 3.4
0 5 10 15 20
T
o
ta
l
N
it
r
o
g
e
n
(%
)
Fertilizer(Kg)
y = 0.032x + 2.4717 R² = 0.6535
2 2.2 2.4 2.6 2.8 3 3.2 3.4
0 5 10 15 20
T
o
ta
l
N
it
r
o
g
e
n
(%
)
Fertilizer(Kg)
y = 0.0404x + 2.3466 R² = 0.9664
2 2.2 2.4 2.6 2.8 3 3.2 3.4
0 5 10 15 20
T
o
ta
l
N
it
r
o
g
e
n
(%
)
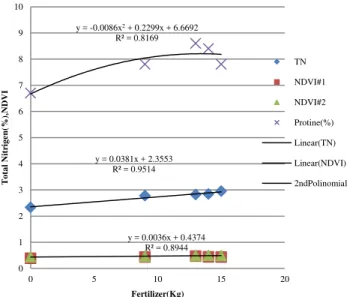
bad. Therefore, in accordance with increasing of fertilizer amount, total nitrogen content in rice leaves and NDVI of rice leaves are increased while protein content in rice crops is decreased as shown in Fig.2.
Fig. 2. Relation among fertilizer amount, total nitrogen content in rice leaves
and NDVI of rice leaves as well as protein content in rice crops
Through the regressive analysis, it is found that there is proportional relation between fertilizer amount and NDVI with the following regressive equation,
y = 0.0036x + 0.4374 (4)
R² = 0.8944
Meanwhile, there must is the proportional relation between fertilizer content and total nitrogen content in rice leaves as shown in equation (5).
y = 0.0381x + 2.3553 (5)
R² = 0.9514
On the other hand, it seems that the relation between fertilizer amount and protein content in rice crop is different from the above relations. It is most likely the second order polynomial relation of equation (6) rather than proportional relation.
y = -0.0086x2 + 0.2299x + 6.6692 (6) R² = 0.8169
The determination index (R square value) is greater than 0.8. Therefore, it may say that there is saturation level of fertilizer amount. One of the reasons for this is due to the fact that the relation between NDVI and total nitrogen content in rice leaves differ from the relation between NDVI and protein content in rice crops as shown in Fig.6 (An Example).
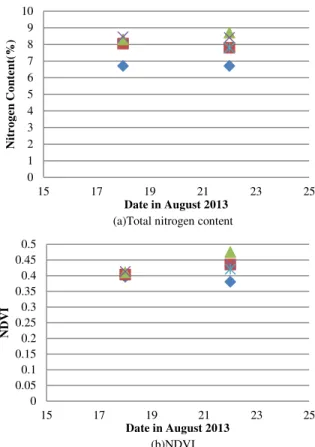
On the other hand, remote controlled helicopter mounted visible and near infrared camera data are acquired on 18 and 22 August, total nitrogen content in rice leaves is measured on August 22 only though. Therefore, August 22 data show much reliable than August 18 data. For four days, rice leaves and rice crops are grown a little bit as shown in Fig.4.
(a)Relation between protein content in rice crops and NDVI
(b)Relation between total nitrogen content in rice leaves and NDVI
Fig. 3. Different relations between NDVI and total nitrogen content in rice
leaves as well as protein content in rice crops
Fig. 4. Difference between August 18 and 22 data derived total nitrogen
content and NDVI of rice leaves
D. Four Day Changes of NDVI and Protein Content in Rice Crops
NDVI and Total nitrogen content in rice leaves which are measured on 18 and 22 August are shown in Fig.5 (a) and (b), respectively. Both are increased a little bit. Also, the variances of these NDVI and total nitrogen content in rice leaves are increased, in particular, for NDVI.
y = 0.0381x + 2.3553 R² = 0.9514
y = 0.0036x + 0.4374 R² = 0.8944 y = -0.0086x2 + 0.2299x + 6.6692
R² = 0.8169
0 1 2 3 4 5 6 7 8 9 10
0 5 10 15 20
T
ot
al
Nit
rigen(
%
),
ND
VI
Fertilizer(Kg)
TN
NDVI#1
NDVI#2
Protine(%)
Linear(TN)
Linear(NDVI)
2ndPolinomial
y = 0.1242x + 6.7574 R² = 0.9786
y = 0.0012x + 0.3951 R² = 0.942 y = 0.1062x + 6.7964
R² = 0.7248
y = 0.004x + 0.3883 R² = 0.5129
0 1 2 3 4 5 6 7 8 9 10
0 5 10 15 20
ND
VI
,
Nit
roge
n
Cont
en
t(
%
)
Fertilizer(Kg)
18P
18N
22P
22N
Linear18P
Linear18N
Linear18P
(a)Total nitrogen content
(b)NDVI
Fig. 5. NDVI and Total nitrogen content in rice leaves which are measured
on 18 and 22 August
E. Rice Stump Density
On the other hand, there are two rice stump densities, 15.15 and 21.21 stumps/ m2 in the rice paddy fields A and B. NDVI, total nitrogen content in rice leaves and protein content in rice crops for each rice stump density are shown in Fig.6 (a), (b) and (c), respectively. NDVI and total nitrogen content in rice leaves are decreased in accordance with increasing of the density while protein content in rice crops is decreased with increasing of the density. This implies that rice crop quality of relatively high density of rice stump is better than that of poorly dense rice paddy field.
(a)NDVI
(b)Total nitrogen content
(c)Protein content
Fig. 6. NDVI, total nitrogen content in rice leaves and protein content in rice
crops for each rice stump density
IV. CONCLUSION
Estimation of protein content in rice crop and total nitrogen content in rice leaves through regression analysis with Normalized Difference Vegetation Index: NDVI derived from camera mounted radio-control helicopter is proposed. Through experiments at rice paddy fields which is situated at Saga Prefectural Research Institute of Agriculture: SPRIA in Saga city, Japan, it is found that protein content in rice crops is highly correlated with NDVI which is acquired with visible and Near Infrared: NIR camera mounted on radio-control helicopter. It also is found that total nitrogen content in rice leaves is highly correlated to NDVI as well.
Protein content in rice crop is negatively proportional to rice taste. Therefore rice crop quality can be evaluated through NDVI observation of rice paddy field. It is found that total nitrogen content in rice leaves is linearly proportional to fertilizer amount and NDVI. Also, it is found that protein content in rice crops is positively proportional to fertilizer amount for lower fertilizer amount while protein content in rice crop is negatively proportional to fertilizer amount for relatively high fertilizer amount.It is also found that rice crop quality of low density of rice stump is better than that of highly dense rice paddy field.
0 1 2 3 4 5 6 7 8 9 10
15 17 19 21 23 25
N
it
r
o
g
e
n
C
o
n
te
n
t(
%
)
Date in August 2013
0 0.05 0.1 0.15 0.2 0.25 0.3 0.35 0.4 0.45 0.5
15 17 19 21 23 25
NDVI
Date in August 2013
0.35 0.37 0.39 0.41 0.43 0.45 0.47 0.49
10 15 20 25
NDVI
Density(1/m^2)
2 2.2 2.4 2.6 2.8 3 3.2 3.4
10 15 20 25
N
it
r
o
g
e
n
c
o
n
te
n
t(
%
)
Density(1/m^2)
2 2.2 2.4 2.6 2.8 3 3.2 3.4
10 15 20 25
Pr
o
te
in
c
o
n
te
n
t(
%
)
REFERENCES
[1] Wiegand, C., Shibayama,M, Yamagata,Y, Akiyama, T., 1989.
Spectral Observations for Estimating the Growth and Yield of Rice, Journal of Crop Science, 58, 4, 673-683, 1989.
[2] Kohei Arai, Method for estimation of grow index of tealeaves based on
Bi-Directional reflectance function:BRDF measurements with ground based netwrok cameras, International Journal of Applied Science, 2, 2, 52-62, 2011.
[3] Kohei Arai, Wireless sensor network for tea estate monitoring in
complementally usage with Earth observation satellite imagery data based on Geographic Information System(GIS), International Journal of Ubiquitous Computing, 1, 2, 12-21, 2011.
[4] Kohei Arai, Method for estimation of total total nitrogen and fiber
contents in tealeaves with grond based network cameras, International Journal of Applied Science, 2, 2, 21-30, 2011.
[5] Kohei Arai, Method for estimation of damage grade and damaged paddy
field areas sue to salt containing sea breeze with typhoon using remote sensing imagery data, International Journal of Applied Science,2,3,84-92, 2011.
[6] Kohei Arai, Monte Carlo ray tracing simulation for bi-directional
reflectance distribution function and grow index of tealeaves estimation, International Journal of Research and Reviews on Computer Science, 2, 6, 1313-1318, 2011.
[7] Kohei.Arai, Fractal model based tea tree and tealeaves model for
estimation of well opened tealeaf ratio which is useful to determine tealeaf harvesting timing, International Journal of Research and Review on Computer Science, 3, 3, 1628-1632, 2012.
[8] Kohei.Arai, H.Miyazaki, M.Akaishi, Determination of harvesting timing
of tealeaves with visible and near infrared cameradata and its application
to tea tree vitality assessment, Journal of Japanese Society of Photogrammetry and Remote Sensing, 51, 1, 38-45, 2012
[9] Kohei Arai, Osamu Shigetomi, Yuko Miura, Hideaki Munemoto, Rice
crop field monitoring system with radio controlled helicopter based near infrared cameras through total nitrogen content estimation and its distribution monitoring, International Journal of Advanced Research in Artificial Intelligence, 2, 3, 26-37, 2013.
[10] Kohei Arai, Masanori Sakashita, Osamu Shigetomi, Yuko Miura,
Estimation of Protein Content in Rice Crop and Total nitrogen Content in Rice Leaves Through Regression Analysis with NDVI Derived from Camera Mounted Radio-Control Helicopter, International Journal of Advanced Research in Artificial Intelligence, 3, 3, 13-19, 2013
AUTHORS PROFILE
Kohei Arai He received BS, MS and PhD degrees in 1972, 1974 and 1982, respectively. He was with The Institute for Industrial Science and Technology of the University of Tokyo from April 1974 to December 1978 and also was with National Space Development Agency of Japan from January, 1979 to March, 1990. During from 1985 to 1987, he was with Canada Centre for Remote Sensing as a Post-Doctoral Fellow of National Science and Engineering Research Council of Canada. He moved to Saga University as a Professor in Department of Information Science on April 1990. He was a councilor for the Aeronautics and Space related to the Technology Committee of the Ministry of Science and Technology during from 1998 to 2000. He was a councilor of Saga University for 2002 and 2003. He also was an executive councilor for the Remote Sensing Society of Japan for 2003 to 2005. He is an Adjunct Professor of University of Arizona, USA since 1998. He also is Vice Chairman of the Commission-A of ICSU/COSPAR since 2008. He is the Edito-in-Chief of IJACSA and IJISA. He wrote 33 books and