Protein profile of rice (
Oryza sativa
) seeds
Yanhua Yang#, Li Dai#,Hengchuan Xia, Keming Zhu, Haijun Liu and Keping Chen
Institute of Life Sciences, Jiangsu University, Zhenjiang, PR China.
Abstract
Seeds are the most important plant storage organ and play a central role in the life cycle of plants. Since little is known about the protein composition of rice (Oryza sativa) seeds, in this work we used proteomic methods to obtain a reference map of rice seed proteins and identify important molecules. Overall, 480 reproducible protein spots were detected by two-dimensional electrophoresis on pH 4-7 gels and 302 proteins were identified by MALDI-TOF MS and database searches. Together, these proteins represented 252 gene products and were classified into 12 functional categories, most of which were involved in metabolic pathways. Database searches combined with hydropathy plots and gene ontology analysis showed that most rice seed proteins were hydrophilic and were related to binding, cata-lytic, cellular or metabolic processes. These results expand our knowledge of the rice proteome and improve our un-derstanding of the cellular biology of rice seeds.
Keywords: mass spectrometry, proteomic analysis, rice seed, two-dimensional electrophoresis.
Received: July 6, 2012; Accepted: October 23, 2012.
Introduction
Rice (Oryza sativa L.) is the main food source for more than two-third of the world’s population (Sasaki and Burr, 2000), especially in Southeast Asia (Nwugo and Huerta, 2011; Wanget al., 2011). With the completion of the rice genome sequencing program, rice has become the model organism in molecular biological research of mono-cotyledons (Agrawal and Rakwal, 2011; Liet al., 2011). The International Rice Genome Sequencing Project (IRGSP) has generated high-quality sequences that cover 95% of the 389 Mb rice genome and has produced a genomic map for this species (Liu and Xue, 2006).
In recent years, many studies have investigated the functional genomics of rice. Traditional functional geno-mics have investigated mainly the changes in mRNA abun-dance in histiocytes. However, because of transcriptional regulation, mRNA levels do not provide a true indication of protein expression levels (Jugranet al., 2010; Dinget al., 2012). On the other hand, some proteins undergo complex post-translational modifications such that changes in the level of active protein may be more significant than those in the total protein content. Proteomic analysis was first de-scribed by Wilkins and Williams (1994) and seeks to study all proteins expressed in a cell, tissue or organism at a spe-cific time or under spespe-cific circumstances by maximizing protein separation and identification (Wilkinset al., 1998).
Two-dimensional electrophoresis (2-DE) combined with mass spectrometry (MS) are still the core tools for identify-ing differentially expressed proteins in proteomics (Yanget al., 2006, 2007a,b; Chitteti and Peng, 2007; Torabiet al., 2009; Chiet al., 2010; Ahrnéet al., 2011; Fanet al., 2011; Heet al., 2011; Nwugo and Huerta, 2011; Dinget al., 2012; Kalli and Hess, 2012).
Seeds are important plant storage organs that play a central role in the life cycle of plants because they are essen-tial for plant reproduction and the iniessen-tial stages of offspring formation (Yanget al., 2009). Seed biology is a major sub-ject in plant research, although most studies have focused on seed dormancy and germination mechanisms (Koornneefet al., 2002; Finch-Savage and Leubner-Metzger, 2006; Yang et al., 2007b; Vaughanet al., 2008; Heet al., 2011), with lit-tle being known about seed protein composition. Since pro-teomics is a well-established means of assessing global changes in protein profiles (Agrawalet al., 2006; Agrawal and Rakwal, 2011; Fanet al., 2011), in this study we used 2-DE and MALDI-TOF-MS to examine the proteomic pro-file of rice seeds. Our specific goals were (1) to determine the proteomic profile of rice seeds, (2) to identify the main pro-tein components involved and (3) to understand the func-tional characteristics of the identified proteins.
Materials and Methods
Seeds
Seeds of the Nipponbare strain of rice (O. sativa L. spp.japonica, cv. Nipponbare, AA genome) were used in this work.
Genetics and Molecular Biology, 36, 1, 87-92 (2013)
Copyright © 2013, Sociedade Brasileira de Genética. Printed in Brazil www.sbg.org.br
Send correspondence to Keping Chen. Institute of Life Sciences, Jiangsu University, 301 Xuefu Road, Zhenjiang, Jiangsu Province 212013, PR China. E-mail: [email protected].
#
These authors contributed equally to this work.
Protein extraction
The rice seeds were peeled and washed three times using purified water, after which proteins were extracted using a modified version of the protocol described by Shen et al.(2003). Seeds (2 g samples) were homogenized in pre-cooled extraction buffer (20 mM Tris-HCl, pH 7.5, 250 mM sucrose, 10 mM EGTA, 1 mM PMSF, 1 mM DTT and 1% Triton X-100) on ice. The homogenate was trans-ferred to a 2 mL centrifuge tube and centrifuged (15,000g, 4 °C, 20 min). The supernatant was collected and proteins were precipitated for 30 min in an ice bath by adding 50% cold trichloroacetic acid (TCA) until the final concentra-tion of TCA was 10% (Yanget al., 2006). The supernatant was discarded after centrifugation (15,000g, 4 °C, 20 min) and the pellet was then washed four times using cold ace-tone containing 13 mM DTT. After further centrifugation (15,000g, 4 °C, 20 min), the pellet was vacuum-dried. The dried powder was dissolved in sample buffer (7 M urea, 2 M thiourea, 4% Chaps, 2% Bio-Lyte pH 3-10, 1 mM PMSF and 1% DTT; 1 mg dried powder/0.1 mL of buffer) at 4 °C overnight. Following a final centrifugation (15,000 g, 4 °C, 20 min), the supernatant was used for 2-DE. Protein concentrations were determined by a dye-binding method (Bradford, 1976). Since some of the com-ponents of the sample buffer interfered with the Bradford assay an equal volume of sample buffer was added to the protein reagent to compensate for this interference. Bovine serum albumin was used as the standard.
Two-dimensional electrophoresis
Isoelectric focusing (IEF) was done using a Bio-Rad PROTEAN electrophoresis system and 17 cm immobilized IPG dry gel strips with a linear pH range (pH 4-7) (Bio-Rad, USA). Protein samples (~1.5 mg) were loaded during the rehydration step (passive rehydration, room tempera-ture, 12-13 h) and IEF was done at 300, 500 and 1000 V for 1 h, with linear ramping to 8000 V over 2 h and holding at 8000 V until a total voltage of 50 kVh was achieved. Subse-quently, the strips were equilibrated for 15 min with buffer I (6 M urea, 50 mM Tris-HCl, pH 6.8, 30% v/v glycerol, 2.5% SDS, 1% w/v DTT) and then for 15 min with buffer II (6 M urea, 50 mM Tris-HCl, pH 6.8, 30% v/v glycerol, 2.5% SDS, 2.5% w/v iodoacetamide). After equilibration, the second dimension SDS-PAGE was done using 12% polyacrylamide gels. Proteins were detected by staining the gels with 0.116% Coomassie brilliant blue R-250.
Image and data analysis
The 2-DE gels were scanned (resolution: 300 dpi) with an ImageScanner III scanner (GE Healthcare BIO-Science) and the gel images were analyzed with PDQuest software (Bio-Rad, USA). Each protein spot in the 2-DE map was assigned a number.
In-gel digestion and MALDI-TOF MS analysis
Protein spots were excised manually from the Coo-massie blue-stained gels and each gel fragment was
im-mersed in purified water and sonicated twice (10 min each). Subsequently, the gel pieces were destained with 50 mM ammonium bicarbonate and an equivalent volume of 50% acetonitrile, followed by sequential washing with 25 mM ammonium bicarbonate, 50% acetonitrile and 100% ace-tonitrile, respectively. After lyophilization, the gel frag-ments were rehydrated in digestion buffer (2 mL) containing 25 mM NH4HCO3 and 10 ng of trypsin/mL
(Promega, Madison, WI, USA) at 4 °C. After 30 min, 10-15mL of 25 mM NH4HCO3was added and digestion
was continued at 37 °C overnight (11-16 h). After diges-tion, the peptide solution was collected and tryptic peptide masses were determined using a MALDI-TOF mass spec-trometer (Ultraflex-TOF-TOF, Bruker, Germany).
Database search and protein identification
All of the acquired peptide mass fingerprint data were used in online searches with the Mascot program through Biotechnology Information nonredundant database. The search parameters included trypsin as the selected enzyme (one missed cleavage was permitted), carbamidomethyl as the fixed modification, Gln- > pyro-Glu (N-terminal Q) as the variable modification and a peptide tolerance of ±0.2 Da.O. sativawas selected as the taxonomic category. Proteins with a MOWSE score > 64 were considered as positive identifications.
Bioinformatics analysis of the identified proteins
The hydropathy of all proteins identified with a high level of confidence (MOWSE scores > 64) and the grand average of hydropathicity (GRAVY) for all the proteins were calculated as described by Kyte and Doolittle (1982), using the Protparam tool from the ExPASy site. The result-ing grand average hydropathy values were then analyzed with Origin 7.0 software.
The Gene Ontology (GO) identity of each of the iden-tified proteins was obtained by InterProscan searching. The GO classification of these proteins was obtained using the WEGO platform and the annotated data of the identified proteins.
Results
Proteomic profile of rice seeds
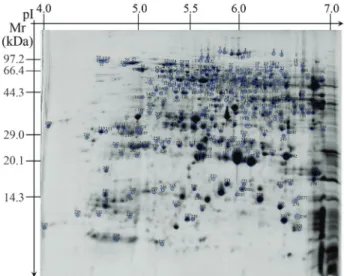
The analysis of 2-DE gels with PDQuest software de-tected 480 reproducible protein spots, most of which were distributed near the center of the gels (Figure 1). For exam-ple, the pI of 415 protein spots was between 5 and 7 and ac-counted for 84.5% of the total number of protein spots. In addition, the molecular mass of ~90% of the proteins was between 15 kDa and 95 kDa.
Protein identification by MALDI-TOF MS
A comprehensive knowledge of rice seed proteins will greatly enhance our understanding and exploration of
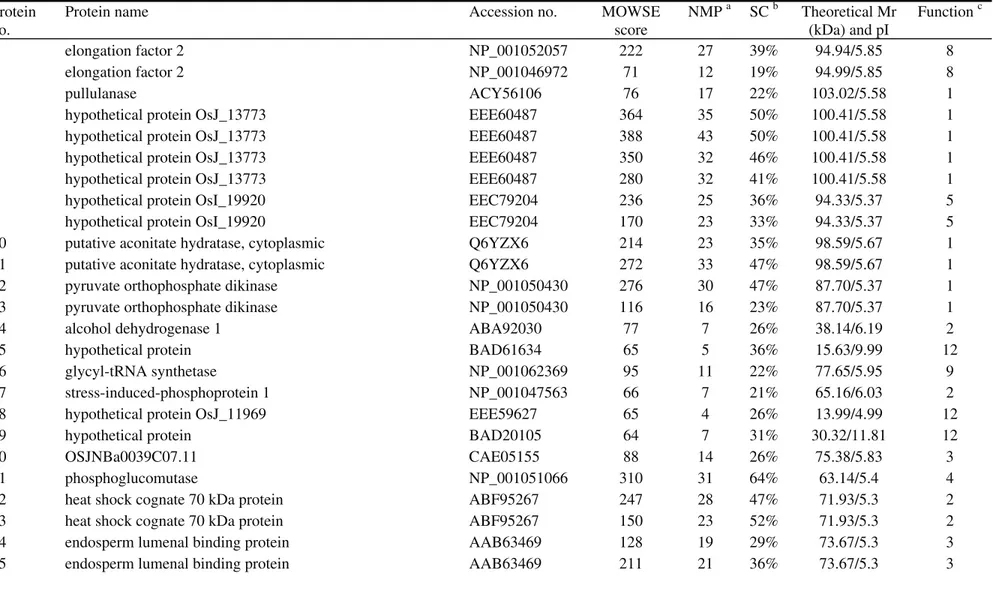
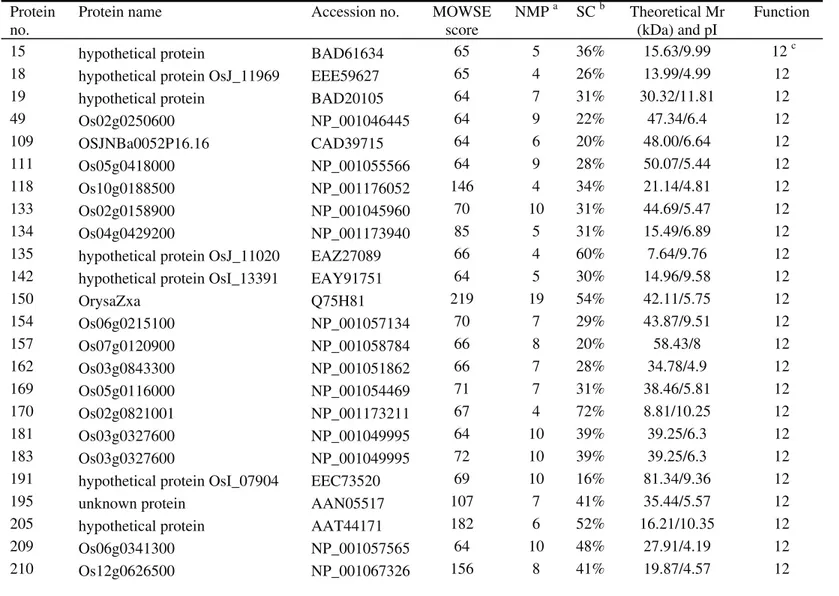
the functional characteristics of these seeds. The 480 repro-ducible proteins were screened by MALDI-TOF-MS to ob-tain peptide mass fingerprint data. Only 302 proteins (Fig-ure 2) with high confidence levels (MOWSE scores > 64) were identified (Table S1 - Supplementary Material), of which 52 were unidentified proteins of unknown functions (Figure 3; Table S2 - Supplementary Material). In some cases, different spots contained the same protein (Ta-ble S1),e.g., spots 4, 5, 6 and 7 corresponded to hypotheti-cal protein OsJ_13773, and spots 10 and 11 were putative aconitate hydratase.
Classification of protein functions
The 302 identified proteins represented the products of 252 different genes and were classified into 12 catego-ries based on their functions (Figure 4) (Bevanet al., 1998).
Protein functions were retrieved online as Gene Ontology information. The 12 categories were: Metabolism (1), Dis-ease/defense (2), Cell structure (3), Energy (4), Signal
transduction (5), Protein destination and storage (6), Cell growth/division (7), Protein synthesis (8), Transcription (9), Transporters (10), Intracellular traffic (11) and Un-known protein (12). The functional categories were deter-mined according to Bevanet al.(1998). As shown in Figure 4, 75 spots were involved in metabolic processes and were the most abundant category (24.8%). Proteins related to disease/defense were the second most abundant category (16.9%) and unknown proteins were the third most abun-dant (16.2%).
Bioinformatics analysis of identified proteins
Proteins with negative GRAVY scores were philic and those with positive GRAVY scores were hydro-phobic. Figure 5 shows that identified proteins with nega-tive GRAVY scores were significantly more abundant than those with positive GRAVY scores. The GRAVY values of most proteins were between -0.6 and 0, indicating that most of them were hydrophilic.
Protein profile of rice seeds 89
Figure 1- Proteome profile of rice seeds.
Figure 2- The protein spots identified by MALDI-TOF-MS. Each protein with a high confidence level (MOWSE score > 64) was assigned a num-ber.
Figure 3- The unknown proteins identified by MALDI-TOF-MS.
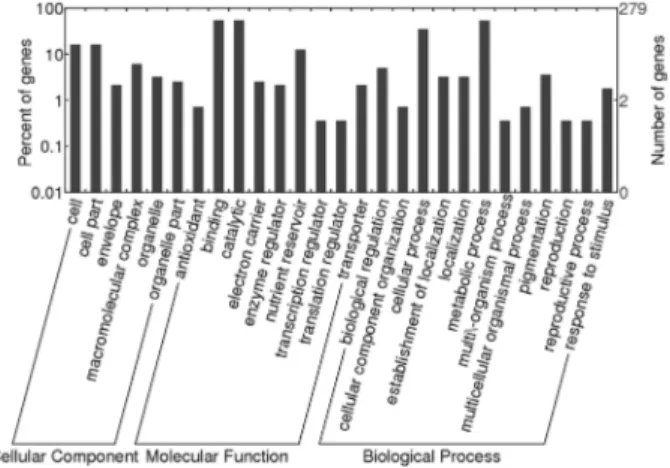
Figure 6 shows the GO analysis of the identified pro-teins, all of which were classified in terms of cellular com-ponent, molecular function, and physiological and biologi-cal processes using appropriate software (Gene Ontology Annotation Plot, WEGO). Most of the identified proteins associated with cellular components were involved in cell, cell parts, envelope, macromolecular complex, organelle and organelle parts, while those associated with molecular functions were involved in antioxidant, binding, catalytic, electron carrier, enzyme regulator, nutrient reservoir, tran-scription regulator and transporter activities. Biological processes involved biological regulation, cellular compo-nent organization, cellular process, establishment of local-ization, locallocal-ization, metabolic process, multi/-organism process, multicellular organismal process, pigmentation, reproduction, reproductive process and response to stimu-lus.
Discussion
Proteomic technologies are the most widely applied approach for identifying proteins in rice (Yanget al., 2006, 2007a,b; Chitteti and Peng, 2007; Torabiet al., 2009; Chiet al., 2010; Fan et al., 2011; Heet al., 2011; Nwugo and Huerta, 2011; Ding et al., 2012). In this study, we used 2-DE combined with MALDI-TOF-MS to obtain a 2-DE proteomic profile of rice seeds. A total of 480 reproducible
protein spots were selected for MALDI-TOF-MS analysis. However, only 302 proteins with a MOWSE score > 64 were identified as proteins (see Tables S1 and S2); there were no significant matches for the other 178 protein spots. There are at least two possible explanations for this phe-nomenon. First, some protein spots with low confidence levels possibly contained more than one protein. Second, some small protein spots could not be identified by MALDI-TOF-MS or were not included in the databases be-cause of a lack of information in the rice database (Wooet al., 2002).
The majority of corn proteins can be divided into three categories: storage proteins, structure- or metabo-lism-related proteins, and protective proteins (Shewry and Halford, 2002). As shown in Figure 4, 24.8% of the identi-fied proteins were classiidenti-fied in the metabolism group, 16.9% were involved in disease/defense and 15.6% were cell structure proteins. Furthermore, 10.3% of the identified proteins were classified in the energy group. Together, the proteins in these groups accounted for > 67% of the identi-fied proteins. Metabolism is essential for many activities and, not surprisingly, metabolism-related proteins have an important role in maintaining seed vigor. In addition, most metabolism- and energy-related proteins are associated with carbohydrate metabolic pathways (Heet al., 2011), in-cluding glycolysis and the TCA cycle. In this study, many enzymes involved in glycolysis were identified, including pyruvate orthophosphate dikinase (spots 12 and 13), phos-phoglucomutase (spot 21), pyrophosphate-fructose-6-phosphate 1-phosphotransferase (spot 51), pyrophospha-te-fructose-6-phosphate 2-phosphotransferase (spot 52), UTP-glucose-1-phosphate uridylyltransferase (spots 56 and 97), fructose bisphosphate aldolase (spot 58), glucose-6-phosphate isomerase (spots 60 and 77), enolase (spots 94 and 95), glyceraldehyde 3-phosphate dehydrogenase (spots 143 and 145), glucose-6-phosphate 1-epimerase (spot 161) and triosephosphate isomerase (spots 250, 254, 256 and 257). Some enzymes involved in the TCA cycle were also identified, such as aconitate hydratase (spots 10 and 11), succinate dehydrogenase (spot 35), isocitrate dehydroge-nase (spot 121), succinyl-CoA synthetase (spot 160) and malate dehydrogenase (spots 167, 168 and 173). Similarly, two enzymes involved in the alcoholic fermentation path-way were also identified, namely, alcohol dehydrogenase (spot 34) and pyruvate decarboxylase (spot 45). These re-sults indicate that aerobic and anaerobic respiration occurs in storage rice seeds. The energy demand is met primarily by glycolysis and the TCA cycle, although anaerobic fer-mentation can also provide energy in the absence of oxy-gen.
We also identified 12 proteins related to amino acid metabolism: five of these have a central role in amino acid metabolism (spots 106, 148, 153, 155 and 156), four are in-volved in the metabolism of branched chain amino acids (spots 38, 40, 53 and 141) and the remaining three are
in-90 Yanget al.
Figure 5- Hydropathic analysis of all proteins identified by 2-DE. Nega-tive and posiNega-tive GRAVY values indicate hydrophilic and hydrophobic proteins, respectively.
volved in arginine metabolism (spots 105, 107 and 108). Compared with germinating rice seeds, there were fewer proteins associated with amino acid metabolism in storage rice seeds. There are several explanations for this phenome-non. First, dry seeds are used mainly for storage and trans-port, and a lower metabolic activity favors the preservation of rice seeds. Second, the moisture content of storage seeds is very low, with the existing metabolism providing only essential energy and many physiological and biochemical reactions are inactive. Third, staining with Coomassie bril-liant blue may not be sufficiently sensitive to detect some spots so that more sensitive staining methods such as nega-tive staining and fluorescence staining should be used in fu-ture studies. Finally, some strongly basic proteins or proteins with extreme molecular masses may be missed in the 2-DE gels. The presence of the same protein in different spots suggests variations in post-translational modifica-tions or the presence of protein subunits, as also suggested by others (Yang et al., 2006; Chi et al., 2010; Liu and Bennett, 2011).
The hydropathy analysis showed that most of the rice seed proteins were hydrophilic. Rice seeds contain many proteins and enzymes related to metabolism and dis-ease/defense, and these proteins may only be active in physiological processes when in solution,i.e., in a soluble state. The presence of soluble proteins is a further charac-teristic of rice seed proteins.
In a proteomic survey of metabolic pathways in rice, Kolleret al.(2002) identified 2,528 unique proteins, 877 of which were from seeds. Of the 2,528 proteins detected, 189 were expressed in rice leaves, roots and seeds. In addition, there were 512 seed-specific proteins. Kolleret al.(2002) collected their seed samples from the entire panicle at 14 days postanthesis. In contrast, we used seed samples from mature rice seeds and identified 302 proteins that repre-sented 252 gene products. Our findings therefore expand the results of previous studies.
Conclusion
Seeds are a major food source for humans and are es-sential for plant reproduction. In this study, we identified 302 proteins in the proteome of rice seeds. These proteins represented 252 gene products and were classified into 12 functional categories. The 302 proteins identified here rep-resent an important contribution to the rice proteome data-base and shed light on the protein content of rice seeds.
Acknowledgments
This work was supported by the Ministry of Agricul-ture Transgenic Major Project (grant 2009ZX08012-018B), National Natural Science Foundation of China (grant 31201189), the Scientific Research Promotion Fund for the Talents of Jiangsu University (grant 11JDG049) and
Postdoctoral Fund of Department of Personnel of Jiangsu Province (grant 1102010C).
References
Agrawal GK and Rakwal R (2011) Rice proteomics: A move to-ward expanded proteome coverage to comparative and func-tional proteomics uncovers the mysteries of rice and plant biology. Proteomics 11:1630-1649.
Agrawal GK, Jwa NS, Iwahashi Y, Yonekura M, Iwahashi H and Rakwal R (2006) Rejuvenating rice proteomics: Facts, chal-lenges, and visions. Proteomics 6:5549-5576.
Ahrné E, Ohta Y, Nikitin F, Scherl A, Lisacek F and Müller M (2011) An improved method for the construction of decoy peptide MS/MS spectra suitable for the accurate estimation of false discovery rates. Proteomics 11:4085-4095. Bevan M, Bancroft I, Bent E, Love K, Goodman H, Dean C,
Bergkamp R, Dirkse W, Van Staveren M, Stiekema W,et al.
(1998) Analysis of 1.9 Mb of contiguous sequence from chromosome 4 of Arabidopsis thaliana. Nature 391:485-488.
Bradford MM (1976) A rapid and sensitive method for the quanti-tation of microgram quantities of protein utilizing the princi-ple of protein-dye binding. Anal Biochem 72:248-254. Chi F, Yang P, Han F, Jing Y and Shen S (2010) Proteomic
analy-sis of rice seedlings infected by Sinorhizobium meliloti
1021. Proteomics 10:1861-1874.
Chitteti BR and Peng Z (2007) Proteome and phosphoproteome differential expression under salinity stress in rice (Oryza sativa) roots. J Proteome Res 6:1718-1727.
Ding C, You J, Wang S, Liu Z, Li G, Wang Q and Ding Y (2012) A proteomic approach to analyze nitrogen- and cytokinin-responsive proteins in rice roots. Mol Biol Rep 39:1617-1626.
Fan W, Cui W, Li X, Chen S, Liu G and Shen S (2011) Proteomics analysis of rice seedling responses to ovine saliva. J Plant Physiol 168:500-509.
Finch-Savage WE and Leubner-Metzger G (2006) Seed dor-mancy and the control of germination. New Phytol 171:501-523.
He D, Han C, Yao J, Shen S and Yang P (2011) Constructing the metabolic and regulatory pathways in germinating rice seeds through proteomic approach. Proteomics 11:2693-2713. Jugran A, Bhatt ID and Rawal RS (2010) Characterization of
agro-diversity by seed storage protein electrophoresis: Fo-cus on rice germplasm from Uttarakhand Himalaya, India. Rice Sci 17:122-128.
Kalli A and Hess S (2012) Effect of mass spectrometric parame-ters on peptide and protein identification rates for shotgun proteomic experiments on an LTQ-orbitrap mass analyzer. Proteomics 12:21-31.
Koller A, Washburn MP, Lange BM, Andon NL, Deciu C, Hay-nes PA, Hays L, Schieltz D, Ulaszek R, Wei J,et al.(2002) Proteomic survey of metabolic pathways in rice. Proc Natl Acad Sci USA 99:11969-11974.
Koornneef M, Bentsink L and Hilhorst H (2002) Seed dormancy and germination. Curr Opin Plant Biol 5:33-36.
Kyte J and Doolittle RF (1982) A simple method for displaying the hydropathic character of a protein. J Mol Biol 157:105-132.
Li X, Bai H, Wang X, Li L, Cao Y, Wei J, Liu Y, Liu L, Gong X, Wu L,et al.(2011) Identification and validation of rice ref-erence proteins for western blotting. J Exp Bot 62:4763-4772.
Liu JX and Bennett J (2011) Reversible and irreversible drought-induced changes in the anther proteome of rice (Oryza sativa
L.) genotypes IR64 and Moroberekan. Mol Plant 4:59-69.
Liu Q and Xue Q (2006) Genome sequencing and identification of gene function in rice. Acta Genet Sin 33:669-677.
Nwugo CC and Huerta AJ (2011) The effect of silicon on the leaf proteome of rice (Oryza sativaL.) plants under cadmium-stress. J Proteome Res 10:518-528.
Sasaki T and Burr B (2000) International Rice Genome Se-quencing Project: The effort to completely sequence the rice genome. Curr Opin Plant Biol 3:138-141.
Shen S, Jing Y and Kuang T (2003) Proteomics approach to iden-tify wound-response related proteins from rice leaf sheath. Proteomics 3:527-535.
Shewry PR and Halford NG (2002) Cereal seed storage proteins: Structures, properties and role in grain utilization. J Exp Bot 53:947-958.
Torabi S, Wissuwa M, Heidari M, Naghavi MR, Gilany K, Hajire-zaei MR, Omidi M, Yazdi-Samadi B, Ismail AM and Sa-lekdeh GH (2009) A comparative proteome approach to de-cipher the mechanism of rice adaptation to phosphorous deficiency. Proteomics 9:159-170.
Vaughan D, Lu BR and Tomooka N (2008) Was Asian rice (Oryza sativa) domesticated more than once? Rice 1:16-24.
Wang Y, Kim S, Kim S, Agrawal G, Rakwal R and Kang K (2011) Biotic stress-responsive rice proteome: An overview. J Plant Biol 54:219-226.
Wilkins MR, Gasteiger E, Tonella L, Ou K, Tyler M, Sanchez JC, Gooley AA, Walsh BJ, Bairoch A, Appel RD,et al.(1998) Protein identification with N and C-terminal sequence tags in proteome projects. J Mol Biol 278:599-608.
Woo SH, Fukuda M, Islam N, Takaoka M, Kawasaki H and Hirano H (2002) Efficient peptide mapping and its applica-tion to identify embryo proteins in rice proteome analysis. Electrophoresis 23:647-654.
Yang P, Liang Y, Shen S and Kuang T (2006) Proteome analysis of rice uppermost internodes at the milky stage. Proteomics 6:3330-3338.
Yang P, Chen H, Liang Y and Shen S (2007a) Proteomic analysis of de-etiolated rice seedlings upon exposure to light. Proteo-mics 7:2459-2468.
Yang P, Li X, Wang X, Chen H, Chen F and Shen S (2007b) Proteomic analysis of rice (Oryza sativa) seeds during ger-mination. Proteomics 7:3358-3368.
Yang MF, Liu YJ, Liu Y, Chen H, Chen F and Shen SH (2009) Proteomic analysis of oil mobilization in seed germination and postgermination development of Jatropha curcas. J Proteome Res 8:1441-1451.
Internet Resources
MASCOT database, Matrix Science, London, UK,
http://www.matrixscience.com (accessed on September 2, 2011).
ExPASy, http://www.expasy.ch/tools/protparam.html (accessed on April 17, 2012).
InterProscan, http://www.ebi.ac.uk/Tools/InterProScan (accessed on March 19, 2012).
WEGO program for Gene Ontology classification,
http://wego.genomics.org.cn (accessed on April 12, 2012). Gene Ontology, http://www.geneontology.org (accessed on April
12, 2012).
Supplementary Material
The following online material is available for this ar-ticle:
Table S1 - The protein spots identified by MALDI-TOF-MS.
Table S2 - The unknown proteins identified by MALDI-TOF-MS.
This material is available as part of the online article from http://www.scielo.br/gmb.
Associate Editor: Marcia Pinheiro Margis
License information: This is an open-access article distributed under the terms of the Creative Commons Attribution License, which permits unrestricted use, distribution, and reproduction in any medium, provided the original work is properly cited.
Table S1 -
The protein spots identified by MALDI-TOF-MS.
Protein no.
Protein name Accession no. MOWSE
score
NMP a SC b Theoretical Mr (kDa) and pI
Function c
1 elongation factor 2 NP_001052057 222 27 39% 94.94/5.85 8
2 elongation factor 2 NP_001046972 71 12 19% 94.99/5.85 8
3 pullulanase ACY56106 76 17 22% 103.02/5.58 1
4 hypothetical protein OsJ_13773 EEE60487 364 35 50% 100.41/5.58 1
5 hypothetical protein OsJ_13773 EEE60487 388 43 50% 100.41/5.58 1
6 hypothetical protein OsJ_13773 EEE60487 350 32 46% 100.41/5.58 1
7 hypothetical protein OsJ_13773 EEE60487 280 32 41% 100.41/5.58 1
8 hypothetical protein OsI_19920 EEC79204 236 25 36% 94.33/5.37 5
9 hypothetical protein OsI_19920 EEC79204 170 23 33% 94.33/5.37 5
10 putative aconitate hydratase, cytoplasmic Q6YZX6 214 23 35% 98.59/5.67 1
11 putative aconitate hydratase, cytoplasmic Q6YZX6 272 33 47% 98.59/5.67 1
12 pyruvate orthophosphate dikinase NP_001050430 276 30 47% 87.70/5.37 1
13 pyruvate orthophosphate dikinase NP_001050430 116 16 23% 87.70/5.37 1
14 alcohol dehydrogenase 1 ABA92030 77 7 26% 38.14/6.19 2
15 hypothetical protein BAD61634 65 5 36% 15.63/9.99 12
16 glycyl-tRNA synthetase NP_001062369 95 11 22% 77.65/5.95 9
17 stress-induced-phosphoprotein 1 NP_001047563 66 7 21% 65.16/6.03 2
18 hypothetical protein OsJ_11969 EEE59627 65 4 26% 13.99/4.99 12
19 hypothetical protein BAD20105 64 7 31% 30.32/11.81 12
20 OSJNBa0039C07.11 CAE05155 88 14 26% 75.38/5.83 3
21 phosphoglucomutase NP_001051066 310 31 64% 63.14/5.4 4
22 heat shock cognate 70 kDa protein ABF95267 247 28 47% 71.93/5.3 2
23 heat shock cognate 70 kDa protein ABF95267 150 23 52% 71.93/5.3 2
24 endosperm lumenal binding protein AAB63469 128 19 29% 73.67/5.3 3
26 endosperm lumenal binding protein AAB63469 199 21 33% 73.67/5.3 3
27 hypothetical protein OsI_37938 EEC69073 184 19 37% 76.45/5.11 6
28 hypothetical protein OsI_37938 EEC69073 146 18 29% 76.45/5.11 6
29 protein disulfide-isomerase A1 NP_001045579 113 13 28% 62.44/4.76 6
30 Os10g0505900 NP_001065009 70 7 17% 45.55/4.74 2
31 Os10g0505900 NP_001065009 121 12 31% 45.55/4.74 2
32 Os10g0505900 NP_001065009 170 18 42% 45.55/4.74 2
33 Os10g0505900 NP_001065009 128 15 34% 45.55/4.74 2
34 alcohol dehydrogenase NP_001067484 109 14 42% 41.70/6.2 1
35 succinate dehydrogenase (ubiquinone) flavoprotein subunit NP_001058845 169 18 40% 69.49/6.61 4
36 aspartyl-tRNA synthetase NP_001047770 165 17 35% 61.45/5.99 9
37 hypothetical protein OsJ_16432 EEE61811 166 16 40% 57.26/5.74 3
38 2-isopropylmalate synthase B ABA91408 174 19 40% 68.86/6.46 1
39 putative β-N-acetylhexosaminidase AAT77374 106 15 33% 59.01/5.71 1
40 2-isopropylmalate synthase NP_001066116 151 17 35% 68.87/6.46 1
41 Os03g0214000 NP_001049368 156 15 36% 68.72/5.88 5
42 asparaginyl-tRNA synthetase NP_001043066 199 23 40% 62.95/5.68 9
43 pyruvate decarboxylase 2 AAA90948 204 17 37% 65.34/5.9 3
44 hypothetical protein OsJ_07413 EAZ23710 70 8 19% 59.74/9.83 4
45 pyruvate decarboxylase NP_001049811 210 17 40% 65.76/5.53 1
46 hypothetical protein OsI_04213 EEC71703 148 17 37% 60.95/5.36 5
47 heat shock 70kDa protein 1/8 NP_001044757 170 25 42% 71.31/5.1 2
48 putative globulin AAS07324 124 14 30% 63.85/8.35 2
49 Os02g0250600 NP_001046445 64 9 22% 47.34/6.4 12
50 hypothetical protein OsI_30268 EAZ08004 118 17 34% 64.24/6.59 5
51 pyrophosphate-fructose-6-phosphate 1-phosphotransferase NP_001057284 233 23 52% 61.91/6.01 1
52 pyrophosphate-fructose-6-phosphate 2-phosphotransferase NP_001057284 238 24 55% 61.91/6.01 1
53 ketol-acid reductoisomerase NP_001043738 103 10 31% 59.99/5.73 1
55 enolase ABB46862 79 8 26% 51.89/5.72 3
56 UTP-glucose-1-phosphate uridylyltransferase NP_001063879 197 15 52% 51.82/5.43 1
57 Chain A, ketol-acid reductoisomerase 3FR7_A 110 12 34% 57.57/5.46 3
58 fructose-bisphosphate aldolase, class I NP_001045130 92 9 33% 39.14/8.35 4
59 chaperonin GroEL NP_001064784 112 13 32% 61.10/5.71 3
60 glucose-6-phosphate isomerase NP_001063415 101 15 27% 68.84/5.71 4
61 Os06g0114000 NP_001056601 168 17 37% 64.33/5.6 3
62 60 kDa chaperonin α subunit AAP44754 281 23 59% 61.48/5.36 3
63 60 kDa chaperonin α subunit AAP44754 75 23 27% 61.48/5.36 3
64 protein disulfide isomerase BAA92322 76 10 34% 33.50/4.81 6
65 protein disulfide isomerase BAA92322 197 17 59% 33.50/4.81 6
66 granule-bound starch synthase 1 AEB52353 79 7 26% 45.35/6.14 4
67 granule-bound starch synthase 1 AEB52353 185 19 59% 45.35/6.14 4
68 UDP glucose 6-dehydrogenase NP_00105132 184 21 57% 53.44/5.79 4
69 ATP synthase F0 subunit 1 YP_002000594 234 26 57% 55.62/5.85 10
70 hypothetical protein OsI_38072 EAY82861 80 10 35% 32.83/8.61 5
71 ATP synthase F0 subunit 1 YP_002000594 207 24 49% 55.62/5.85 10
72 putative selenium binding protein BAB40923 139 17 51% 51.33/5.73 3
73 prolyl aminopeptidase 2 Q6K669 128 19 38% 62.18/8.29 6
74 inositol-3-phosphate synthase ABF94421 76 9 35% 44.41/5.38 2
75 glucose-1-phosphate adenylyltransferase large chain BAD68891 165 16 34% 57.74/5.48 1
76 hypothetical protein OsI_10505 EAY89022 104 11 29% 58.83/5.5 6
77 glucose-6-phosphate isomerase BAD08451 196 23 43% 68.77/5.88 1
78 alanine transaminase NP_001064504 258 28 52% 53.13/6.23 4
79 alanine transaminase NP_001064504 217 20 46% 53.13/6.23 4
80 glutathione reductase (NADPH) NP_001048485 118 15 41% 53.87/6.24 1
81 putative inosine monophosphate dehydrogenase AAK09225 115 13 39% 52.85/6.03 1
82 Os03g0793700 NP_001051533 200 19 38% 52.44/6.78 2
84 alanine transaminase NP_001064504 80 11 19% 53.13/6.23 4
85 aldehyde dehydrogenase (NAD+) NP_001057358 126 16 37% 59.61/6.33 1
86 glucose-1-phosphate adenylyltransferase NP_001061603 86 9 28% 53.20/5.87 1
87 aldehyde dehydrogenase (NAD+) NP_001057358 95 14 26% 59.61/6.33 1
88 glucose-1-phosphate adenylyltransferase NP_001061603 102 11 33% 53.20/5.87 1
89 retrotransposon protein ABA92141 71 17 11% 218.17/8.75 3
90 wheat adenosylhomocysteinase-like protein AAO72664 133 16 39% 53.86/5.62 3
91 hypothetical protein OsI_25188 EEC81650 261 24 56% 57.60/5.98 3
92 2-phospho-D-glycerate hydroylase AAN04181 109 9 28% 46.20/5.16 3
93 hypothetical protein OsI_25188 EEC81650 161 18 39% 57.60/5.98 3
94 enolase AAC49173 116 15 34% 48.30/5.42 4
95 enolase NP_001049556 179 20 58% 48.29/5.32 4
96 2-phosphoglycerate dehydratase Q42971 214 24 63% 48.29/5.41 4
97 UTP-glucose-1-phosphate uridylyltransferase NP_001063879 195 19 58% 51.82/5.43 1
98 F-type H+-transporting ATPase subunit β NP_001043900 230 20 49% 59.60/6.1 4
99 F-type H+-transporting ATPase subunit β NP_001056261 193 17 45% 59.01/5.95 4
100 F-type H+-transporting ATPase subunit β NP_001056261 212 18 50% 59.01/5.95 4
101 V-type H+-transporting ATPase subunit β NP_001057902 91 9 28% 54.14/5.07 4
102 hypothetical protein OsI_17385 EEC77995 95 12 24% 54.50/6.44 1
103 Cupin family protein ABF94466 78 14 13% 74.70/6.02 2
104 6-phosphogluconate dehydrogenase NP_001056586 77 21 42% 52.97/5.85 1
105 argininosuccinate synthase NP_001066459 66 11 21% 52.50/6.59 1
106 putative aminoacylase BAD10058 64 12 30% 49.86/5.88 1
107 argininosuccinate synthase NP_001066459 100 10 24% 52.50/6.59 1
108 argininosuccinate synthase NP_001066459 65 14 29% 52.50/6.59 1
109 OSJNBa0052P16.16 CAD39715 64 6 20% 48.00/6.64 12
110 glucose-1-phosphate adenylyltransferase NP_001051184 68 15 37% 55.79/7.01 1
111 Os05g0418000 NP_001055566 64 9 28% 50.07/5.44 12
113 hypothetical protein OsI_24355 EAZ02256 123 10 38% 48.64/5.23 8
114 amidase, hydantoinase/carbamoylase family protein ABA99240 121 8 26% 51.80/5.41 6
115 eukaryotic initiation factor 4A BAA02152 80 12 29% 47.19/5.29 8
116 glucose-1-phosphate adenylyltransferase NP_001062808 106 8 24% 55.10/6.23 1
117 TPA_exp: transposase DAA02079 66 9 18% 72.82/9.31 9
118 Os10g0188500 NP_001176052 146 4 34% 21.14/4.81 12
119 hypothetical protein OsI_27570 EEC82801 64 9 10% 131.01/8.46 7
120 hypothetical protein OsI_09330 EAY87910 86 16 38% 47.04/4.94 3
121 isocitrate dehydrogenase NP_001043749 64 8 22% 46.36/6.34 4
122 alcohol dehydrogenase 1 ABA92030 64 10 22% 38.14/6.19 2
123 hypothetical protein OsI_18007 EEC78293 94 10 23% 59.89/5.58 5
124 L-iditol 2-dehydrogenase NP_001062412 70 9 33% 39.99/6.03 4
125 alcohol dehydrogenase 1 ABA92030 65 6 14% 38.14/6.19 2
126 L-iditol 2-dehydrogenase NP_001062412 98 16 55% 39.99/6.03 1
127 L-iditol 3-dehydrogenase NP_001062412 68 11 30% 39.99/6.03 1
128 L-iditol 4-dehydrogenase NP_001062412 113 17 55% 39.99/6.03 1
129 hypothetical protein OsJ_06802 EEE57026 90 5 25% 34.307/8.1 3
130 hypothetical protein OsI_05369 EAY77382 95 6 18% 45.69/5.74 3
131 tryptophanyl-tRNA synthetase NP_001066951 83 13 37% 46.53/5.62 9
132 guanine nucleotide-exchange protein GEP2 AAM00191 105 13 7% 199.20/5.49 7
133 Os02g0158900 NP_001045960 70 10 31% 44.69/5.47 12
134 Os04g0429200 NP_001173940 85 5 31% 15.49/6.89 12
135 hypothetical protein OsJ_11020 EAZ27089 66 4 60% 7.64/9.76 12
136 OSJNBb0050O03.16 CAE01726 64 5 25% 36.58/5.37 3
137 monodehydroascorbate reductase BAA77282 66 12 50% 43.04/5.36 2
138 actin NP_001065830 68 13 45% 41.82/5.31 3
139 actin NP_001054419 86 12 40% 41.90/5.23 3
140 retrotransposon protein ABA95357 87 11 4% 319.63/8.44 1
142 hypothetical protein OsI_13391 EAY91751 64 5 30% 14.96/9.58 12
143 glyceraldehyde 3-phosphate dehydrogenase NP_001053139 65 14 48% 36.92/6.34 4
144 phosphoglycerate kinase NP_001058317 64 9 31% 42.31/6.19 5
145 glyceraldehyde 3-phosphate dehydrogenase NP_001053139 129 11 39% 36.92/6.34 1
146 Os04g0338000 NP_001052494 80 11 33% 38.50/6.03 1
147 RGP2 protein CAA09470 99 9 26% 39.53/8.08 3
148 aspartate aminotransferase NP_001048397 76 14 35% 50.55/8.16 1
149 L-iditol 2-dehydrogenase NP_001062412 93 11 29% 39.99/6.03 1
150 OrysaZxa Q75H81 219 19 54% 42.11/5.75 12
151 L-iditol 2-dehydrogenase NP_001062412 66 18 59% 39.99/6.03 1
152 elongation factor Tu NP_001051912 83 18 44% 48.56/6.04 8
153 aspartate-semialdehyde dehydrogenase NP_001051347 111 8 32% 40.44/6.73 1
154 Os06g0215100 NP_001057134 70 7 29% 43.7/9.51 12
155 IAA-amino acid hydrolase NP_001043347 138 13 41% 47.28/5.66 1
156 phosphoglycerate kinase NP_001046020 69 14 47% 42.20/5.64 5
157 Os07g0120900 NP_001058784 66 8 20% 58.43/8 12
158 Os04g0386600 NP_001052622 72 14 47% 41.64/5.66 1
159 reversibly glycosylated polypeptide CAA77235 82 11 37% 41.86/5.82 3
160 succinyl-CoA synthetase β subunit NP_001047463 119 8 21% 45.41/5.98 4
161 glucose-6-phosphate 1-epimerase NP_001054126 177 11 51% 38.10/5.1 1
162 Os03g0843300 NP_001051862 66 7 28% 34.78/4.9 12
163 hypothetical protein OsI_32784 EAY77740 91 7 26% 36.60/5.27 1
164 Os03g0161100 NP_001049041 69 18 7% 317.24/4.96 7
165 glucose and ribitol dehydrogenase homolog Q75KH3 64 11 31% 32.48/5.76 1
166 enoyl-[acyl-carrier protein] reductase I NP_001061557 64 10 36% 39.28/8.81 1
167 malate dehydrogenase NP_001064860 65 7 26% 35.89/5.75 4
168 malate dehydrogenase NP_001064860 105 11 44% 35.89/5.75 4
169 Os05g0116000 NP_001054469 71 7 31% 38.46/5.81 12
171 guanine nucleotide-binding protein subunit β-2-like 1 protein NP_001043910 77 6 27% 36.67/5.97 7
172 acyl-[acyl-carrier-protein] desaturase 2, chloroplastic Q8S059 66 14 39% 45.08/6.39 1
173 malate dehydrogenase NP_001064860 65 8 33% 35.89/5.75 4
174 Os03g0793700 NP_001051533 67 13 31% 52.44/6.78 2
175 guanine nucleotide-binding protein subunit β-2-like 1 protein NP_001043910 65 6 31% 36.67/5.97 7
176 hypothetical protein OsJ_12925 EAZ28885 110 9 23% 49.98/7.74 2
177 hypothetical protein OsJ_12925 EAZ28885 76 7 21% 49.98/7.74 2
178 globulin-like protein AAM33459 64 9 18% 52.38/6.78 2
179 Os03g0793700 NP_001051533 64 15 35% 52.44/6.78 2
180 hypothetical protein OsJ_12925 EAZ28885 66 10 26% 49.98/7.74 2
181 Os03g0327600 NP_001049995 64 10 39% 39.25/6.3 12
182 globulin-like protein AAM33459 66 7 23% 52.38/6.78 2
183 Os03g0327600 NP_001049995 72 10 39% 39.25/6.3 12
184 hypothetical protein OsJ_06082 EEE56662 66 8 15% 53.83/9.14 6
185 Os01g0762500 NP_001044328 66 7 24% 56.78/9.09 6
186 Os03g0793700 NP_001051533 88 9 28% 52.47/6.78 2
187 Os11g0701100 NP_001068520 76 9 29% 31.86/6.12 1
188 translation initiation factor 3 subunit I NP_001061508 121 8 26% 36.53/5.94 8
189 metal-dependent hydrolase-like protein BAD15421 71 8 30% 29.60/6.19 1
190 receptor protein kinase-like BAD73679 86 7 16% 70.30/7.1 5
191 hypothetical protein OsI_07904 EEC73520 69 10 16% 81.34/9.36 12
192 Os03g0663800 NP_001173574 96 10 35% 45.51/6.07 2
193 Os03g0663800 NP_001173574 66 10 35% 45.51/6.07 2
194 Os03g0663800 NP_001173574 161 9 30% 45.51/6.07 2
195 unknown protein AAN05517 107 7 41% 35.44/5.57 12
196 Os03g0663800 NP_001173574 67 10 35% 45.51/6.07 2
197 Os03g0663800 NP_001173574 72 10 35% 45.51/6.07 2
198 lactoylglutathione lyase NP_001061172 64 9 39% 32.88/5.51 1
200 enoyl-[acyl-carrier protein] reductase I NP_001061557 73 9 34% 39.28/8.81 1
201 unnamed protein product BAH00330 65 5 44% 20.73/6.18 1
202 hypothetical protein OsJ_13801 EAZ29742 67 12 37% 54.48/9.06 2
203 putative glucanase BAB85436 181 12 42% 34.23/5.35 4
204 lactoylglutathione lyase NP_001061172 83 12 46% 32.88/5.51 1
205 hypothetical protein AAT44171 182 6 52% 16.21/10.35 12
206 hypothetical protein OsI_11164 EEC75053 134 5 33% 31.78/5.11 1
207 hypothetical protein OsI_11164 EEC75053 81 9 31% 31.78/5.11 1
208 α-soluble NSF attachment protein NP_001061446 64 5 20% 32.75/5.04 3
209 Os06g0341300 NP_001057565 64 10 48% 27.91/4.19 12
210 Os12g0626500 NP_001067326 156 8 41% 19.89/4.57 12
211 Os03g0663800 NP_001173574 120 9 33% 45.51/6.07 2
212 Os02g0580300 NP_001047234 68 14 54% 29.85/4.71 3
213 14-3-3-like protein gf14-6 ABR25721 87 5 58% 16.42/4.57 3
214 Os04g0462500 NP_001053003 64 8 37% 29.96/4.76 3
215 Os08g0430500 NP_001061856 118 5 30% 28.98/4.78 3
216 Os11g0546900 NP_001068067 109 13 56% 29.36/4.83 3
217 Os08g0480800 NP_001062060 68 13 48% 29.10/4.85 3
218 Os04g0404400 NP_001052704 219 12 48% 31.33/4.9 12
219 hypothetical protein BAD16983 161 4 72% 10.94/8.53 12
220 OSJNBb0014D23.1 CAE05267 154 6 12% 74.92/5.76 12
221 Os03g0663800 NP_001173574 75 9 33% 45.51/6.07 2
222 hydroxyacylglutathione hydrolase NP_001050016 71 9 46% 29.00/5.43 1
223 inorganic pyrophosphatase NP_001054331 150 10 50% 24.29/5.59 1
224 Os07g0170200 NP_001058990 75 6 21% 31.09/9.6 7
225 Os05g0569500 NP_001056364 124 10 35% 26.74/5.58 12
226 Cupin family protein, expressed ABF95817 103 13 26% 61.74/7.18 2
227 hypothetical protein OsJ_12925 EAZ28885 68 7 19% 49.98/7.74 2
229 hypothetical protein OsJ_25289 EEE67666 80 10 7% 213.77/4.93 12
230 hypothetical protein OsJ_19146 EEE64309 65 7 21% 30.55/6.66 1
231 Cupin family protein ABF95817 87 15 30% 61.74/7.18 2
232 hypothetical protein BAD81742 99 5 46% 18.85/9.00 12
233 thioredoxin peroxidase A P0C5C8 89 6 31% 24.23/5.97 1
234 hypothetical protein OsI_26825 EAZ04671 67 5 40% 23.72/5.78 2
235 protein of unknown function DUF1264 family protein NP_001044131 66 13 60% 27.72/5.98 3
236 retrotransposon protein, putative, Ty3-gypsy subclass ABB47110 103 10 10% 151.89/7.91 7
237 Os03g0277500 NP_001049720 65 8 66% 15.05/5.54 12
238 thioredoxin 1 NP_001051587 119 7 52% 14.90/5.67 3
239 20S proteasome subunit β 6 NP_001063603 141 8 39% 24.61/6.43 3
240 Os03g0822200 NP_001051733 82 11 52% 27.95/6.34 1
241 Os11g0701100 NP_001068520 73 8 30% 31.86/6.12 1
242 Cupin family protein ABF95817 70 10 21% 61.74/7.18 2
243 Os03g0659300 NP_001050818 94 5 50% 15.17/5.48 1
244 Os05g0116100 NP_001054470 67 7 46% 23.73/5.81 3
245 Os05g0542500 NP_001056195 66 10 36% 20.50/5.89 3
246 unnamed protein product AAA72362 66 10 36% 20.26/6.6 12
247 unnamed protein product AAA72362 65 10 35% 20.26/6.6 12
248 unnamed protein product AAA72362 109 12 38% 20.26/6.6 12
249 Os09g0467200 NP_001063423 128 10 39% 25.34/5.5 3
250 triosephosphate isomerase (TIM) NP_001042016 116 8 62% 27.27/5.38 4
251 20S proteasome subunit α 2 NP_001047516 112 10 48% 25.83/5.39 3
252 unnamed protein product AAA72362 75 9 28% 20.26/6.6 12
253 hypothetical protein BAD62040 92 4 46% 8.49/4.75 12
254 triosephosphate isomerase (TIM) NP_001042016 66 7 35% 27.27/5.38 4
256 triosephosphate isomerase (TIM) NP_001042016 105 8 44% 27.27/5.38 4
255 unknown protein BAD53921 67 11 17% 70.92/8.08 12
258 putative chaperonin 21 precursor BAD35232 64 13 69% 23.20/5.72 3
259 hypothetical protein BAD19892 102 3 76% 7.02/9.4 12
260 glutathione S-transferase NP_001059595 82 9 42% 26.04/5.01 1
261 Os03g0197300 NP_001049271 106 7 21% 68.53/5.52 2
262 Os03g0197300 NP_001049271 146 8 21% 68.53/5.52 2
263 Os03g0197300 NP_001049271 86 8 19% 68.53/5.52 2
264 Os03g0197300 NP_001049271 67 8 18% 68.53/5.52 2
265 Os01g0210500 NP_001042368 116 5 34% 23.75/4.73 3
266 hypothetical protein BAD87149 111 4 47% 12.71/11.12 12
267 Os03g0197300 NP_001049271 175 6 18% 68.53/5.52 2
268 Os03g0197300 NP_001049271 67 6 18% 68.53/5.52 2
269 hypothetical protein OsI_19379 EEC78937 94 7 21% 53.68/5.55 1
270 hypothetical protein OsI_28286 EAZ06044 89 11 20% 38.65/5.85 3
271 Os05g0468800 NP_001055802 103 8 47% 18.23/5.71 1
272 Os10g0437500 NP_001064677 98 5 25% 19.16/5.61 12
273 Os08g0129200 NP_001060914 64 5 47% 19.02/6.28 3
274 Os03g0305600 NP_001049884 97 9 54% 18.42/6.42 2
275 Os07g0191700 NP_001059096 64 8 8% 129.06/8.84 12
276 α−amylase inhibitor ACV41264 65 5 35% 15.89/6.51 2
277 hypothetical protein OsI_09038 EEC74046 147 6 21% 42.96/8.85 9
278 hypothetical protein OsI_01558 EEC70487 124 5 36% 17.91/6.41 12
279 hypothetical protein OsI_08519 EEC73809 79 6 22% 44.51/4.94 12
280 hypothetical protein OsJ_05706 EEE56482 80 11 15% 90.63/8.69 12
281 hypothetical protein OsI_11558 EEC75250 104 8 19% 55.96/5.48 1
282 hypothetical protein OsJ_33343 EEE51843 92 8 19% 61.38/6.98 5
283 regulator of ribonuclease activity ABR25651 65 8 64% 18.28/5.61 9
284 Os01g0184100 NP_001042231 81 6 40% 18.13/5.61 2
285 Os01g0722800 NP_001044103 69 5 36% 18.34/5.35 12
287 hypothetical protein OsI_35528 EAY80356 64 5 56% 19.19/6.36 12
288 Os01g0225600 NP_001042461 88 6 52% 16.29/5 2
289 Os06g0363701 NP_001174783 64 10 11% 152.05/5.3 12
290 hypothetical protein OsI_19752 EEC79115 64 4 41% 17.41/6.49 1
291 hypothetical protein OsJ_13801 EAZ29742 70 7 20% 54.48/9.06 2
292 retrotransposon protein ABA95630 68 6 27% 36.39/6.27 9
293 hypothetical protein OsI_21855 EEC80108 67 4 13% 15.02/5.85 1
294 hypothetical protein OsJ_09934 EEE58599 66 4 58% 11.23/10.32 12
295 hypothetical protein OsJ_30719 EEE50570 65 4 38% 15.26/5.08 1
296 OSJNBa0009K15.7 CAE05087 90 11 8% 195.33/8.62 11
297 hypothetical protein AAL84309 64 7 22% 35.02/6.51 11
298 hypothetical protein BAD05367 64 4 34% 12.67/7.85 12
299 Os06g0221300 NP_001057177 65 6 32% 18.45/6.18 3
300 transposon protein AAK52138 68 7 35% 23.00/11.05 9
301 putative gypsy-type retrotransposon AAL58269 74 8 7% 165.47/9.53 7
302 cofilin NP_001051721 64 6 56% 16.05/5.72 3
a
Number of matched peptides.
b
Sequence coverage.
c
Table S2 -
The unknown proteins identified by MALDI-TOF-MS.
Protein no.
Protein name Accession no. MOWSE
score
NMP a SC b Theoretical Mr
(kDa) and pI
Function
15 hypothetical protein BAD61634 65 5 36% 15.63/9.99 12 c
18 hypothetical protein OsJ_11969 EEE59627 65 4 26% 13.99/4.99 12
19 hypothetical protein BAD20105 64 7 31% 30.32/11.81 12
49 Os02g0250600 NP_001046445 64 9 22% 47.34/6.4 12
109 OSJNBa0052P16.16 CAD39715 64 6 20% 48.00/6.64 12
111 Os05g0418000 NP_001055566 64 9 28% 50.07/5.44 12
118 Os10g0188500 NP_001176052 146 4 34% 21.14/4.81 12
133 Os02g0158900 NP_001045960 70 10 31% 44.69/5.47 12
134 Os04g0429200 NP_001173940 85 5 31% 15.49/6.89 12
135 hypothetical protein OsJ_11020 EAZ27089 66 4 60% 7.64/9.76 12
142 hypothetical protein OsI_13391 EAY91751 64 5 30% 14.96/9.58 12
150 OrysaZxa Q75H81 219 19 54% 42.11/5.75 12
154 Os06g0215100 NP_001057134 70 7 29% 43.87/9.51 12
157 Os07g0120900 NP_001058784 66 8 20% 58.43/8 12
162 Os03g0843300 NP_001051862 66 7 28% 34.78/4.9 12
169 Os05g0116000 NP_001054469 71 7 31% 38.46/5.81 12
170 Os02g0821001 NP_001173211 67 4 72% 8.81/10.25 12
181 Os03g0327600 NP_001049995 64 10 39% 39.25/6.3 12
183 Os03g0327600 NP_001049995 72 10 39% 39.25/6.3 12
191 hypothetical protein OsI_07904 EEC73520 69 10 16% 81.34/9.36 12
195 unknown protein AAN05517 107 7 41% 35.44/5.57 12
205 hypothetical protein AAT44171 182 6 52% 16.21/10.35 12
209 Os06g0341300 NP_001057565 64 10 48% 27.91/4.19 12
218 Os04g0404400 NP_001052704 219 12 48% 31.33/4.9 12
219 hypothetical protein BAD16983 161 4 72% 10.94/8.53 12
220 OSJNBb0014D23.1 CAE05267 154 6 12% 74.92/5.76 12
225 Os05g0569500 NP_001056364 124 10 35% 26.74/5.58 12
229 hypothetical protein OsJ_25289 EEE67666 80 10 7% 213.77/4.93 12
232 hypothetical protein BAD81742 99 5 46% 18.85/9 12
237 Os03g0277500 NP_001049720 65 8 66% 15.05/5.54 12
246 unknown protein AAA72362 66 10 36% 20.26/6.6 12
247 unknown protein AAA72362 65 10 35% 20.26/6.6 12
248 unknown protein AAA72362 109 12 38% 20.26/6.6 12
252 unknown protein AAA72362 75 9 28% 20.26/6.6 12
253 hypothetical protein BAD62040 92 4 46% 8.49/4.75 12
255 unknown protein BAD53921 67 11 17% 70.92/8.08 12
259 hypothetical protein BAD19892 102 3 76% 7.02/9.4 12
266 hypothetical protein BAD87149 111 4 47% 12.71/11.12 12
272 Os10g0437500 NP_001064677 98 5 25% 19.16/5.61 12
275 Os07g0191700 NP_001059096 64 8 8% 129.06/8.84 12
278 hypothetical protein OsI_01558 EEC70487 124 5 36% 17.91/6.41 12
279 hypothetical protein OsI_08519 EEC73809 79 6 22% 44.51/4.94 12
280 hypothetical protein OsJ_05706 EEE56482 80 11 15% 90.63/8.69 12
285 Os01g0722800 NP_001044103 69 5 36% 18.34/5.35 12
287 hypothetical protein OsI_35528 EAY80356 64 5 56% 19.19/6.36 12
289 Os06g0363701 NP_001174783 64 10 11% 152.05/5.3 12
294 hypothetical protein OsJ_09934 EEE58599 66 4 58% 11.23/10.32 12
298 hypothetical protein BAD05367 64 4 34% 12.67/7.85 12
a
Number of matched peptides.
b
Sequence coverage.
c