Diurnal variation of methane emission from a paddy field in Brazilian Southeast
Variação diurna da emissão de metano em arroz irrigado no Sudeste do Brasil
Magda Aparecida de Lima1* Ricardo Antonio Almeida Pazianotto1
Omar Vieira Villela2 Lourival Costa Paraíba1
ISSNe 1678-4596
INTRODUCTION
The lowland flood-irrigated rice is a cropping system that promotes methane (CH4) emission, an
important greenhouse gas that strongly influences the atmosphere photochemistry. The CH4 shows a potential
global heating capacity 28-fold higher than carbon dioxide (CO2) over a 100-year time horizon (MyHre
et al., 2013). Local measurements of CH4 emissions are
essential for the improvement of national and regional gas emission inventories. In order to optimize efforts for gas measurements it is important to know the time
representing the average daily emission for a given producing area, as well as the influence of some key environmental parameters associated with the emission fluxes, for example, soil, air and water temperatures. A number of studies reported positive correlations between CH4 diurnal emission variations and soil
temperature in paddy fields under different climate conditions (SCHüTz et al., 1990; YagI & MINaMI, 1990; SASS et al., 1991; COSTA et al., 2008). WANG et al. (1997) argued that diel patterns of CH4 emissions
are determined by the interaction of the soil temperature and the partial pressure of CH4.
1emprapa Meio Ambiente, rodovia SP-340, 13820-000, Jaguariúna, SP, Brasil. e-mail: Magda.Lima@embrapa.br. *Corresponding author. 2Agência Paulista de Tecnologia dos Agronegócios (APTA), Pólo regional Vale do Paraíba, Pindamonhangaba, SP, Brasil.
ABSTRACT: This study aimed to investigate the diurnal variation of methane (CH4) emission in a flooded-irrigated rice field at different
stages of the plant development under tropical climate in three growing seasons, in order to determine the most appropriate time for gas
sampling in the Brazilian Southeast region. It aimed also to verify correlations between CH4 flux and air, water and soil temperatures, and solar
radiation. The CH4 emissions were measured every 3-hour interval on specific days in different development stages of the flooded rice in the
Experiment Station of the Agência Paulista de Tecnologia dos Agronegócios (APTA), Pólo Regional Vale do Paraíba, at Pindamonhangaba,
State of São Paulo (22°55’ S, 45°30’ W), Brazil. Different CH4 emission rates were observed among the plant growth stages and also among the
growing seasons. The CH4 emission showed high correlation with the soil temperature at 2cm depth. At this depth, the CH4 emission activation
energy in response to soil temperature was higher in the stage R2. Emission peaks were observed at afternoon, while lower fluxes were recorded at the early morning. The most appropriate local time for gas sampling was estimated at 12:11:15a.m.±01:14:16 and 09:05:49p.m.±01:29:04.
Key words: flooded rice, methane flux, plant development stage, activation energy.
RESUMO: Este estudo teve como objetivo investigar a variação diurna de emissões de metano (CH4) em uma lavoura de arroz irrigado por
inundação em diferentes estágios de desenvolvimento de plantas de arroz irrigado, sob clima tropical, em três estações de crescimento, para determinar o período de tempo mais apropriado à amostragem de gás na região Sudeste do Brasil. O trabalho objetivou também verificar
correlações entre o fluxo de CH4 e as temperaturas do ar, da água e do solo e a radiação solar. As emissões diurnas de CH4 foram medidas
a cada intervalo de três (3) horas em dias específicos em diferentes estágios de desenvolvimento da planta de arroz inundado na Estação Experimental da Agência Paulista de Tecnologia dos Agronegócios (APTA), Pólo Regional Vale do Paraíba, em Pindamonhangaba, Estado de São Paulo (22°55’ S, 45°30’ W), Brasil. Diferentes taxas de emissão foram observadas entre os estágios de desenvolvimento da planta
avaliados e também entre as estações de cultivo. A emissão de CH4 mostrou alta correlação com a temperatura do solo a 2cm de profundidade.
Nesta profundidade, a energia de ativação da emissão de CH4 em resposta à temperatura do solo foi maior no estágio R2. Os picos de emissão
foram observados no período da tarde, enquanto que menores fluxos foram registrados no início da manhã. O horário mais apropriado para amostragem de gás foi estimado em 12:11:15a.m.±01:14:16 and 09:05:49p.m.±01:29:04.
Palavras-chave: arroz irrigado por inundação, fluxo de metano, estágio de desenvolvimento da planta, energia de ativação.
Neue et al. (1997) observed fast CH4
emission increase after sunrise reaching a maximum after midday, decreasing until minimum at night. Other authors also reported one CH4 emission peak
during the day (SATPATHy et al., 1997; WANG et al., 1999), but there are reports about the occurrence of two peaks (WANG et al. 1993). SASS et al. (1991) observed diurnal maximum emission values between 7 and 9p.m. in rice fields in Texas. Peaks at night could be probably caused by a lower O2 transport
to the rhizosphere, causing lower CH4 oxidation
and higher net emissions (SCHüTz et al., 1989). according to SCHüTz et al. (1990), the diurnal CH4
emission rhythm may increase with the increasing diurnal rhythm of root exudates, resulting in higher apparent activation energy (Ea). Ea represents the
microbial community response to temperature, which is responsible for the CH4 production and release to
the atmosphere. SaSS et al. (1991) showed that the solar radiation and the photosynthetic activity of rice plant are correlated with the CH4 production and with
the grain yield. DeNIer VAN Der GON et al. (1996) also reported that temperature and solar radiation may affect CH4 emission due to their effect in the
net primary production and in the root exudation. By using the eddy covariance technique, HATALA et al. (2012) argued that the gross photosynthesis, more than the soil temperature and other abiotic factors, is the primary causes of the diurnal pattern in rice paddy CH4 flux. On the same line, KNOx et al.
(2016) concluded that photosynthesis is the dominant factor influencing the diurnal pattern in CH4 flux,
although, soil temperature significantly influences the amplitude of diurnal CH4 fluctuations. Most part
of the studies has been carried out in temperate and subtropical climate regions and scarce information is available for tropical soils. The Paraíba Valley, located in the Southeast of Brazil, under tropical climate, has just over 7,000 hectares of irrigated rice, about 69% of the total area of rice production in the state of São Paulo. It became the remaining region of rice production in the state, since the upland and rainfed rice was strongly reduced over the last few decades. The objective of this study was to investigate the diurnal variation of CH4 emission in a
flooded-irrigated rice system in specific days of different plant development stages, under tropical climate, and three growth seasons in order to determine the appropriate time period for gas sampling in that region. It aimed also to verify correlations between CH4 flux and air,
water and soil temperatures, and solar radiation. This information will support studies focused on CH4 emission quantification in paddy fields and to
contribute with the improvement of gas emission inventories for the Southeast region of Brazil.
MATERIALS AND METHODS
The study was carried out in an experimental paddy field at Pindamonhangaba, State of São Paulo, in the Agência Paulista de Tecnologia dos Agronegócios (APTA), Pólo regional Vale do Paraíba (APTA), located at 22o55’ S Latitude, 45o30’ W Longitude, with
560 meters of average altitude. The soil is classified as a Haplic Gleysols (eMBrAPA, 2013) with clayey or loamy-clayey texture. The organic carbon (OC) content was estimated in 20.2±2.6g kg-1 at 0-10cm depth and
14.8±2.4g kg-1 at 10-20cm depth, and total nitrogen
(N) content in 1.3g kg-1 and 1.2g kg-1 at 0-10cm and
10-20cm, respectively. The climate is type Cwa (tropical climate of altitude), according to the Köeppen classification, with average highest temperature above 22oC and average lowest temperature below 18oC,
warm and moist summer and dry winter. The average annual rainfall is 1,334mm (VILLeLA & FurLANI JuNIOr, 1996). The experiment consisted of a single water management (continuous), with plots of approximately 500 square meters with two repetitions. The IAC 103 rice variety was used in the three growth seasons (GS). It is characterized as a medium cycle variety with average plant height of 95cm and average grain yield of 5,056kg ha-1. Seedlings were manually
transplanted, spaced 30cm between rows and 20cm between plants. After seedling regeneration, the field was flooded under 15cm of water, on average. The field was fertilized with urea. Campaigns of 24-hour gas sampling every 3h were performed in the GS of 2003/2004, 2004/2005 and of 2005/2006. In the 1st
GS (2003/2004), rice was transplanted in Dec 31st,
2003, and two sampling campaigns were carried out: (C1) March 15th, 2004, in the booting stage in the
reproductive phase (stage r2, according to COuNCe (2000)); (C2) April 26th, 2004, in the ripening stage (in
the transition of the stages r7-r8), 37 days after panicle exertion and 16 days after soil drainage. We adopted this later sampling campaign to observe the diurnal CH4 fluxes near the harvest. Also, only at 37 days after
the panicle exertion the plant was completely mature, with a very slow soil drainage due to the frequent rain events occurred in that specific period and to the own physiographic condition of the study area. In this first GS soil, pH varied from 6.3 to 6.4, and eh from -177 (C1) to -192 (C2). In the 2nd GS (2004/2005) rice was
transplanted in Dec 21st, 2004 and three campaigns
were performed: (C1) March 9th, 2005, in the rice plant
days before panicle exertion; (C2) March 23th, 2005,
in the stage r5, 9 days after panicle exertion; (C3) april 13th, 2005, at the stage r7, 30 days after panicle
exertion. The drainage of the fields occurred at Apr 20th, 2005. The pH soil values varied from 6.7 to 6.6
and eh were -318 (C1), -292 (C2) and -233 (C3). In the 3th GS (2005/2006), rice was transplanted in Jan
1st, 2006 and three campaigns were performed: (C1) February 6th, 2006, in the V10 vegetative stage; (C2)
March 20th, 2006, in the booting stage (r2), 3 days
before flowering; (C3) April 10th, 2006, in the ripening
stage (in the transition of the stages r6-r7). Fields drainage occurred seven days later. In that GS, soil pH were 6.5 (C1), 6.6 (C2) and 6.8 (C3), while eh values were -202 (C1), -233 (C2), -221 (C3).
Methane Flux Measurements
Air samples were collected using the method of closed chamber (SASS et al., 1991). Chambers (60x60cm) were made with aluminum and composed by permanent anchors, extensors and lids equipped with temperature sensor, fans and a septum for air sampling. each chamber was settled 5cm depth into the soil soon after the flooding, and remained in the same place during the entire growing season. Air samples were collected from the chamber lids at 3-hour interval, using 60mL polystyrene syringes (DA Becton, Dickinson and Company - BD). each flux value was obtained from a series of five samples taken from each box at 5min intervals (SASS et al., 2002). zero-minute samples were taken outside the chamber, 1 meter over the surface of the rice paddy. Samples were analyzed in a Agilent model GC 6890 gas chromatograph, equipped with 6-way valves, split mode injector, 0.5cc stainless-steel loop, HP-Plot Al/M megabore column (0.53mm diameter x 30m length) and flame ionization detector (FID). A standard curve of CH4 was prepared with 5,
10 and 20ppm of CH4. Methane fluxes were calculated
by the equation where f is CH4 flux, P is the mean air pressure in the chamber (≈1atm), µ is the gas molecular weight of CH4 (16.123g/mol),
R is the universal gas constant (8.31441 J/mol·K), T
is the temperature within the chamber at sampling (K), H is the height (m) of the chamber at sampling,
ΔC/Δtis the change in CH4 concentration during the
incubation time (Δt).
Environmental parameters
Average air temperature and solar radiation data were obtained from the meteorological station of “APTA - Vale do Paraíba”, at Pindamonhangaba. Temperatures of floodwater and soil (at 2, 5 and
10cm depth) were registered with a Full Gauge thermometer of five edges. Air temperature inside the chambers were registered at each gas sampling time with a digital thermometer. Soil pH and eh data were registered using a Digimed digital pHmeter.
Data analysis
A second-degree polynomial non-parametric local-regression model was used to fit a smooth curve to the CH4 diurnal emission data. The
adjusted curves were used to estimate the average diurnal CH4 emission over each 24h-campaign and
the respective time for these emissions. The 95% confidence interval of adjusted curve was used to calculate the error emissions. Correlation coefficients between CH4 emission and other variables were
estimated using the method of Pearson (p≤0.05). We
calculated the activation energy, Ea (kJ mol-1), using
the linearized equation of Arrhenius (SASS et al.,
1991) where f is the CH4 emission, a is the Arrhenius constant, R is the gas universal
constant (J/mol·K) and Ts2 is the temperature of the
soil at 2cm depth (K). The parameters were estimated by carrying out linear regression. Data were analyzed using the r software (r COre TeAM, 2015).
RESULTS AND DISCUSSION
Diurnal variation of CH4 emission in the
24h-campaigns in the three rice growth stages
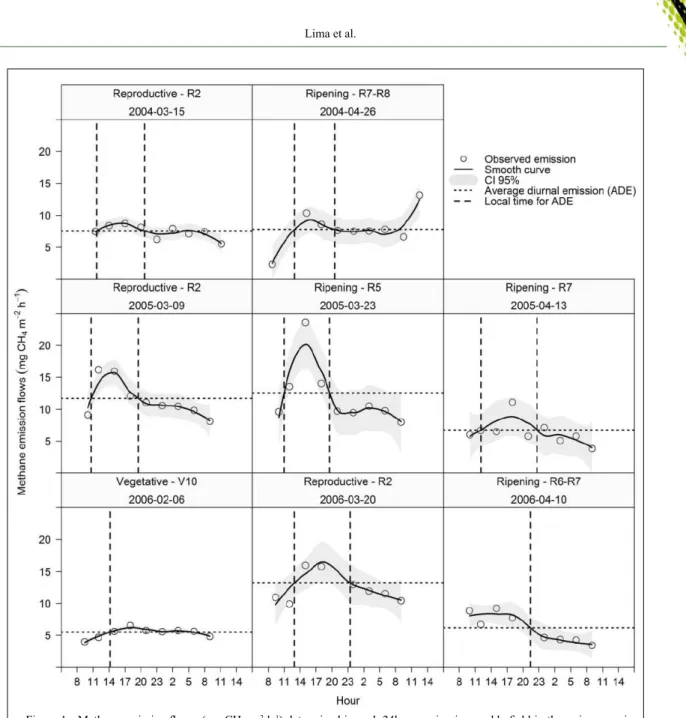
emission peaks were mostly observed in the afternoon and lower fluxes were recorded in the early morning (Figure 1), as also observed by other authors (WASSMANN et al., 1994; SATPATHy et al.,1997; WANG et al., 1997; yANG & CHANG, 1999; TSeNG et al., 2010). Average CH4 flux rate at the r2 stage
(C1) of the first GS (7.58±1.05mg CH4 m
-2 h-1) was
lower compared with the following GS (11.74±1.87 and 13.22±2.61 in 2004/2005 and 2005/2006, respectively). These lower emissions might be partially explained by climatic conditions with lower average air temperature in the (C1) campaign (23.6oC, in a range
of 17.3 -31.7oC) when compared with the campaigns
performed in the r2 stage in the two following GS (28.0 and 28.4oC in the 2004/2005 and 2005/2006
GS, respectively) (Table 1). According to yOSHIDA (1981), the optimum rice crop growth occurs under air temperatures between 20 and 35oC, flowering, 30
and 33oC, and ripening, 20 and 25oC. Temperature is
solar radiation. Diurnal accumulated solar radiation registered in the 24h-campaigns performed in the first GS (100.4cal.cm-2.dia-1 at C1 and 119.5cal.cm-2.dia-1 at
C2) was lower than those of the following ones (129.1 to 239.0cal.cm-2.dia-1 in the GS of 2004/2005 and of
188.8 to 217.5cal.cm-2.dia-1 in 2005/2006), which
could have affected the efficiency of the photosynthetic process and exudates production with consequent lower CH4 emission rates. Lower CH4 emission rates
observed in the latest campaigns, at the maturity, might be attributable to the decrease of the capacity of CH4
transportation caused by the blocking of aerenchymal channels (AuLAKH et al., 2001) and to the increase of CH4 oxidation in the soils (SCHuTz et al., 1989).
In the second 24h-campaign (Apr 26th) of the first GS,
after 16 days of the soil drainage, when there was not a water blade, CH4 fluxes were recorded probably due
to several rain events, favoring some anoxic condition in the soil, with a eh equivalent to -192. Higher CH4
emission rates were observed between the r2 and r5 stages in the second and third GS, in a range of 11.7 to 13.2mg CH4 m
-2 h-1, then decreasing in later stages,
when the grains are being filled and the physiologic maturity is achieved. Based on the daily CH4 average
flux over each 24h-campaign, the most appropriate local time for gas sampling in the studied area was estimated at 12:11:15a.m.±01:14:16 (mean ± standard deviation) and 09:05:49p.m.±01:29:04.
Correlation between parameters and CH4 emissions
A modest but significant correlation was reported between CH4 emission and air temperature in
the reproductive and in the ripening stages (r2=0.55 and
r2=0.53, respectively, p≤0.05), while a higher correlation
was reported between CH4 emission and water
temperature (Table 2) in the same stages (r2=0.82 and
r2=0.72 respectively, p≤0.05). Similarly, SATPATHy
et al. (1997) reported a high correlation between CH4
emission and water and air temperature at the rice tillering and ripening stages. MeIJIDe et al. (2011) associated higher CH4 emissions in the late evening with
higher water temperature in a rice paddy field in Italy.
Methane emission and soil temperature was highly correlated (Table 2), as also reported by other authors (yAGI & MINAMI (1990), SaSS et al. (1991), WANG et al. (1999)). That correlation was significant for the 24h-campaigns performed in the vegetative and reproductive stages in the depths of 2, 5 and 10cm, but also in the ripening stage at 2cm of depth. The CH4 emission rates over each 24h-campaign
were fit to Arrhenius equation as a function of soil temperature at 2cm of depth to calculate the activation energy (Ea): an Ea of 93.68±11.17 kJ mol-1 (r2=0.81,
p. value <0.05) was obtained for the 24h-campaign at the r2 stage, while values of 61.74±27.51kJ mol-1
(r2=0.14) and 42.69±15.02kJ mol-1 (r2=0.54, p. value
<0.05) were registered for the 24h-campaign in the ripening and vegetative stages, respectively. These values are near to the range of 50 to 130kJ mol-1
reported by Neue & SASS (1994). COSTA et al. (2008) reported Ea values in the range of 59 to 341kJ
mol-1 in a conventional planting system in South of
Table 1 - Average and ranges of air, water and soil temperatures at 2 cm, 5 cm and 10 cm of depth, and average methane emission rates
observed in the 24h-campaigns in three growing seasons of flood-irrigated rice cropping, calculated by a curve fit to local
regression model. The error corresponds to 95% confidence interval of the adjusted curve.
Plant stage
(*) Air Temp.oC Temp. Water oC Soil Temp, 2cmoC Soil Temp. 5 cm oC Soil Temp. 10cmoC
Average CH4
diurnal
emission rate (mg m-2 h-1)
---1stGrowing season (2003/2004)---
C1: Mar 15th, 2004 R2 23.6
(17.3 -31.7)
24.1 (21.6-25.4) 22.9 (21.7-23.7) 22.9 (22.1-23.5) 23.0
(22.4-23.4) 7,58±1,05 C2: apr 26th, 2004 R7-R8 20.5
(17.5–25.7) --
(1) 20.0
(19.1-20.8)
20.4
(19.6-21.1)
20.7
(20.1-21.4) 7.8±2.04 ---2ndGrowing season (2004/2005)---
C1: Mar 9th, 2005 R2 28.0
(18.4-36.7) 25.6 (22.2-29.5) 25.5 (23.0-28.5) 25.5 (23.9-27.5) 25.6
(24.6-26.8) 11.74±1.87
C2: Mar 23rd, 2005 R5 26.5
(21.9-34.1) 25.5 (24.2-28.2) 25.3 (24.1-26.5) 25.2 (24.2-26.2) 25.0
(24.3-25.6) 12.59±3.51
C3: apr 13th, 2005 R7 25.4
(16.5-38.2) 23.8 (21.2-27.0) 23.6 (22.2-25.0) 23.7 (22.6-24.6) 23.9
(23.0-24.6) 6.75±2.94 ---3rdGrowing season (2005/2006)--- C1: Feb 6th, 2006 V10 28.4
(21.4-41.1) 28.9 (25.2-37.4) 28.0 (25.7-30.7) 28.1 (26.3-30.3) 28.0
(26.2-30.3) 5.52±0.35
C2: Mar 20th, 2006 R2 25.0
(21.2-36.7) 26.0 (24.0-30.2) 25.9 (24.8-27.2) 25.8 (24.9-26.6) 25.6
(25.1-26.1) 13.22±2.61 C3: apr 10th, 2006 R6-R7 24.0
(18.5-34.8) 24.1 (22.4-26.7) 24.1 (23.4-24.9) 24.2 (23.6-25.4) 24.4
(23.8-25.5) 6.18±1.70
(*) according to Counce (2000); V10: vegetative stage, where there is a collar formation on leaf 10 on the main stem; r2: booting stage, with
the flag leaf collar; r5: at least one caryopsis on the main stem panicle is elongating to the end of the hull; r6: at least one caryopsis on the main stem panicle has elongated to the end of the hull; R7: grain drying: at least one grain of the main stem presents yellow pericarp; R8:
Brazil, under subtropical climate. The occurrence of maximum Ea values in the campaigns performed in
the r2 stage might be probably due to the increased amounts of root exudates as carbon source for CH4 formation (LINDAu et al., 1991; MINODA
& KIMurA, 1994). Solar radiation was weakly correlated with the CH4 emission rates throughout the
day. According to MeIJIDe et al. (2011), pressure gradients in the plant, which are driven by diurnal variation in light availability, may produce variation on the CH4 emissions according to the solar radiation.
Solar radiation may have an indirect effect on CH4
emissions since it affects temperature and light intensity, which are important parameters for the development of the plant. Other variables should be also considered to better explain CH4 diurnal fluxes,
for example, the gross photosynthesis and the soil microbiological dynamics.
CONCLUSION
Higher CH4 emission rates occur in the
afternoon and lower in the early morning in the studied area. Soil temperature at 2cm of depth is highly associated to the CH4 fluxes in all studied stages, so
that it is a key parameter to be considered in gas flux measurements in paddy fields. The CH4 emission
activation energy in response to this parameter was higher in the stage r2. Also, all the environmental parameters presented correlation with the CH4 fluxes
in the stage r2, when methane emission is typically high along the flooded rice growth season and possibly making such correlations more evident. Based on the daily CH4 average flux over each 24h-campaign, the
most appropriated average time for gas collection
in the region is at 12:11:15a.m.±01:14:16 (mean ± standard deviation) and 09:05:49p.m.±01:29:04.
ACKNOWLEDGEMENTS
The authors are grateful to the Ministry of Science and Technology (MCT) for the financial aid and to the experiment Station of APTA for the support during the experiments.
DECLARATION OF CONFLICTING INTERESTS
The authors declare no conflict of interests.
REFERENCES
AuLAKH, M.S. et al. Impact of root exudates of different cultivars and plant development stages of rice (Oryza sativa L.)
on methane production in a paddy soil. Plant and Soil, v.230,
p.77–86, 2001. Available from: <https://link.springer.com/article/1 0.1023%2FA%3A1004817212321>. Accessed: Jun. 01, 2017. doi:
10.1023/a:1004817212321.
COSTA, F.S. et al. Diurnal variation of methane emission from a paddy field under rice cultivation in the Southern Brazil. Ciência Rural,
v. 38, p. 2049-2053, 2008. Available from: <http://www.scielo.br/ scielo.php?script=sci_arttext&pid=S0103-84782008000700041&ln
g=pt&tlng=pt>. Accessed: Jun. 01, 2017. doi: 10.1590/S0103-84782008000700041.
COuNCe,P.A. et al. uniform, Objective, and Adaptive System for expressing rice Development. Crop Science, v. 40, p. 436-443,
2000. Available from: <https://dl.sciencesocieties.org/publications/ cs/abstracts/40/2/436>. Accessed: Jun. 01, 2017. doi: 10.2135/ cropsci2000.402436x.
DeNIer VAN Der GON, H.A.C. et al. release of entrapped methane from wetland rice fields upon soil drying. Global Biogeochemical
Cycles, 10:1-7, 1996. Available from: <http://onlinelibrary.wiley.
com/doi/10.1029/95GB03460/abstract;jsessionid=89C83870Fe74 F3e0062AAD6ee79FCFB2.f04t01>. Accessed: Jun. 01, 2017. doi: 10.1029/95GB03460.
Table 2 - Correlation coefficients between CH4flux and solar radiation, air, water and soil temperatures in a rice cropping area under
continuous flood-irrigation management system.
---Pearson's coefficients of correlation (degrees of freedom)---
environmental parameters ---rice growth stages---
V10 R2 R5-r8 (1)
Solar radiation -0,41 (7) 0,34 (24)* 0,24 (33)
Air temperature (2) -0,18 (7) 0,55 (24)* 0,53 (33)*
Water temperature 0.31 (7) 0.82 (17)* 0.72 (23)*
Soil temperature (2cm depth) 0.75 (7)* 0.89 (16)* 0.40 (30)*
Soil temperature (5cm depth) 0.78 (7)* 0.84 (16)* 0.33 (30)
Soil temperature (10cm depth) 0.75 (7)* 0.75 (16)* 0.25 (30)
eMBrAPA. eMPreSA BrASILeIrA De PeSQuISA AGrOPeCuÁrIA. Sistema Brasileiro de Classificação de
Solos. 3ed. Brasília: eMBrAPA, 2013. 353p.
HATALA, J.A. et al. Gross ecosystem photosynthesis causes a diurnal pattern in methane emission from rice. Geophysical
Research Letters, v. 39, L06409, 2012. Available from: <http://
onlinelibrary.wiley.com/doi/10.1029/2012GL051303/abstract>.
Accessed: Jun. 01, 2017. doi: 10.1029/2012GL051303.
KNOx, S.H. et al. Biophysical controls on interannual variability in ecosystem-scale CO2 and CH4 exchange in a California rice paddy. Journal
of Geophysical Research,v.21, n. 3, p.978-1001, 2016. Available from:
<http://onlinelibrary.wiley.com/doi/10.1002/2015JG003247/abstract>.
Accessed: Jun. 01, 2017. doi: 10.1002/2015JG003247.
LINDAu et al. effect of urea fertilizer and environmental factors on CH4 emissions from a Louisiana, uSA, rice field. Plant and Soil, v. 136, p. 195-203, 1991. Available from: <https://link. springer.com/article/10.1007%2FBF02150050>. Accessed: Jun. 01, 2017. doi: 10.1007/BF02150050.
MeIJIDe, A. et al. Seasonal trends and environmental controls of methane emissions in a rice paddy field um Northern Italy.
Biogeosciences, 8:3809-38221, 2011. Available from: <https://
www.biogeosciences.net/8/3809/2011/>. Accessed: Jun. 01, 2017.
doi: 10.5194/bg-8-3809-2011.
MINODA, y.; KIMurA, M. Contribution of photosynthesized carbon to the methane emitted from paddy fields. Geophysical
Research Letters, v. 21, p. 2007-2010, 1994. Available from:
<http://onlinelibrary.wiley.com/doi/10.1029/94GL01595/
abstract>. Accessed: Jun. 01, 2017. doi: 10.1029/94GL01595. MyHre, G. et al. Anthropogenic and natural radiative forcing. In: Stocker, T.F. et al. (eds). Climate change 2013: the physical science
basis. Cambridge university Press, 2013. Chap. 8, p. 659-740.
Available from: <https://www.ipcc.ch/pdf/assessment-report/ar5/wg1/ WG1Ar5_Chapter08_FINAL.pdf>. Accessed: Aug. 15, 2017. Neue, H.u. et al. Factors and processes controlling methane emissions from rice fields. Nutrient Cycling in Agroecosystems, v.
49, p. 111-117, 1997. Available from: <https://link.springer.com/articl e/10.1023%2FA%3A1009714526204>. Accessed: Jun. 01, 2017. doi:
10.1023/a:1009714526204.
Neue, H.u.; SASS, r.L. Trace gas emissions from rice fields.
Environmental Science Research, v. 48, p. 119-145, 1994. Available from:
<https://link.springer.com/chapter/10.1007%2F978-1-4615-2524-0_8>.
Accessed: Jun. 01, 2017. doi: 10.1007/978-1-4615-2524-0_8.
r COre TeAM, R. A Language and Environment for Statistical
Computing. r Foundation for Statistical Computing, Vienna, Austria.
Available from: <http://www.r-project.org/, 2015>. Acessed: Jun. 01, 2017. SASS, r.L. et al. Methane emission from rice fields as influenced by solar radiation, temperature, and straw incorporation. Global
Biogeochemical Cycles, v.5, p.335-350, 1991. Available from:
<http://onlinelibrary.wiley.com/doi/10.1029/91GB02586/
abstract>. Accessed: Jun. 01, 2017. doi: 10.1029/91GB02586. SASS, r. et al. Spatial variability in methane emissions from a Texas rice field with some general implications. Global
Biogeochemical Cycles, v. 16, p.15-1–15-7, 2002. Available from:
<http://onlinelibrary.wiley.com/doi/10.1029/2000GB001355/
abstract>. Accessed: Jun. 01, 2017. doi: 10.1029/2000GB001355.
SATPATHy, S.N. et al. Diurnal variation in methane efflux at different growth stages of tropical rice. Plant and Soil, v.195, p. 267-271, 1997. Available from:
<https://link.springer.com/article/10.1023%2FA%3A1004202515767>.
Accessed: Jun. 01, 2017. doi: 10.1023/A:1004202515767.
SCHüTz, H. et al. Processes involved in formation and emission of methane in rice paddies. Biogeochemistry, v. 7, p. 33-53, 1989. available
from: <https://link.springer.com/article/10.1007%2FBF00000896>.
Accessed: Jun. 01, 2017. doi: 10.1007/BF00000896.
SCHüTz, H. et al. Influence of soil temperature on methane emission from rice paddy field. Biogeochemistry, v. 11, p. 77-95, 1990. available
from: <https://link.springer.com/article/10.1007%2FBF00002060>.
Accessed: Jun. 01, 2017. doi: 10.1007/BF00002060.
TSeNG et al. Determination of methane and carbon dioxide fluxes during the rice maturity period in Taiwan by combining profile and eddy covariance measurements, Agricultural Forest Meteorology, v. 150, p. 852–859, 2010. Available from: <https://www.sciencedirect.
com/science/article/pii/S0168192310001152?via%3Dihub>.
Accessed: Jun. 01, 2017. doi: 10.1016/j.agrformet.2010.04.007. VILLeLA, O.V.; FurLANI JuNIOr, e. Seedling age effects on rice cultivars development. Bragantia, v. 55, p. 329-339, 1996.
Available from: <http://www.scielo.br/scielo.php?script=sci_
arttext&pid=S0006-87051996000200019&lng=pt&tlng=pt>.
Accessed: Jun. 01, 2017. doi: 10.1590/S0006-87051996000200019. WANG, z.P. et al. Soil redox and pH effects on methane production in a flooded rice. Soil Science Society of American Journal,
57:382-385, 1993. Available from: <https://dl.sciencesocieties.org/ publications/sssaj/abstracts/57/2/SS0570020382>. Accessed: Jun. 01, 2017. doi: 10.2136/sssaj1993.03615995005700020016x. WANG, B. et al. The effect of controlled soil temperature on diel CH4 emission variation. Chemosphere, v. 35, n. 2083-2092, 1997.
Available from: <https://www.sciencedirect.com/science/article/ pii/S0045653597002579?via%3Dihub>. Accessed: Jun. 01, 2017. doi: 10.1016/S0045-6535(97)00257-9.
WANG, B. et al. Factors controlling diel patterns of methane emission via rice.
Nutrient Cycling in Agroecosystems, v.53: 229-235, 1999. Available from:
<https://link.springer.com/article/10.1023%2FA%3A1009753923339>.
Accessed: Jun. 01, 2017. doi: 10.1023/A:1009753923339.
YagI, K.; MINaMI, K. effect of organic matter application on
methane emission from some Japanese paddy fields. Soil Science
and Plant Nutrition, v. 36, p. 599-610, 1990. Available from: <http://
www.tandfonline.com/doi/abs/10.1080/00380768.1990.10416797>.
Accessed: Jun. 01, 2017. doi: 10.1080/00380768.1990.10416797. yANG, S.S.; CHANG, H.L. Diurnal variation of methane emission from paddy fields at different growth stages of rice cultivation in
Taiwan. Agriculture, Ecosystems and Environment, v. 76, p. 75-84,
1999. Available from: <https://www.sciencedirect.com/science/article/ pii/S0167880999000742?via%3Dihub>. Accessed: Jun. 01, 2017. doi: 10.1016/S0167-8809(99)00074-2.
yOSHIDA, S. Fundamentals of rice crop science. Phillipines: The International rice research Institute, 1981. 269p.
WASSMANN, r. et al. Temporal patterns of methane emissions from wetland rice fields treated by different modes of N application Journal
of Geophysical Research, v. 99, p.16,457-16,462, 1994. available