www.biogeosciences.net/11/5235/2014/ doi:10.5194/bg-11-5235-2014
© Author(s) 2014. CC Attribution 3.0 License.
Australian net (1950s–1990) soil organic carbon erosion:
implications for CO
2
emission and land–atmosphere modelling
A. Chappell1, N. P. Webb2, R. A. Viscarra Rossel1, and E. Bui1
1CSIRO Land and Water and Sustainable Agriculture National Research Flagship, G.P.O. Box 1666,
Canberra, ACT 2601, Australia
2USDA-ARS Jornada Experimental Range, MSC 3 JER, NMSU, P.O. Box 30003, Las Cruces,
NM 88003-8003, USA
Correspondence to:A. Chappell ([email protected])
Received: 7 April 2014 – Published in Biogeosciences Discuss.: 12 May 2014
Revised: 4 August 2014 – Accepted: 2 September 2014 – Published: 29 September 2014
Abstract. The debate remains unresolved about soil ero-sion substantially offsetting fossil fuel emisero-sions and act-ing as an important source or sink of CO2. There is
lit-tle historical land use and management context to this de-bate, which is central to Australia’s recent past of Euro-pean settlement, agricultural expansion and agriculturally-induced soil erosion. We use “catchment” scale (∼25 km2)
estimates of137Cs-derived net (1950s–1990) soil
redistribu-tion of all processes (wind, water and tillage) to calculate the net soil organic carbon (SOC) redistribution across Aus-tralia. We approximate the selective removal of SOC at net eroding locations and SOC enrichment of transported sed-iment and net depositional locations. We map net (1950s– 1990) SOC redistribution across Australia and estimate ero-sion by all processes to be ∼4 Tg SOC yr−1, which
repre-sents a loss of ∼2 % of the total carbon stock (0–10 cm) of Australia. Assuming this net SOC loss is mineralised, the flux (∼15 Tg CO2-equivalents yr−1)represents an
omit-ted 12 % of CO2-equivalent emissions from all carbon pools
in Australia. Although a small source of uncertainty in the Australian carbon budget, the mass flux interacts with energy and water fluxes, and its omission from land surface mod-els likely creates more uncertainty than has been previously recognised.
1 Introduction
The estimated effect of soil redistribution on the carbon cycle ranges from an annual global net source of 4.4 Pg CO2yr−1
(Lal, 2003) to a global net sink of 7.3 Pg CO2yr−1(Stallard,
1998). Uncertainty in these estimates is largely attributed to mineralisation rates in the soil organic carbon (SOC) pools. The mineralisation rates are expected to either increase due to the breakdown of soil structure during erosion (Lal and Pi-mentel, 2008) or reduce as a consequence of SOC burial dur-ing deposition (Stallard, 1998). Based on the argument that SOC is dynamically replaced in eroding regions (Harden et al., 1999), several researchers have used studies of water and tillage erosion at the field/hillslope scale to support the tenet that soil erosion is acting as a net biospheric carbon sink (cf. Van Oost et al., 2007; Dlugoss et al., 2012). Berhe and Kle-ber (2013) suggested that the mass balance of carbon inputs and outputs must be considered when inferring protection of soil organic matter against decomposition in dynamic land-scapes (Berhe et al., 2007). While the debate about whether SOC erosion is a source or sink of CO2has raised awareness
of the significance of soil erosion for carbon cycling (Doet-terl et al., 2012B) and carbon accounting (Sanderman and Chappell, 2012), the impact of erosion on the carbon cycle is yet to be resolved, and it appears that changes in land use and management have been neglected (Chappell et al., 2012).
a successful response to soil erosion on agricultural land (cf. Montgomery, 2007). These changes to land use and manage-ment have created phases in the recent soil erosion history. For example, European settlement (from 1788) transformed the Australian environment with extensive clearing of native vegetation for agricultural production, primarily pastoralism and, to a lesser extent, cropping (McAlpine et al., 2009). Marx et al. (2014) associated agricultural expansion between 1880 and 1990, compounded by droughts and the dust bowl era, with increased soil erosion. Conservation agriculture im-plemented in the 1980s considerably reduced dust emission (Marx et al., 2014) and 137Cs-derived net (1990–2010) soil erosion (in SE Australia; Chappell et al., 2012). Evidently, SOC redistribution is a function of its residence times in the landscape, which is dependent on the distribution and change in land use and management.
Here we focus on the later part of agricultural expansion in Australia (1950s–1990) and quantify SOC erosion across the continent. We account for all erosion processes (wind, water and tillage), specifically including wind erosion and dust emission, which has the potential to preferentially re-move SOC rapidly from terrestrial ecosystems (Webb et al., 2012, 2013; Chappell et al., 2013). Our estimates at the land-scape or “catchment” scale (e.g.>1 km2)use measurements from across Australia at the hillslope scale but do not rely on extrapolations based on modelled gross erosion, which typically exclude deposition processes and hence neglect the balance of C inputs and outputs (net SOC redistribution).
The objective of this paper is to develop the first estimate of the impact of net soil redistribution by all processes on soil organic carbon (SOC) stocks across Australia. We use recent “catchment” scale (∼25 km2)estimates of137Cs-derived net (1950s–1990) soil redistribution and SOC for Australia to calculate SOC net redistribution (carbon erosion). Our esti-mates of carbon erosion make explicit (a) the need to sepa-rately account for erosion and deposition and (b) the enrich-ment factor to account for the preferential removal by erosion of the fine, nutrient- and carbon-rich material from the soil. We classify total Australian net SOC redistribution by land use to demonstrate its impact for different current economic sectors. The significance for Australia is that there are no continental estimates of SOC redistribution. Consequently, it is expected that these estimates will reduce uncertainty and improve accuracy in carbon accounting with implications for greenhouse gas abatement and carbon sequestration storage and raise awareness of the agriculturally-induced impact of soil erosion on landscapes, agricultural systems and land– atmosphere interactions in land surface models.
2 Methods
2.1 Soil organic carbon redistribution model
Yan et al. (2005) provided a basis for further research on the estimation of eroded carbon. They suggested multiplying
137Cs-derived wind erosion rates by the amount of carbon in
the surface soil horizons or topsoil to estimate the annual av-erage SOC loss to wind erosion in China. We modified the model of Yan et al. (2005; Eq. 1) by explicitly including an enrichment factor and separating the outcome of soil redis-tribution for net erosion (Ceros; t C ha−1yr−1):
Ceros=E×OCe×Pe, (1)
where E is 137Cs-derived net soil redistribution (t soil ha−1yr−1), OC
e is the gravimetric ratio of
or-ganic carbon in the soil (gC/g soil) close to, or at, the source of erosion, andP is the enrichment factor (where, relative to the originating soil, P >1 indicates an enrich-ment andP <1 indicates a depletion) that accounts for the selective removal of SOC from the topsoil by wind erosion (Webb et al., 2012, 2013).
At locations where the outcome of all erosion events from all processes is net deposition, the modified model (Eq. 1) is inadequate. This is because material containing organic carbon deposited at a particular location has travelled from another (source) location where it likely preferentially re-moved organic carbon. During transport the coarser material will have been removed, leaving only the finest (nutrient and SOC-rich) fraction to reach its destination. Consequently, we require an additional model to handle the situation of SOC net deposition (Cdep; tC ha−1yr−1):
Cdep=D×OCd×Pd, (2)
where D is 137Cs-derived net soil deposition (t soil ha−1yr−1). The implication of Eq. (2) is that, for
the depositional locations, we need to know the SOC concentration (OCd) and the enrichment/depletion (Pd) of
the material at its source, i.e. the source and sink must be linked. A justification for the values used in these terms is provided in Sect. 2.5.
2.2 137Cs-derived net (1950s–1990) soil redistribution
of the difficulties with long-term erosion monitoring pro-grammes because it provides retrospective information on medium-term (ca. 40 years) net soil redistribution (Zapata, 2003) due to all processes including wind erosion and dust emission (Van Pelt, 2013). Although some limitations exist (Walling and Quine, 1991; Chappell, 1999; Parsons and Fos-ter, 2011), the137Cs technique has been applied successfully in many countries at the field scale (Zapata, 2003) and used to investigate at the field scale whether accelerated erosion pro-cesses act as a source or a sink of atmospheric CO2(Quine
and Van Oost, 2007).
Samples of 137Cs have been combined with regionalised mapping techniques to make estimates over large areas and regions (de Roo, 1991; Chappell, 1998; Chappell and War-ren, 2003) culminating recently in a map of Australian net soil redistribution for the continent (Chappell et al., 2011a, b). Statistically significant relationships between 137Cs and SOC have been established for agricultural regions (e.g. Ritchie and McCarty, 2003; Ritchie et al., 2007; Wei et al., 2008), providing support for the movement of 137Cs and SOC along the same physical pathways and through the same physical mechanisms (Martinez et al., 2009). These develop-ments with the 137Cs technique provide the opportunity to consider the net soil redistribution, of all erosion and deposi-tion processes, at the catchment scale over large areas.
The national reconnaissance survey of soil erosion in Aus-tralia was performed at the hillslope scale (Loughran et al., 2004). That measurement survey was used to make predic-tions of 137Cs-derived net (1950s–1990) soil redistribution every 5 km across Australia (Chappell et al., 2011b). In con-trast to gross erosion estimates typical of plots, traps and erosion models (e.g. Universal Soil Loss Equation), the ap-proach used here estimates the net outcome of all erosion and deposition processes within the period 1950s–1990 at each pixel across Australia. We used these estimates to iden-tify locations at the catchment scale which were either net (1950s–1990) eroding or net depositing (including stable) for use in the SOC redistribution model (Eqs. 1 and 2). The summation of these estimates for different land management types, regions and ultimately across the continent of Aus-tralia provides an estimate of the net outcome for the terres-trial ecosystem.
2.3 Soil organic carbon stocks
The Australian soil visible–near-infrared spectroscopic database (Viscarra Rossel and Webster, 2012) was used to predict the soil organic carbon (SOC) and bulk density (Bd; g cm−3) of 4000 surface soil samples (0–10 cm) to derive
the soil organic carbon density (SOCden) map. The soil
sam-ples originated from CSIRO’s National Soil Archive, the Na-tional Geochemical Survey of Australia, and other regional-and field-scale surveys of the Australien states. Thus, SOCden
(t ha−1)was calculated by
SOCden=OC×Bd×d, (3)
where d is the depth (cm) from where the samples were taken. The SOCdenvalues were mapped by ordinary kriging
on an approximate 5 km grid to coincide with the other maps.
2.4 Carbon enrichment by size selective erosion
The carbon enrichment factor is a major source of uncer-tainty in estimating SOC redistribution because there is con-siderable spatial and temporal variability in SOC enrichment of eroded sediment (Schiettecatte et al., 2008; Wang et al., 2010; Nadeu et al., 2011; Webb et al., 2012). Owens and Walling (1998; p. 193) suggested that a good approximation to the enrichment ratio is based on a comparison of the par-ticle size composition of the eroded material with that of the topsoil. Chappell et al. (2013) recently produced a map of SOC enrichment in dust for Australia by assuming that SOC enrichment is proportional to the enrichment of soil fines, estimated from a physically based model of particle size se-lectivity:
P =eroded SOC/SOC in soil (dimensionless). (4) Chappell et al. (2013) had spatial information on SOC but little information on eroded SOC (D), and so approximated
P usingP′ as
P′=Df/Sf(dimensionless), (5)
where Df is mass <22 µm divided by the mass ≤52 µm andSf is the equivalent ratio for the soil surface: mass<
22 µm/mass<52 µm. The ratioP′ estimates the proportion of fine material in transport. We consider it a reasonable first approximation to assume that the enrichment ratio for wind erosion (based on particle size) is also a good first approxi-mation for enrichment by wind and water processes. In the absence of any other data, we use that Australian wind ero-sion enrichment ratio to estimateP in the SOC redistribution model (Eqs. 1 and 2).
2.5 Estimation of net (1950s–1990) soil organic carbon redistribution
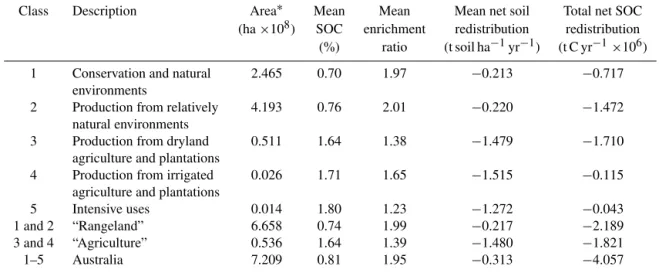
Table 1.Calculation of soil organic carbon net (1950s–1990) redistribution and its proportion for land use classes across Australia.
Class Description Area∗ Mean Mean Mean net soil Total net SOC (ha×108) SOC enrichment redistribution redistribution
(%) ratio (t soil ha−1yr−1) (t C yr−1×10⁶)
1 Conservation and natural 2.465 0.70 1.97 −0.213 −0.717 environments
2 Production from relatively 4.193 0.76 2.01 −0.220 −1.472 natural environments
3 Production from dryland 0.511 1.64 1.38 −1.479 −1.710 agriculture and plantations
4 Production from irrigated 0.026 1.71 1.65 −1.515 −0.115 agriculture and plantations
5 Intensive uses 0.014 1.80 1.23 −1.272 −0.043 1 and 2 “Rangeland” 6.658 0.74 1.99 −0.217 −2.189 3 and 4 “Agriculture” 0.536 1.64 1.39 −1.480 −1.821 1–5 Australia 7.209 0.81 1.95 −0.313 −4.057
∗Using an equal area projection the area of a pixel is approximately 4.53 km×4.87 km≈22.03 km2, equivalent to 2203 ha.
are well established as a dust source region in Australia’s rangelands (McTainsh, 1989). The Lake Eyre basin, in the arid continental interior of Australia, contains considerably smaller amounts of SOC than the coastal regions. Conse-quently, to implement Eq. 2, we assumed that OCd=0.74 %
andPd=1.99 (values from “Rangeland” in Table 1) and
es-timated SOC redistribution.
To place these maps into context, at each location across Australia we divided the SOC net redistribution by the SOC stock (0–10 cm) and multiplied by 100 to obtain a percent-age. This process determined the proportion of SOC yr−1
re-moved by the net (1950s–1990) outcome of all erosion and deposition processes.
2.6 Australian land use
The Bureau of Rural Sciences provides a series of land use maps of Australia. The agricultural land uses are based on the Australian Bureau of Statistics’ agricultural censuses and surveys for the years mapped. The spatial distribution of agricultural land uses was determined using Advanced Very High Resolution Radiometer (AVHRR) satellite im-agery with ground control data (Knapp et al., 2006). These data were supplied at a 0.01◦
grid size with geographical co-ordinates (GDA94). The summary map provides an integer grid which represents an aggregation of the original attribute table which defines the agricultural commodity group, irriga-tion status and land use according to the Australian Land Use and Management Classification (ALUMC), version 5 (Ta-ble 1).
We followed Chappell et al. (2011b) and used land use data from 1992/1993, which are closest in time to the na-tional 137Cs reconnaissance survey. These data were re-sampled to an approximately 5 km grid for compatibility with the other data used here. We then calculated the SOC
net redistribution for each land use zone and compared their magnitudes to sectoral contributions of the national carbon account.
3 Results
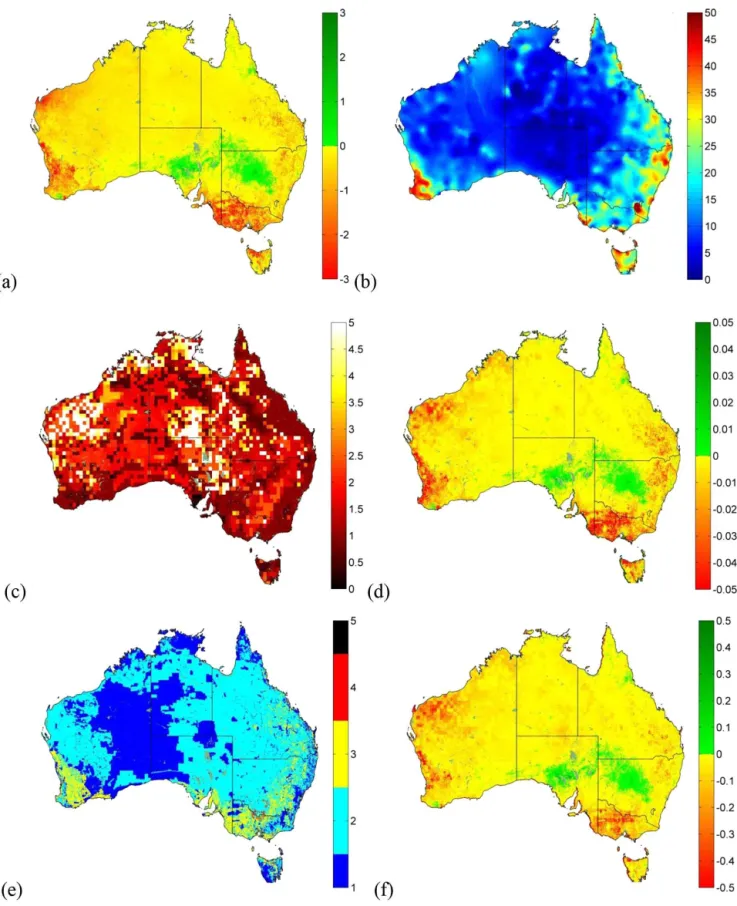
Our map of 137Cs-derived net (1950s–1990) soil redistri-bution shows that nearly 5 times more soil was lost from the predominantly coastal, cultivated regions than from the mainly uncultivated rangeland interior of Australia (Fig. 2a) (Chappell et al., 2011). The cultivated regions of Australia generally have larger amounts of SOC than the rangelands (Fig. 2b). The pattern of SOC enrichment (Fig. 2c) is com-plicated by the highly variable soil types, textures and parti-cle size distributions. Nevertheless, the SOC enrichment map shows that the greater part of Australia has associated enrich-ment values of 1–1.5. Large SOC enrichenrich-ment values (up to 5) are found in the rangeland interior and in northern Australia at locations where net soil erosion is small. However, there is also a large SOC enrichment area in the west of Western Australia (WA) in the Gascoyne–Pilbara region. In contrast, SOC depletion (P <1), where eroded SOC is smaller than SOC in the parent soil, occurs in patches throughout Aus-tralia and most notably in the sandy soils of the Wheat Belt region of WA. These enrichment values are consistent with the review of enrichment ratios provided recently by Webb et al. (2012). The SOC net redistribution map (Fig. 2d) is there-fore a product of these previous maps in accordance with Eqs. (1) and (2). The SOC net deposition component equals the net soil deposition plus the deposition enrichment factor of∼0.015 (OCe=0.0074 multiplied byPe=1.99; values
from “Rangeland” in Table 1).
Figure 1.Map showing net deposition relative to floodplains and alluvial flats as mapped by Gallant and Dowling (2003).
potential to contribute considerably to SOC redistribution (Fig. 1e). Examining Australian SOC net redistribution on the basis of land use is instructive. Table 1 demonstrates that although rangeland regions (classes 1 and 2) contain only half as much topsoil SOC, their mean net soil redistribution is approximately 7 times smaller than that of the cultivated coastal regions (largely class 3). The cultivated regions con-tain the greatest amount of SOC and consequently produce areas with an “Agriculture” land use designation dominating the SOC net redistribution of Australia (Table 1).
The amounts of SOC net erosion appear substantial. Their proportions of SOC stock are all less than 1 % yr−1because
of the relatively large SOC stock (Fig. 2f). The spatial distri-bution of proportional loss matches that of net soil redistri-bution and SOC net redistriredistri-bution. Cultivated regions, with the largest erosion and the largest SOC, have the greatest proportion of SOC stock removed. The total SOC net re-distribution for Australia is on average−4.06×10⁶tC yr−1
(−4.06 Tg C yr−1; Table 1) or approximately−1.63×10⁸tC
(0.163 Pg C) for the period 1950s–1990. The Australian SOC stock (0–10 cm) amounts to 7.55×10⁹t C (7.55 Pg C), which suggests that, on average across Australia,
approxi-mately 2 % of SOC stock (0–10 cm) was removed from the land surface by soil erosion over this ca. 40-year period.
4 Discussion
4.1 Soil erosion and Australian land surface dynamics
An Australian survey of approximately 200 hillslope pro-files showed net soil loss, which, aggregated across Aus-tralia, indicated that 60 % of sites had net soil losses greater than 1 t ha−1yr−1(Loughran et al., 2004). The regionalised
net soil redistribution estimates of Chappell et al. (2011b; p. 17) used here provide more representative statistics than the original survey for soil redistribution across Australia. Only approximately 7 % of Australia had net soil losses of more than 1 t ha−1yr−1. Despite these findings, it may be argued
Figure 2.Maps for Australia showing(a)137Cs-derived median net (1950s–1990) soil redistribution (t soil ha−1yr−1). Positive values
rep-resent sites of net gain, while negative values are those of net loss.(b)Soil organic carbon (SOC) stocks (tC ha−1; 0–10 cm).(c)Enrichment
ratio at 50 km resolution.(d)SOC net redistribution (tC ha−1yr−1).(e)Land use (see Table 1).(f)SOC net redistribution as a proportion
It is reasonable to conceive of soil and SOC moving over time through a series of landscape stores before reaching a river network. In this conception, SOC residence times are unspecified, and yet it is widely accepted that old, weathered, low-relief landscapes (like Australia; Wasson et al., 1996; Lu et al., 2003) have small sediment delivery ratios and there-fore small SOC net deposition (Roehl, 1963; Walling, 1983). In contrast to this general conception, our results show for the period 1950s–1990 that there was a SOC net loss for the majority of Australian hillslopes at the catchment scale (Chappell et al., 2011b). We contend that the general concep-tion does not account for land surface dynamics influenced strongly by changes in land use and management, which are captured in our data. European settlement (from 1788) trans-formed Australia’s environment with extensive clearing of native vegetation for agricultural production, primarily pas-toralism and, to a lesser extent, cropping (McAlpine et al., 2009). Marx et al. (2014) used cores from a mire in the Snowy Mountains of Australia to reconstruct the past envi-ronment and used dust deposition as a proxy for soil erosion to show a rapid increase after 1879 associated with agricul-tural expansion 1880–1989 and the onset of agriculagricul-turally- agriculturally-induced wind erosion from the Murray–Darling Basin com-pounded by droughts (Federation, 1895–1903; 1911–1915, 1970s and 1980s) and the dust bowl era of the late 1930s and early 1940s.
Conservation agriculture has had a significant impact on soil erosion around the world (Montgomery, 2007). In Aus-tralia these practices and broader soil conservation measures were implemented in the 1980s and since then appear to have considerably reduced dust emission (Marx et al., 2014) and net (1990–2010) soil erosion (in SE Australia) despite con-siderable spatial variation remaining (Chappell et al., 2012). Notwithstanding this broad assessment, conservation agri-culture (minimum/zero tillage) may not necessarily reduce soil erosion in some regions. This latter phase (1990–present) of agricultural stabilisation may well conform to the gen-eral conception of small sediment delivery ratios and slow reworking of sediments. However, it will likely take some time for the ecosystem to adjust to this new (dynamic) equi-librium and hence for SOC to develop the expected net SOC sink. SOC redistribution is a function of its residence times in the landscape, which must be contextualised for specific periods, land use change and management policies, etc. We believe our results provide a reasonable first approximation of the catchment-scale SOC net redistribution for Australia during the 1950s–1990.
4.2 Net soil redistribution (erosion and deposition) by all processes
To provide accurate and precise estimates of SOC net redis-tribution, it is essential to account for all erosion and depo-sition processes. The use of 137Cs is evidently valuable in this respect. However, samples of 137Cs must be obtained
to represent the underlying population of soil redistribution processes and the scale at which they impact the carbon bud-get. Although it is logistically straightforward to conduct ex-periments at the field scale, estimates of SOC net redistri-bution are required at the catchment scale and larger when making regional/continental-scale assessments. It does not necessarily follow that investigations of SOC redistribution at the field scale (perhaps dominated by water erosion) are representative of the outcomes of the processes at the catch-ment scale (Doetterl et al., 2012a) by the combined effect of wind, water and tillage erosion. Our regionalised approach used here removes bias due to sampling (some fields and not others) and ensures that estimates at the catchment scale rep-resent the small-scale variation.
Lal (2003; Table 11) estimated gross SOC erosion for Oceania at 20–40 Tg SOC yr−1. Van Oost et al. (2007)
es-timated the gross SOC erosion by water and tillage for Ocea-nia cropland and pastureland at 5.1 and 19.8 Tg SOC yr−1,
respectively. Doetterl et al. (2012) reduced their previous collaborative estimate of the gross SOC erosion by wa-ter and tillage for Oceania cropland and pastureland at 4.9 and 10.5 Tg SOC yr−1, respectively. Dymond (2010)
esti-mated that gross SOC flux for New Zealand was a sink of 3.1 Tg SOC yr−1 due primarily to soils regenerating from
SOC erosion to the sea floor, where SOC was assumed per-manently buried.
It is difficult to reconcile the differences between gross erosion and net (137Cs-derived) erosion estimates (cf. Chap-pell et al., 2011b; p. 20). However, we expect our results to be considerably smaller than gross SOC erosion esti-mates because they include deposition within the landscape. It is therefore encouraging that our results are consider-ably smaller than the gross SOC estimates of Lal (2003). It is also encouraging that our net SOC erosion results for predominantly cropland (−1.82 Tg SOC yr−1)and rangeland
(−2.19 Tg SOC yr−1) are smaller than the gross SOC
ero-sion results of Van Oost et al. (2007). Their results for (and the subsequent reduction by Doetterl et al., 2012b) show an order of magnitude larger SOC loss from pasture regions in Oceania, which contrasts markedly with our results for Aus-tralia (1950s–1990). However, their global model estimates for New Zealand and Papua New Guinea explain about 86 % of the gross SOC erosion on pasturelands for Oceania, with Australia at −2.86 Tg C yr−1 (K. Van Oost, personal
com-munication, 2014). This partition reveals consistency in our net SOC erosion estimates for Australian rangeland being smaller than that gross SOC erosion estimate.
For the Australian terrestrial carbon budget, Haverd et al. (2013) estimated the gross loss of carbon due to river-ine and dust transport processes to be approximately 2.3 and 1 Tg SOC yr−1, respectively (with 100 % uncertainty).
Our physically based model estimates of gross SOC dust emission (2000–2011) was 1.6 Tg SOC yr−1(Chappell et al.,
et al., 2014). However, during the previous period of agri-cultural expansion and agriagri-culturally-induced soil erosion, it was likely much larger (Marx et al., 2014), and could be approximated by our estimate of gross SOC dust emission. Subtracting that rate (1.6 Tg SOC yr−1)from our estimate of
total SOC net redistribution for Australia (−4.06 Tg C yr−1)
suggests that net SOC erosion by water was (1950s–1990) about 2.5 Tg SOC yr−1.
5 Conclusions and implications for SOC cycling and SOC accounting
We find that net (1950s–1990) SOC redistribution for Aus-tralia is −4.06 Tg SOC yr−1. Assuming that this material
has been mineralised during transport by wind, water and tillage the net redistribution for Australia amounts to a loss of 14.87 Tg CO2-equivalents yr−1(using an elemental to
molecular mass conversion factor of 44/12). We acknowl-edge that this assumption neglects the fate of SOC in the at-mosphere, water courses and ultimately the oceans; its im-pact on gross primary productivity of forests; or its direct ef-fect on radiative forcing. Biochemical reactions of SOC dust in the atmosphere and oceans may also counter the effects of SOC mineralisation that result in CO2production
(Chap-pell et al., 2013). Even if the greater part of the SOC is not mineralised, a significant proportion is likely deposited in the marine environment and therefore not an atmospheric gain, but a terrestrial loss nonetheless. More work is required to elucidate the types and significance of these processes to de-termine the fate and in particular the impact of SOC dust.
It has been argued that the disturbance of SOC by erosion may accelerate its mineralisation and its conversion to CO2,
and support a hypothesis that SOC erosion is a source of CO2
(Lal and Pimentel, 2008). Conversely, Harden et al. (1999) argued that erosion, transport and deposition of soil should act as a net carbon sink due to the dynamic replacement of SOC in eroding regions. Several studies have supported this latter hypothesis to suggest that soil erosion is acting as a biospheric net sink of CO2(cf. Van Oost et al., 2007).
Fol-lowing the logic of these hypotheses, it is difficult to avoid a conclusion here that during the period of agricultural expan-sion agriculturally-induced eroexpan-sion net (1950s–1990) SOC erosion is a source of CO2for Australia.
Evidently, the losses of SOC due to soil erosion are of lit-tle consequence to the Australian carbon budget (Haverd et al., 2013). However, soil erosion and particularly the dynam-ics associated with the historical phases of agricultural ex-pansion and stabilisation (Montgomery, 2007; Marx et al., 2014) are omitted from the land surface model used for the Australian carbon budget (CABLE/BIOS2). The implica-tions are that substantial loss over time of organic-rich top-soil and changes to the top-soil albedo, top-soil temperature, mois-ture holding capacity and hydraulic properties have been omitted. That the CABLE/BIOS2 model has been shown to
perform adequately without these fundamental dynamics in land–atmosphere interactions suggests to us that the tuning of the model is likely hiding the erosion impact. We believe that including a soil erosion component in this and other land surface models will likely provide a straightforward mecha-nism to demonstrate the impact of land use and management dynamics on land–atmosphere interactions.
Australian national carbon accounting provides the CO2
-equivalent emissions for national land use change, which rep-resents total emissions from all carbon pools (below- and above-ground biomass, soil carbon and litter). Between 1988 and 1990 these emissions were 115–126 Tg CO2-equivalents
(Australian Greenhouse Office, 2005). Our results are ap-proximately 12 % of those CO2-equivalent emissions from
all carbon pools in Australia. However, soil erosion is not explicitly included in Australian national SOC accounting, which renders estimates of CO2 flux from soils highly
un-certain. The inclusion of an erosion component may substan-tially reduce that uncertainty (Chappell et al., 2012, 2013; Sanderman and Chappell, 2012) and improve the accuracy for the reporting of GHG emissions.
Acknowledgements. Funding for this research was provided by the CSIRO Sustainable Agriculture National Research Flagship. The authors are grateful to colleagues Jon Sanderman and Pep Canadell and two anonymous reviewers for their comments on an earlier manuscript. Any errors or omissions in the manuscript remain the responsibility of the authors.
Edited by: S. Fontaine
References
Australian Greenhouse Office: Greenhouse gas emissions from land use change in Australia: Results of the National Carbon Account-ing System 1988–2003. Australian Greenhouse Office, Canberra, Australia, 2005.
Berhe, A. A. and Kleber, M.: Erosion, deposition, and the per-sistence of soil organic matter: mechanistic considerations and problems with terminology, Earth Surf. Process. Land., 38, 908– 912, 2013.
Berhe, A. A., Harte, J., Harden, J. W., and Torn, M. S.: The signifi-cance of the erosion-induced terrestrial carbon sink, BioScience, 57, 337–346, 2007.
Chappell, A.: Using remote sensing to and geostatistics to map
137Cs-derived net soil flux in south-west Niger, J. Arid Environ.,
39, 441–455, 1998.
Chappell, A.: The limitations for measuring soil redistribution using
137Cs in semi-arid environments, Geomorphology, 29, 135–152,
1999.
Chappell, A. and Warren, A.: Spatial scales of 137Cs-derived soil flux by wind in a 25 km2arable area of eastern England, Catena, 52, 209–234, 2003.
in-ventory for Australian soil, J. Geophys. Res., 116, F04014, doi:10.1029/2010JF001942, 2011a.
Chappell, A., Viscarra Rossel, R. A., and Loughran, R.: Spa-tial uncertainty of 137Cs-derived net (1950ss–1990) soil re-distribution for Australia, J. Geophys. Res., 116, F04015, doi:10.1029/2010JF001943, 2011b.
Chappell, A., Sanderman, J., Thomas, M., Read, A., and Leslie, C.: The dynamics of soil redistribution and the implications for soil organic carbon accounting in agricultural south-eastern Aus-tralia, Glob. Change Biol., 18, 2081–2088, 2012.
Chappell, A., Webb, N. P., Butler, H., Strong, C., McTainsh, G. H., Leys, J. F., and Viscarra Rossel, R.: Soil organic carbon dust emission: an omitted global source of atmospheric CO2, Glob.
Change Biol., 19, 3238–3244, 2013.
de Roo, A. P. J.: The use of137Cs as a tracer in an erosion study in south Limburg (The Netherlands) and the influence of Chernobyl fallout, Hydrol. Process., 5, 215–227, 1991.
Dlugoss, V., Fiener, P., Van Oost, K., and Schneider, K.: Model based analysis of lateral and vertical soil carbon fluxes induced by soil redistribution processes in a small agricultural catchment, Earth Surf. Proc. Land., 37, 193–208, 2012.
Doetterl, S., Six, J., Van Wesemael, B., and Van Oost, K.: Car-bon cycling in eroding landscapes: geomorphic controls on soil organic C pool composition and C stabilization, Glob. Change Biol., 18, 2218–2232, 2012a.
Doetterl, S., Van Oost, K., and Six, J.: Towards constraining the magnitude of global agricultural sediment and soil organic car-bon fluxes, Earth Surf. Proc. Land., 37, 642–655, 2012b. Dymond, J. R.: Soil erosion in New Zealand is a net sink of CO2,
Earth Surf. Process. Land. 35, 1763–1772, 2010.
Gallant, J. C. and Dowling, T. I.: A multiresolution index of valley bottom flatness for mapping depositional areas, Water Resour. Res., v. 39, p. 1347, 2003.
Harden, J. W., Sharpe, J. M., Parton, W. J., Ojima, D. S., Fries, T. L., Huntington, T. G., and Dabney, S. M.: Dynamic replacement and loss of soil carbon on eroding cropland, Global Biogeochem. Cy., 13, 885–901, 1999.
Haverd, V., Raupach, M. R., Briggs, P. R., J. G. Canadell., Davis, S. J., Law, R. M., Meyer, C. P., Peters, G. P., Pickett-Heaps, C., and Sherman, B.: The Australian terrestrial carbon budget, Bio-geosciences, 10, 851–869, doi:10.5194/bg-10-851-2013, 2013. Knapp, S., Smart, R., and Barodien, G.: National Land Use Maps:
1992/93, 1993/94, 1996/97, 1998/99, 2000/01, 2001/02, version 3, BRR 44, Bur. of Rural Sci, Canberra, 2006.
Lal, R.: Soil erosion and the global carbon budget, Environ. Inter-nat., 29, 437–450, 2003.
Lal, R. and Pimentel, D.: Soil erosion: A carbon sink or source?, Science, 319, 1040–1042, 2008.
Loughran, R. J., Elliott, G. L., McFarlane, D. J., and Campbell, B. L.: A survey of soil erosion in Australia using caesium-137, Austr. Geogr. Studies, 42, 221–233, 2004.
Lu, H., Moran, C. J., Prosser, I. P., Raupach, M. R., Olley, J., and Petheram, C.: Hillslope erosion and sediment delivery: A basin wide estimation. Technical Report 15/03, CSIRO Land and Wa-ter, Canberra, 2003.
Martinez, C., Hancock, G. R., and Kalma, J. D.: Comparison of fallout radionuclide (caesium-137) and modelling approaches for the assessment of soil erosion rates for an uncultivated site in south-eastern Australia, Geoderma, 151, 128–140, 2009.
Marx, S. K., McGowan, H. A., Kamber, B. S., Knight, J. M. Den-holm, J., and Zawadzki, A.: Unprecedented wind erosion and perturbation of surface geochemistry marks the Anthropocene in Australia, J. Geophys. Res., 119, 45–61, 2014
McAlpine, C. A., Syktus, J., Deo, R. C., Ryan, J. G., McKeon, G. M., McGowan, H. A., and Phinn, S. R.: A continent under stress: Interactions, feedbacks and risks associated with impact of mod-ified land cover on Australia’s climate, Glob. Change Biol., 15, 2206–2223, 2009.
McTainsh, G. H.: Quaternary aeolian dust processes and sediments in the Australian region, Quaternary Sci. Revi., 8, 235–253, 1989.
Montgomery, D. R.: Soil erosion and agricultural sustainability, Proc. Natl. Acad. Sci. USA, 104, 13268–13272, 2007.
Owens, P. N. and Walling, D. E.: The use of a numerical mass-balance model to estimate rates of soil redistribution on unculti-vated land from137Cs measurements, J. Environ. Radioactivity, 40, 185–203, 1998.
Parsons, A. J. and Foster, I. D. L.: What can we learn about soil erosion from the use of137Cs?, Earth-Sci. Rev., 108, 101–113, 2011.
Quine, T. and Van Oost, K.: Quantifying carbon sequestration as a result of soil erosion and deposition: retrospective assessment using caesium-137 and carbon inventories, Glob. Change Biol., 13, 2610–2625, 2007.
Ritchie, J. C. and McCarty, G. W.:137Cesium and soil carbon in a small agricultural watershed, Soil Tillage Res., 69, 45–51, 2003. Ritchie, J. C., McCarty, G. W., Venteris, E. R., and Kaspar, T. C.: Soil and soil organic carbon redistribution on the landscape, Ge-omorphology, 89, 163–171, 2007.
Roehl, J. E.: Sediment source areas, and delivery ratios influenc-ing morphological factors, Int. Assoc. Hydro. Sci., 59, 202–213, 1962.
Roels, J. M.: Estimation of soil loss at a regional scale based on plot measurements – some critical considerations, Earth Surf. Proc. Land., 10, 587–95, 1985.
Roels, J. M. and Jonker, P. J.: Probability sampling techniques for estimating soil erosion, Soil Sci. Soc. Am. J., 47, 1224–1228, 1983.
Sanderman, J. and Chappell, A.: Uncertainty in soil carbon account-ing due to unrecognized soil erosion, Glob. Change Biol., 19, 264–272, 2012.
Schiettecatte, W., Gabriels, D., Cornelis, W. M., and Hofman, G.: Enrichment of organic carbon in sediment transport by interrill and rill erosion processes, Soil Sci. Soc. Am. J., 72, 50–55, 2008. Stallard, R. F.: Terrestrial sedimentation and the carbon cycle: Coupling weathering and erosion to carbon burial, Global Bio-geochem. Cy., 12, 231–257, 1998.
Van Oost, K., Quine, T. A., Govers, G., De Gryze, S., Six, J., Harden, J. W., Ritchie, J. C., McCarty, G. W., Heckrath, G., Kos-mas, C., Giraldez, J. V., da Silva, J. R., and Merckx, R.: The impact of agricultural soil erosion on the global carbon cycle, Science, 318, 626–629, 2007.
Van Pelt, R. S.: Use of anthropogenic radioisotopes to estimate rates of soil redistribution by wind I: Historic use of137Cs, Aeolian Res., 9, 89–102, 2013.
Walling, D. E.: The sediment delivery problem, J. Hydrol., 65, 209– 237, 1983.
Walling, D. E. and Quine, T. A.: The use of caesium-137 to investi-gate soil erosion on arable fields in the UK-potential applications and limitations, J. Soil Sci., 42, 146–165, 1991.
Wang, Z., Govers, G., Steegen, A., Clymans, W., Van den Putte, A., Langhans, C., Merckx, R., and Van Oost, K.: Catchment-scale carbon redistribution and delivery by water erosion in an inten-sively cultivated area, Geomorphology, 124, 65–74, 2010. Wasson, R. J., Olive, L. J., and Rosewell, C.: Rates of Erosion and
Sediment Transport in Australia, in: Erosion and Sediment Yield: Global and Regional Perspectives, edited by: Walling, D. E. and Webb, R., IAHS Publ., 139–148, 1996.
Webb, N. P., Chappell, A., Strong, C. L., Marx, S. K., and Mc-Tainsh, G. H.: The significance of carbon-enriched dust for global carbon accounting, Glob. Change Biol., 18, 3275–3278, 2012.
Webb, N. P., Strong, C., Chappell, A., Marx, S., and McTainsh, G. H.: Soil organic carbon enrichment of dust emissions: magni-tude, mechanisms and its implications for the carbon cycle, Earth Surf. Proc. Land., 38, 1662–1671, 2013.
Wei, G., Wang, Y., and Wang, Y. L.: Using137Cs to quantify the re-distribution of soil organic carbon and total N affected by inten-sive soil erosion in the headwaters of the Yangtze River, China, Appl. Radiat. Isotop., 66, 2007–2012, 2008.
Yan, H., Wang, S., Wang, C., Zhang, G., and Patel, N.: Losses of soil organic carbon under wind erosion in China, Glob. Change Biol., 11, 828–840, 2005.