260
EVALUATION OF SOME RELIABILITY PARAMETERS FOR A GAS
SEPARATOR PLANT BY BOOLEAN FUNCTION TECHNIQUE
S.C Agarwal1 & Mool Pal2
1
M.M.(P.G.) College ,Modinagar (U.P.), India.
2
TGT (Maths), Kendriya Vidyalaya, Chenani at Kud, Udhampur (J&K), India.
ABSRACT
The authors in this paper have tried to evaluate the reliability and MTTF of a gas separator plant. The considered system consist of four sub system arranged in series and parallel configuration .Boolean function technique have been used to formulate and solve the mathematical model of considered system .All necessary graphical illustrations are given at the end so as to explain the practical utility of the model.
KEY WORD: MTTF And Boolean function technique.
1. INTRODUCTION
In this considered gas separator plant, there are four main sub systems ,named as P,Q,R and S. The subsystem P is a pressure shut down valve and it is responsible to collect input for the separation process. The sub system P is an automatic valve and it work by the pressure of input. The sub system Q consists two unit of pressure logic controller arrange in parallel .These two units control the working of pressure shut down. The subsystem R consists two units arranged in parallel and these unit known as gas separation units. The subsystem R separates the useful gas from the input and exhausted the waste gases. By subsystem S we obtain separated gases.
2. ASSUMPTION
The associate assumptions are as follows.
1. Initially all the equipments are good and operable.
2. The state of each component and of the whole system is either good or fail.
3. The state of all components of the system are statistically independent.
4. The failure time of all components are arbitrary.
5. Supply between any two component of the system is hundred percent reliable.
6. There are no repair facility.
261
SUBSYSTEM P
SUBSYSTEM Q
SUBSYSTEM R
SUBSYSTEM S
RELIABILITY BLOCK DIAGRAM
NOTATIONS
x1 – state of subsystem P
x2, x3 – states of two units of subsystem Q
x4, x5– states of two units of subsystem R
X1
X2 X3
X4 X5
262 x6 – state of subsystem S.
x' – negation of x ^ – conjuction
xi = 0 in bad state
1 in good state ( i =1,2,3,4,5,6)
Rs : Reliability of the system as a whole
Ri : Reliability of component corresponding to system state xi
Qi : Unreliability of component correspond to system state xi
Rsw(t)/RSE (t) : Reliability of the system as a whole when failures follow weibull / exponential time distribution.
3. FORMULATION OF MATHEMATICAL MODEL
The successful operation of the system in terms of logical matrix are expressed as:
F(x 1,x2,x3,x4,x5,x6)= x1 x2 x4 x6
x1 x2 x5 x6
x1 x3 x4 x6
x1 x3 x5 x6 …(1)
4. SOLUTION OF THE MODEL By using application of algebra of logic equation (1) may be written as F(x1,x2,x3,x4,x5,x6)=[x1.x6 ^ f (x2 x3 x4 x5)] … (2) Where f (x2 x3 x4 x5)= x2 x4 x2 x5 x3 x4 x3 x5 …(3)
Substituting the following in Eqn (3) M1 = [x2 x4 ] …(4)
M2 = [x2 x5 ] …(5)
M3 = [x3 x4 ] …(6)
M4 = [x3 x5 ] …(7)
We obtain f (x2 x3 x4 x5)= M1 M2 M3 M4 …(8)
263 Now using algebra of logic, we have
M1 = [x 2 x 4]
M'1 = x'2
x2 x'4
M'1M2 = x'2
x2 x'4 ^ [x2 x5]
= [x2 x'4 x5] …(10)
Similarly we obtain the following
M'1.M'2.M3 = [x'2 x3 x4] … (11)
And
M'1.M'2.M'3 M4 = x'2 x3 x'4 x5
x2 x3 x'4 x5 …(12)
Using eqn (10) through (12) ,eqn (8) gives
f (x2 x3 x4 x5)= x2 x4
x2 x'4 x5
x'2 x3 x4
x'2 x3 x'4 x5
x2 x3 x'4 x5 . . .(13)
using eqn (13) in ( 2) we obtain
F(x1 x2 x3 x4 x5 x6) = x1 x2 x4 x6
x1 x2 x'4 x5 x6
x1 x2' x3 x 4 x6
x1 x'2 x3 x'4 x5 x6
x1 x2 x3 x'4 x5 x6
Finally, probability of the successful operation (i.e. reliability ) of the system is given by Rs = Pr { F (x1x2x3x4x5x6)}
Rs = R1 R6 [R2R4+ R2Q4R5+Q2R3R4+Q2R3Q4R5+R2R3Q4R5] …(14)
Rs = R1R6 [R2R4+R2(1-R4).R5 +(1-R2)R3R4+(1-R2)R3(1-R4)R5+R2R3(1-R4).R5]
Rs = R1R6[R2R4+R2R5+R3R4+R3R5-R2R4R5-R2R3R4- R3R4 R5 ] …(15)
Particular CASES
CASE I :If reliability of each component of the complex system is R, eqn (15) yield
RS=R4[4-3R] ....(16)
CASEII;When failure rate follow weibull distribution Let failure rates of state xiis λi where (i=1,2,3,4,5,6)
Then from eqn (16), reliability of system at an instant t become
Rswt(t) = ∑ exp(–αitp ) –∑ exp(–βjtp )
i=1 j=1 … (17) α1= λ1+λ2+λ4+λ6
α2=λ1+λ2+λ5+λ6
α3= λ1+λ3+λ4+λ6
α4 =λ1+λ3+ λ5+λ6
264 β1= λ1+λ2+λ4+ λ5+λ6
β2=λ1+λ2+ λ3+λ4+λ6
β3= λ1+λ3+ λ4+ λ5+λ6
Where α is a possitive parameter.
CASEIII : When failure rates follow exponential distribution
exponential distribution is a particular case of weibull distribution for �=1,the reliability of the system in this case at instant t given by
…. (18) And the expression for MTTF in this case is
…. (19)
NUMERICAL COMPUTATION FOR RELIABILITY & MTTF
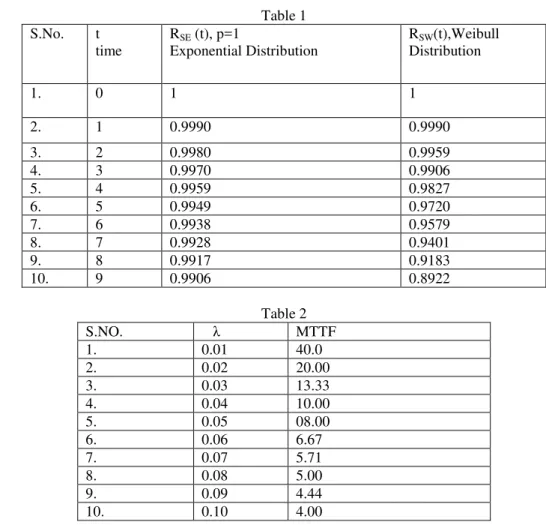
(a) Setting all λi= λ=0.01,i=1to 6, p=2 in eqn (17) and (18) .One may obtain the table 1& fig2.
(b) Setting all λi= λ=0.01,in eqn (19) one may obtain the table 2& fig 3.
Table 1 S.No. t
time
RSE (t), p=1
Exponential Distribution
RSW(t),Weibull
Distribution
1. 0 1 1
2. 1 0.9990 0.9990
3. 2 0.9980 0.9959
4. 3 0.9970 0.9906
5. 4 0.9959 0.9827
6. 5 0.9949 0.9720
7. 6 0.9938 0.9579
8. 7 0.9928 0.9401
9. 8 0.9917 0.9183
10. 9 0.9906 0.8922
Table 2
S.NO. λ MTTF
1. 0.01 40.0
2. 0.02 20.00
3. 0.03 13.33
4. 0.04 10.00
5. 0.05 08.00
6. 0.06 6.67
7. 0.07 5.71
8. 0.08 5.00
9. 0.09 4.44
265 Figure 2
Figure 3
INTER PREPRATION OF THE RESULTS
Table 1 and fig2 shows that reliability function RSE(t) decreases catastrophically in the beginning but thereafter it
decrease constantly .The value of RSE(t) remains better as compared of RSE(t).
Table 2 and fig3 show that the values of MTTF with the increase in failure rate. A critical examination of fig 3 ,yields that the value of MTTF decrease rapidly as we make increase in the value of failure rate λ but thereafter in decrease in constant manner.
REFRENCES
[1]. Gupta P.P.;Agarwal S.C.;1983.A boolean Algebra Method For Reliability Calculations (Published work Style ) Micro electronic Reliability ,vol,.23.U.K.1983p.p.863-865.
[2]. Gupta P.P.;Kumar Arvind ;(1986).Evaluation of Reliability and MTTF OF Power plant with the Aid of boolean Function Expansion Algroithm (published work style),Micro electronic Reliability ,U.K.,PP.821-824.
[3]. Sukhatme ,P.V.; Koshal R.S.;[1954],Sampling Thory of survey with application ,” lowa state college presws amer,lowa.
[4]. Arnab,R.;[1991],Estimation of finite population total in two stage and stratified sampling under supar population model,common state,Theo.Math,20,8,2495-2504.
[5]. Mukhopadhyay,P.;[2005],Theory and Methods of Survey Sampling ,Practice hall of India.
[6]. Bruno Bieth ,Liang Hopng and Jyotrimoy Sarkar ,(2009)A stand by system with two types of repair persons ,appl.Stochastic models Bus. Ind.
[7]. Linmin the and jiandong Li, (2009) “Reliability analysis of a three unit system with vacation and priority” ,ICIC International .pp.171-176.
[8]. Sharma,Deepankar: 2002 “Cost Analysis Availability and MITF of complex system with the concept of waiting and Human Error,”BPAS ,volume 21E,No.2.pp.553-559.
0.8 0.85 0.9 0.95 1 1.05
0 1 2 3 4 5 6 7 8 9
R
e
li
ab
il
ity
Time
Exponential Distribution Weibull Distribution
0 10 20 30 40 50
0 1 2 3 4 5 6 7 8 9
M
TTF
FAILURE RATE