Abstract —SALCER (in Spanish: Sistema de Asesoramiento y Localización de Centrales de EnergíaRenovables) could be translated as Counseling and Location of Renewable Energy Power Station´s System. Its objective is to develop a system capable of finding the most suitable place for the construction of renewable power stations, taking into account such things as: budget, topography, amount of energy needed, among others. The most relevant aims of the project are: study of a certain variety of renewable energy technologies, designing an accurate topology system, restraining decisions to demand forecasts and finally performance of an energy plan for a specific region.
Keywords—Energy management, renewable energies, energy plan, topography analysis, energy demand forecast.
I. INTRODUCTION
OWADAYS, Spain is the European country with the highest level of energy purchase, importing 80% of the energy consumed by our population. Our demand is way higher than our production, so importing it seems our only solution. Our small self-supply (1%) bases itself in nuclear energy methods andproducts such as coal and gas. Therefore, Spain isinevitably an energy-dependent country, due to the lack of other sources such as oil. In addition, Spanish coal has high sulfur content and a low calorific value, so that great quantities of coal are needed to produce little energy.
Fig. 1
One positive aspect of Spain‘s situation is that the lack of oil and other basic energy raw materials has launched the development of renewable energy to fight against our handicap. Although Spain still has a high dependence on nuclear energy and petroleum products, renewable energy are rapidly emerging.
We are the third country in the world and the second in Europein wind power production and we have a leading industry of photovoltaic energy andresources for all
renewable technologies. The purpose of this Information technology system is to develop renewable energy and increase its empowerment, developing a forecast as accurately as possible for Spanish long-term energy demand and perform and energy plan, according to a capital investment.
Fig. 2
This will raise the question of profitability. Is it more profitable to keep importing energy or should we invest in power station constructions to reduce the costs of production in the future? That is a question our energy plan will be willing to answer. The whole development of the application described below, will split into 3 main systems:
1. Power Stations location sitesSystem (SALCER SLE).
2. Demand Forecast System (SALCER SPD). 3. Energy´s DecisionPlanSystem (SALCER SDPE)
II. STATE OF ART
We will carry out an approach based on Spain but always bearing in mind the overall perspective. Spanish current situation is quite good. In no other activity apart from renewable energies will our country reach such a leading position. We are third in the world, second in Europe, in wind power; we have a leading photovoltaic industry and abundant resources for all renewable technologies. This policy towards renewable energy culminates with the plan launched by the Ministry of public works in 1999, which set targets for each of these technologies, which should help to ensure that by 2010, 12% of primary energy is obtained from renewable sources.
Our country is one of those who suffer from greater reliance on outside the EU and the high demand growth in recent years has meant that these goals for 2010 have fallen short, it provides an installed capacity in 2010 13,000 MW of wind power compared to 9000 under the 1999 plan. For all this we have developed SALCER, in order to contribute to the
SALCER´s Project
Bosco Espinós, Carlos Pérez
OpenLab, Madrid
improvement of our planet. SALCER is a pioneer in its field, since no similar application (that includes three ensemble subsystems) exists nowadays. It is true that you can find those three subsystems, but always separately. On the Demand Forecast System (SPD), we can find applications that calculate short termenergy demand such as the proposal on the website of ―Red Eléctrica de España‖which makes a prediction for a time interval of a week or even less. CERMA(free energy efficiency prediction application), can be another example. In this case the application presents an exhaustive study in order to improve the energetic efficiency prediction using CALENER VYP. But never one that calculates such an accurate long-term prediction asSALCER‘s SPD. About the Power Stations location sitesSystem (SLE), more alternatives become available such as any Geographic Information System (GIS) to perform similar calculations to those made by our system or geospatial database. What matters here is the exhaustive analysis of data, but SALCER can boast of having a fairly large and effective catalog of data. In what concerns the last sub-system Energy‘s DecisionPlanSystem (SDPE), no similar software has been found mostly due to the fact, mentioned earlier,that there is one application that unifies these subsystems and the system is responsible for unifying the outputs of the previous two and providing a solution.
III. DEMAND FORECAST SYSTEM (SALCER SPD) A. Functionality
The SPD is responsible of SALCER´s energy demand forecast system using historical data for long-term forecasting energy demand. This forecast will affect independently autonomous region and will include the following:
Information about the annual average power consume of each autonomous region.
Annual energy growth in the respective regions. Annual population growth of each autonomous
region.
Annual industrial growth which has developed each autonomous region:
Price MW/h
Growth price MW/h in recent years
Meteorological Aspects.
Growth in the weather. B. Forecast techniques
1) Artificial Neural Networks
Most neural network approaches to the problem of forecasting use a multilayer network trained using the back propagation algorithm. Consider a time series, where it is required to forecast the value of. The inputs to the multilayer network are typically chosen as the previous values and the output will be the forecast. The network is trained and testedon sufficiently large training and testing sets that are
extracted from the historical time series. In addition to previous time series values, one can utilize as inputs the values or forecasts of other time series (or external variables) that have a correlated or causal relationship with the series to forecasted.
For our river flow problem such time series could be the rainfall at the river‘s origins. For the majority of forecasting problems such external inputs are not available or are difficult to obtain. We have not used any external inputs except an input indicating the season. [2] As is the case with many neural-network applications, preprocessing the inputs and the outputs can improve the results significantly. Input and output preprocessing means extracting features from the inputs and transforming the target outputs in a way that makes it easier for the network to extract useful information from the inputs and associate it with the required outputs.
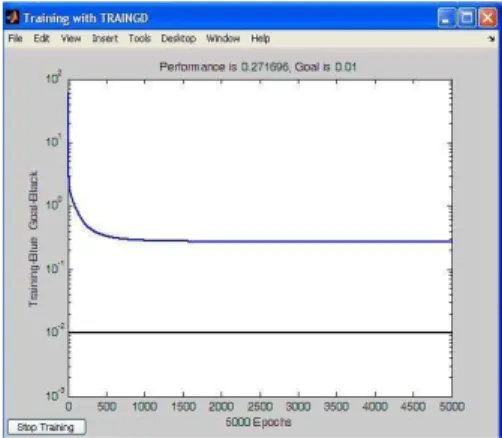
Preprocessing is considered an ―art,‖ and there are no set rules to choose it. Even some very intuitively appropriate transformations may turn out of no value when checking the actual results. For our case the main inputs are the previous time series values. We have used some preprocessing of the inputs, but also some of the methods described next sections are based also on different ways to preprocess the data. In short, the input that we used is historical energy consumption for nine years. [3] The network is trained for 5000 iterations. We have performed simulations, and found the following observations.
There is a strong correlation between the training error and the testing error. This means that there is goodgeneralization. Choosing a network/input set that givesa low training error will almost surely result in a lowtesting error.
Fig 3 - Artificial neural network training result.
In several exploratory runs we have found that novalidation set was needed to determine optimal stoppingpoint in training. The error for the test set goes downuniformly with iteration and does not bottom out. For the majority of input combinations the results
weresomewhat similar. Most cases gavehigher errors, so we can state this method is not the best for long-term forecasting.
Fig 4 -Artificial neural network result.
2) Exponential Smoothing
Exponential smoothing is based on a pragmatic approach to forecasting. It‘s a formalization of the familiar learning process, which is a practical basis for statistical forecasting. Higher orders of smoothing are defined by the operator: If one assumes that the time series of observation {xi} is of the form [formula] where ni is a sample from some error population, then least squares estimates of coefficients ai can be obstinated from linear combinations of the operators S, S2, …, SN+1.
Explicit forms of the forecasting equations are given for N=0, 1 and 2. This result makes it practical to use higher order polynomials as forecasting models, since the smoothing computations are very simple, and only a minimum of historical statistics need be retained in the file from one forecast to the next [4]. We have performed simulations, and found the following observations:
This method is the most accurate of the three alternatives. Performs good results for month and year periods for
long-term energy demand forecast.
3) Time Series
Most data in macroeconomics and energy come in the form of time series–a set of repeated observations of the same variable, such as GNP or a stock return. We can write a time series as
{x1, x2, . . . xT } or {xt}, t = 1, 2, . . . T
We will treat xt as a random variable. In principle, there is nothing about time series that is arcane or different from the rest of econometrics. The only difference with standard econometrics is that the variables are subscripted t rather than i. For example, if yt is generated by
yt = xtβ + єt, E(єt | xt) = 0,
then OLS provides a consistent estimate of β, just as if the
subscript was ‖i‖ not ‖t‖.The word ‖time series‖ is used interchangeably to denote a sample {xt}, such as GNP from
1947:1 to the present, and a probability model for that sample—a statement of the joint distribution of the random variables {xt}. A possible probability model for the joint
distribution of a time series
{xt} is
xt = єt, єt∼i.i.d. N(0, σ2є )
i.e, xt normal and independent over time. However, time
series are typically not iid, which is what makes them interesting. For example, if GNP today is unusually high, GNP tomorrow is also likely to be unusually high.
It would be nice to use a nonparametric approach—just use histograms to characterize the joint density of {.., xt−1, xt, xt+1,
. . .}. Unfortunately, we will not have enough data to follow this approach in macroeconomics and energy for at least the next 2000 years or so. Hence, time-series consists of interesting parametric models for the joint distribution of {xt}.
The models impose structure, which you must evaluate to see if it captures the features you think are present in the data. In turn, they reduce the estimation problem to the estimation of a few parameters of the time-series model.
We have performed simulations, and found the following observations:
This method is the most accurate of the three alternatives. Performs bad results for month periods.
Performs good results for year periods.
C. Development Tools
1) For Artificial Neural Networks
MATLAB R2007bis a development environment based on MATLAB language. ―MATLAB® is a high-level language and interactive environment that enables you to perform computationally intensive tasks faster than with traditional programming languages such as C, C++, and Fortran. ‖ [1]. This language can be used in many different fields such as signal or image processing; communications; test and measurement, as well as other scientific fields of investigation.
On this development environment it is possible to manage code, files, and data. It includes many functions for statistics, optimization, and numeric data integration and filtering.
There are also great amounts of functions that facilitate the manipulation of bi-dimensional and three-dimensional images.
2) For Time Series and Exponential Smoothing
D. Data
From the beginning of the analysis (for the SPD subsystem) we decide to use the less variables as possible to perform the energy demand forecast. Finally we succeeded using:
Electric energy consumed for Spain and its regions.
Population data for the Spanish regions.
This data was extracted from the National Statistics Institute (INE) of Spain. [5]
IV. POWER STATIONS LOCATION SITES SYSTEM (SALCER SLE).
A. Functionality
This system will be responsible for establishing the optimum point to locate an energy power station construction, a place where you can obtain the highest production rate at the lowest cost. In order to do this we will consider such data as:
Topological geographic study of the area and its surroundings.
Legislative and politic details to find out where and under what conditions can the power stations be built. Meteorological data to establish the station‘s purpose. Infrastructure details: power supply, access to the area
and materials transport.
Details of the construction of the power station, maintenance, improvements and dismantled, insurance against accidents, environmental impact, and so on.
B. Location techniques 1) Bayesian Networks
A Bayesian network is a graphical model that encodes probabilistic relationships among variables of interest. When used in conjunction with statistical techniques, the graphical model has several advantages for data analysis. One, because the model encodes dependencies among all variables, it readily handles situations where some data entries are missing. Two, a Bayesian network can be used to learn causal relationships, and hence can be used to gain understanding about a problem domain and to predict the consequences of intervention. Three, because the model has both a causal and probabilistic semantics, it is an ideal representation for combining prior knowledge (which often comes in causal form) and data. Four, Bayesian statistical methods in conjunction with Bayesian networks offer an efficient and principled approach for avoiding the over fitting of data.
We designed two Bayesians networks for the two types of power stations included in this study. The input information is introduced into the Bayesian network by setting evidences on the input nodes. We decided to implement three evidence
levels for each input node.
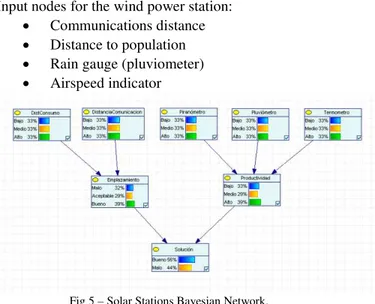
Input nodes for the solar power station: Communications distance Distance to population Solar radiation indicator Rain gauge (pluviometer) Thermometer
Input nodes for the wind power station: Communications distance Distance to population Rain gauge (pluviometer) Airspeed indicator
Fig 5 – Solar Stations Bayesian Network.
The main goal we tried to achieve was to obtain a single rate from a set of parameters, to determine (in a zero to one scale) the best placements for a specific station type.
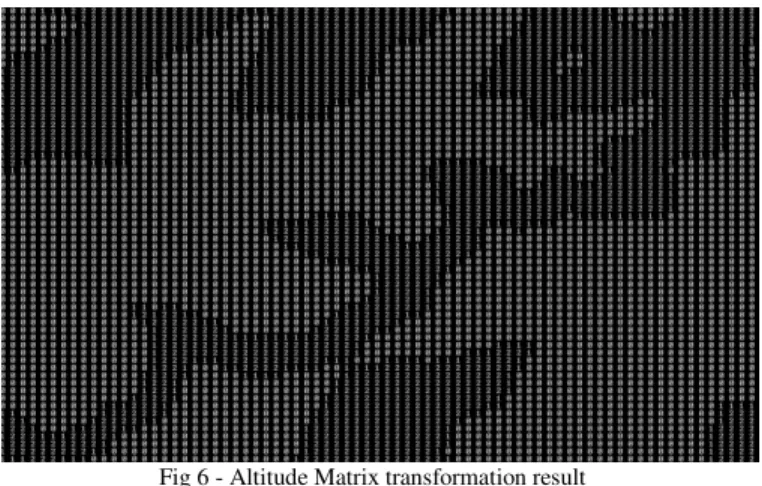
2) Topographic analysis algorithm
Fig 6 - Altitude Matrix transformation result
The next step is cutting out the polygons selected in the previous steps. To develop this algorithm we tried different types of programming styles to meet the characteristics the process should have: Computational efficient, errorless and accurate as possible.
Our first choice was an iterative algorithm to meet the computational efficiency requirement. This algorithm turned out to be rather efficient butrate errors were extremely high (over 40%) and could notperform the task correctly. Responsible for this problemwas the algorithm‘serror resiliency. Then we tried a recursive algorithm based on backtracking techniques, this allowed us to obtain all possible solutions, so we could select the best one. To meet the computational efficiency requirement we decide to keep path (to cut out the polygon) length calculations in another matrix. Finally this algorithm satisfied our computational efficiency expectative and reduce error rate down lower than 5 percent.
On figures 7 and 8 we can see the positive results of the topographic analysis algorithm. Google maps was used to represent the information.
Fig 7 - Piece of land selectet by the topographic analysis algorithm. (represented on google maps)
Fig 8 - Piece of land selectet by the topographic analysis algorithm. (represented on google maps)
3) Site Characteristics
Derived from a performed investigation study, we established the main characteristics a site should have to be eligible forbuilding a station.
For Solar stations:
Area between60ha`s and 270ha`s Height difference: maximum 20 meters
For Wind power stations:
Area between4ha`s to and 18ha`s
Minimum altitude of 1200 meters (0.7456 miles) Height difference: maximum 60 meters
Finallywe established common useful characteristics, such as proximity to populations and communication infrastructures.
C. Development Tools 1) GENIE
predict the probabilities of related outcomes in a system. In Bayesian networks, the addition of more nodes and inferences greatly increases the complexity of the calculations involved and Genie allows for the analysis of these complicated systems. Additionally, the graphical interface facilitates visual understanding of the network.
2) Database engine implementing OGC (Open Geospatial Consortium) spatial specifications
We needed a good storage system for the great amount of data that we handle and an adequate tool to make geographic operations and calculations. This is possible using a database engine which implements the OGC spatial specifications. With these tools now we are capable of operations like the following:
Within: tells us if a geometry instance is completely within another geometry instance. Intersects: tells us if a geometry instance intersects
another geometry instance
Envelope: tells us the minimum axis-aligned bounding rectangle of the instance.
Area: tells us the total surface area of a geometry instance.
Distance: tells us the shortest distance between a point in a geometry instance and a point in another geometry instance.
This specification allowsusing new data types in our relational database designs. Finally we decide to use geometry spatial data type but there are other types available like geography spatial data types.
D. Data
1) Meteorological information: data use mainly by the Power stations location sites System (SLE subsystem) as an important input to the Bayesian networks. Extracted from the Spanish national statistics institute (INE). [5]
2) Electric Energy Information: Data used by the Demand Forecast System (SPD subsystem) for the forecast process using exponential smoothing. Extracted from the Spanish national statistics institute (INE). [5]
3)Population and town`s information: The Demand Forecast system needs population data to provide an energy demand forecast. Power stations location sites System (SLE subsystem) needs both population and town`s information, this data is used at the same time, so we can find out the population in a specific geographic point. We calculate what we call population index, we divide the area into concentric circles and multiply the population within these circles by a modifier and then we sum it all. We established the following values: 10Km, 30Km and 80Km (green, blue, orange) for the radius of the circles and 0.5, 0.3 and 0.2 (green blue, orange) for the population modifier applied for those areas. The population index is a very important input for the Bayesian
networks of the Power stations location sites System (SLE subsystem). Extracted from the Spanish national statistics institute (INE) [5] and from the Spanish national institute of geography (IGN, Ministerio de Fomento) [6].
4) Administrative limits, Hydrographic and communications infrastructure information: Data stored into our relational data model as geometry spatial data type used to make operations related to the Power stations location sites System (SLE subsystem), this operations determine (in some way) the eligibility of a placement, and for example the distance to the nearest motorway is an input to the Bayesian Network. Extracted from the Spanish national institute of geography (IGN, Ministerio de Fomento) [6].
V.ENERGY DECISION PLAN SYSTEM (SALCER SDPE)
This systemis responsible for the last step of the process; this system will collect the outputs of the other two (SALCER SPD and SLE) and perform the energetic action plan. This will be done with the forecastedenergy demand ofall the locations, taking into account profitability to decide whether it is worth it or not. The following data will be needed at this point:
Countries Energy production. Long -term Energy Demand (SPD)
Possible locations for specific power stations (SLE).
Investment.
Simulation Schema (eg Kyoto Treaty). Energy Imports.
B. Workflow techniques 1) Engine Workflow
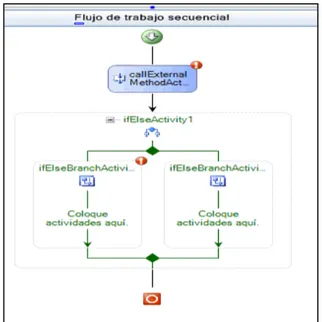
Workflow engine is a software application meant to manage and execute modeled computer processes. It is a key component in workflow technology. It will typically make use of a database server.
The workflow engine will interpret events such as documents submitted to the server or due dates expiring and act on these events according to the defined computer processes. The actions may be anything from saving the document in a document management system to issuing new work by sending an e-mail to users or escalating overdue work items to management. In other words, one can say that a Workflow Engine facilitates the flow of information tasks and events or one can say that it is the heart of a workflow application.
Figure 9 - SALCER Workflow example
2) SDPE Algorithm
We created and assigned this algorithm data statistical studies. For such purpose it takes into account:
-The type of station chosen.
-The amount of investment and the amount of energy needed.
Adjusting as well to certain criteria (explain below), in order to organize sites from high to low adequacy.
• The first inputs receivedare the results of SLE‘s selection. Depending on the type of energy some parameters will be chosen in order to identify the best sites:
- Wind Power: chosen sites will be those that generate higher productivity, are closer to distribution points and are close enough to a town or city (10km).
- Solar Power: same as above.
• The second input receivedis the monetary investment or a percentage of energy that must be met. In this case we can have many emplacements as long as we respect investment and energetic restrictions.The algorithm used is similar to the Knapsack.
C. Development Tools 1) WWF
Windows Workflow Foundation (WF) is a Microsoft technology for defining, executing, and managing workflows. This technology was first released in November 2006 as a part of .NET Framework 3.0. [19].
VI. CONCLUSION
We have made an investigation study of an important topic: Renewable Energies and Sustainable Development; we are satisfied with the improvements made to the current situation, although we think this kind of decision support systems
should be improved even more so decision making could be even more efficient. Many other fields of science could introduce systems like these, increasing efficiency in business processes.
REFERENCES
[1] Matworks TM, MATLAB product information. [Online] Available at:http://www.mathworks.com/products/matlab/
[2] M.H. Hassoun, Fundamentals of Artificial Neural Networks, MIT Press, 1995.
[3] K. Gurney, An introduction to neural networks, CRC Press, 1997. [4] R.J., Koehler, A.B., Ord, J.K., Snyder, R.D., Forecasting with
Exponential Smoothing The State Space Approach Hyndman, Springer, 2008.
[5] INE, National Statistics Institute. [Online] Available at: http://www.ine.es/
[6] IGN, National Geographic Institute. [Online] Available at: http://www.ign.es/ign/en/IGN/home.jsp [7] IDEE, Spanish Spatial Data Infrastructure’s. [Online]
Available at:http://www.idee.es/show.do?to=pideep_pidee.EN [8] MARM, Environment ministry[Online]
Available:http://www.marm.es/
[9] PSN, Parques Solares de Navarra. [Online] Available: http://www.parquessolaresdenavarra.com/ [10] REE, Red Electrica de España.[Online]
Available at: http://www.ree.es/
[11] ENERFIN,Enerfín Sociedad de Energía S.A [Online] Available at: http://www.enerfin.es/
[12] Infoeolica, Infoeolica. [Online]
Available at: http://www.infoeolica.com/parques.html [13] Solar Millennium, Solar Millennium AG. [Online]
Available at: http://www.solarmillennium.de/index-a-1.html [14] SCHOTT, SCHOTT AG. [Online]
Available at: http://www.schott.com/iberica/spanish/solar/ [15] ACCIONA, Acciona. [Online]
Available at: http://www.acciona.es/ [16] GENIE, Genie & Smile. [Online]
Available at: http://genie.sis.pitt.edu/
[17] SOCIALENERGY, Renewable Energy Solutions. [Online] Available at: http://www.socialenergy.net/
[18] FOTONA, GrupoFontona. [Online] Available at: http://www.fotona.es/
[19] MSDN, Windows Workflow Foundation. [Online] Available at: http://msdn.microsoft.com/