ESDD
5, 1075–1099, 2014Uncertainty in crop production and its
role in mitigation planning
K. Frieler et al.
Title Page
Abstract Introduction
Conclusions References
Tables Figures
◭ ◮
◭ ◮
Back Close
Full Screen / Esc
Printer-friendly Version Interactive Discussion
Discussion
P
a
per
|
Discus
sion
P
a
per
|
Discussion
P
a
per
|
Discussion
P
a
per
|
Earth Syst. Dynam. Discuss., 5, 1075–1099, 2014 www.earth-syst-dynam-discuss.net/5/1075/2014/ doi:10.5194/esdd-5-1075-2014
© Author(s) 2014. CC Attribution 3.0 License.
This discussion paper is/has been under review for the journal Earth System Dynamics (ESD). Please refer to the corresponding final paper in ESD if available.
The relevance of uncertainty in future
crop production for mitigation strategy
planning
K. Frieler1, A. Levermann1, J. Elliott2,3, J. Heinke1, A. Arneth4, M. F. P. Bierkens5, P. Ciais6, D. B. Clark7, D. Deryng8, P. Döll9, P. Falloon10, B. Fekete11,
C. Folberth12, A. D. Friend13, C. Gellhorn1, S. N. Gosling14, I. Haddeland15, N. Khabarov16, M. Lomas17, Y. Masaki18, K. Nishina18, K. Neumann19,20, T. Oki21, R. Pavlick22, A. C. Ruane23, E. Schmid24, C. Schmitz1, T. Stacke25, E. Stehfest20, Q. Tang26, D. Wisser27, V. Huber1, F. Piontek1, L. Warszawski1, J. Schewe1,
H. Lotze-Campen1, and H. J. Schellnhuber1,28
1
Potsdam Institute for Climate Impact Research, Potsdam, Germany
2
University of Chicago, Chicago, Illinois, USA
3
ANL Computation Institute, Chicago, Illinois, USA
4
Karlsruhe Institute of Technology, Karlsruhe, Germany
5
Utrecht University, Utrecht, the Netherlands
6
IPSL – LSCE, Gif sur Yvette, France
7
Centre for Ecology & Hydrology, Wallingford, UK
8
ESDD
5, 1075–1099, 2014Uncertainty in crop production and its
role in mitigation planning
K. Frieler et al.
Title Page
Abstract Introduction
Conclusions References
Tables Figures
◭ ◮
◭ ◮
Back Close
Full Screen / Esc
Printer-friendly Version Interactive Discussion
Discussion
P
a
per
|
Discus
sion
P
a
per
|
Discussion
P
a
per
|
Discussion
P
a
per
9
Institute of Physical Geography, J. W. Goethe University, Frankfurt, Germany
10
Met Office Hadley Centre, Exeter, UK
11
Civil Engineering Department, The City College of New York, New York, USA
12
Swiss Federal Institute of Aquatic Science and Technology, Dübendorf, Switzerland
13
Department of Geography, University of Cambridge, Cambridge, UK
14
School of Geography, University of Nottingham, Nottingham, UK
15
Norwegian Water Resources and Energy Directorate, Oslo, Norway
16
International Institute for Applied System Analysis, Laxenburg, Austria
17
Centre for Terrestrial Carbon Dynamics, University of Sheffield, Sheffield, UK
18
Center for Global Environmental Research, National Institute for Environmental Studies, Tsukuba, Japan
19
Wageningen University, Laboratory of Geo-information Science and Remote Sensing, Wageningen, the Netherlands
20
PBL Netherlands Environmental Assessment Agency, the Hague, the Netherlands
21
The University of Tokyo, Tokyo, Japan
22
Max Planck Institute for Biogeochemistry, Jena, Germany
23
NASA GISS, New York, New York, USA
24
Institute for Sustainable Economic Development, Vienna, Austria
25
Max Planck Institute for Meteorology, Hamburg, Germany
26
Institute of Geographic Sciences and Natural Resources Research, Chinese Academy of Sciences, Beijing, China
27
Center for Development Research, University of Bonn, Bonn, Germany
28
Santa Fe Institute, Santa Fe, New Mexico, USA
Received: 28 July 2014 – Accepted: 20 August 2014 – Published: 26 September 2014 Correspondence to: K. Frieler ([email protected])
ESDD
5, 1075–1099, 2014Uncertainty in crop production and its
role in mitigation planning
K. Frieler et al.
Title Page
Abstract Introduction
Conclusions References
Tables Figures
◭ ◮
◭ ◮
Back Close
Full Screen / Esc
Printer-friendly Version Interactive Discussion
Discussion
P
a
per
|
Discus
sion
P
a
per
|
Discussion
P
a
per
|
Discussion
P
a
per
|
Abstract
In order to achieve climate change mitigation, long-term decisions are required that must be reconciled with other societal goals that draw on the same resources. For example, ensuring food security for a growing population may require an expansion of crop land, thereby reducing natural carbon sinks or the area available for bio-energy 5
production. Here, we show that current impact-model uncertainties pose an important challenge to long-term mitigation planning and propose a new risk-assessment and decision framework that accounts for competing interests.
Based on cross-sectorally consistent simulations generated within the Inter-Sectoral Impact Model Intercomparison Project (ISI-MIP) we discuss potential gains and lim-10
itations of additional irrigation and trade-offs of the expansion of agricultural land as two possible response measures to climate change and growing food demand. We de-scribe an illustrative example in which the combination of both measures may close the supply demand gap while leading to a loss of approximately half of all natural carbon sinks.
15
We highlight current limitations of available simulations and additional steps required for a comprehensive risk assessment.
1 Introduction
Climate change and rising food demand motivate competing responses (Falloon and Betts, 2010; Warren, 2011) resulting in, for example, competition for land between food 20
and bio-energy production (Godfray et al., 2010a; Searchinger et al., 2008; Tilman et al., 2009). Mitigation, in particular, requires long-term planning, which is inevitably done under considerable uncertainty of e.g. future land required for food production.
Models already exist that couple surface hydrology, ecosystem dynamics, crop pro-duction (Bondeau et al., 2007; Rost et al., 2008) and agro-economic choices (Havlik et 25
ESDD
5, 1075–1099, 2014Uncertainty in crop production and its
role in mitigation planning
K. Frieler et al.
Title Page
Abstract Introduction
Conclusions References
Tables Figures
◭ ◮
◭ ◮
Back Close
Full Screen / Esc
Printer-friendly Version Interactive Discussion
Discussion
P
a
per
|
Discus
sion
P
a
per
|
Discussion
P
a
per
|
Discussion
P
a
per
carbon-cycle implications of LU changes and irrigation constraints. However, modeling such complicated systems requires a series of assumptions, in particular with respect to process representation and parameter values.
In addition to individual coupled analyses there is a large number of detailed sector-specific studies covering a wide range of process representations and parameter set-5
tings not represented by single, integrative studies (Haddeland et al., 2011; Sitch et al., 2008). A comprehensive assessment as requested by the Intergovernmental Panel on Climate Change (IPCC) must cover the full uncertainty range spanned by these models by quantifying the inter-impact-model spread.
Owing to its cross-sectoral design (Warszawski et al., 2013a) the recently launched 10
Inter-Sectoral Impact Model Intercomparison Project (ISI-MIP, http://www.isi-mip.org) provides an opportunity to bring this multi-impact-model dimension to the available integrative analyses of climate change impacts and response options, and allows for a cross-sectoral quantification of uncertainties cascading through the model chain.
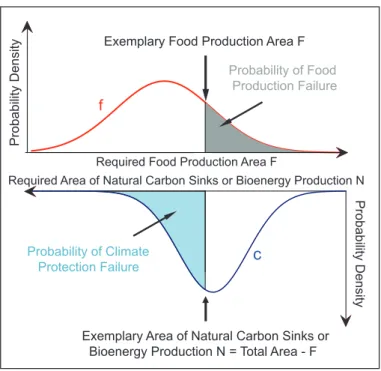
An associated risk-assessment framework may be described by two probability den-15
sity functions (pdfs, see Fig. 1): the red pdf (f) in the upper panel of Fig. 1 describes our knowledge of the required food-production area given certain management decisions (i.e. fertilizer use, irrigation fractions and selection of crop varieties) and a prescribed global-warming level. The width of the distribution is determined by uncertainties in food demand, regional climate change, and crop-model projections describing the ef-20
fect of climate change and CO2fertilization on crop yields. Intensification of production,
for example by increasing irrigation or fertilizer use, shifts the pdf to the left, since less land would be required to meet demand.
The blue pdf (c) illustrates our knowledge of the area of land required to be main-tained as natural carbon sinks or used for bio-energy production in order to limit global 25
ESDD
5, 1075–1099, 2014Uncertainty in crop production and its
role in mitigation planning
K. Frieler et al.
Title Page
Abstract Introduction
Conclusions References
Tables Figures
◭ ◮
◭ ◮
Back Close
Full Screen / Esc
Printer-friendly Version Interactive Discussion
Discussion
P
a
per
|
Discus
sion
P
a
per
|
Discussion
P
a
per
|
Discussion
P
a
per
|
efficiency shifts the distribution right as less CO2 has to be extracted from the atmo-sphere.
Mitigation strategies must compare the area of land required for food production (F) with the associated reduction of the area available for retention of natural carbon sinks and stocks or bio-energy production (N), such thatN=T−F, whereT=total available 5
area. Assuming food demand will always be met, even at the expense of climate protec-tion, the probability of climate protection failure (exceedance of a given global-warming target) is given by
P =
∞
Z
0
∞
Z
T−F
c(N)d N f(F)d F
where the inner integral describes the probability of climate protection failure for a fixed 10
agricultural areaF (blue area in Fig. 1).P cannot be determined without knowledge of the uncertainty associated with the required food-production area.
To date, the required pdfs have not yet been quantified except for a first attempt to quantify f based on multiple crop and economic models (Nelson et al., 2013). In this case the economic models evaluate different intensification options or the expansion 15
of agricultural land to translate crop yields and demand into land-use patterns. Here we restrict our analysis to purely biophysical questions and do not provide a full quan-tification of the different pdfs. We use simulations from 7 Global Gridded Crop Models (GGCMs; Rosenzweig et al., 2013b), 11 global hydrological models (Schewe et al., 2013), and 7 terrestrial bio-geochemical models (Friend et al., 2013; Warszawski et 20
al., 2013b) generated within ISI-MIP to address the following questions in the con-text of the described risk-assessment framework: (1) how large is the expected future supply-demand gap under climate change and CO2fertilization assuming present-day land-use (LU) patterns and fixed management (see Table S1 in the Supplement)?; (2) how much can be gained from additional water-availability-limited irrigation without 25
ESDD
5, 1075–1099, 2014Uncertainty in crop production and its
role in mitigation planning
K. Frieler et al.
Title Page
Abstract Introduction
Conclusions References
Tables Figures
◭ ◮
◭ ◮
Back Close
Full Screen / Esc
Printer-friendly Version Interactive Discussion
Discussion
P
a
per
|
Discus
sion
P
a
per
|
Discussion
P
a
per
|
Discussion
P
a
per
Not all of the crop models provide yield projections starting at present day levels (Rosenzweig et al., 2013a). In particular, EPIC provides potential yields assuming high fertilizer input, and LPJ-GUESS does not account for nutrient constraints. Therefore, we only compare relative changes in global production to relative changes in demand. Whilst the assumption that the effects of climate change are relatively independent 5
from the starting conditions is not necessarily valid, we focus onillustrating how such a comprehensive risk assessment could be conducted.
2 Data and methods
2.1 Input data for impact model simulations
All impact projections used within this study are forced by the same climate input 10
data (Warszawski et al., 2013a). For ISI-MIP daily climate data of five General Cir-culation Models (GCMs) derived from the CMIP5 archive (Taylor et al., 2012) were bias-corrected to match historical reference levels (Hempel et al., 2013). Here, we only use data from HadGEM2-ES, IPSL-CM5A-LR and MIROC-ESM-CHEM (see Ta-ble S6 in the Supplement) as these models reach a global mean warming of at least 15
4◦w.r.t. 1980–2010 levels under the Representative Concentration Pathway RCP8.5 – the highest of the four RCPs (Moss et al., 2010). All model runs accounting for changes in CO2concentrations are based on the relevant RCP-CO2input.
2.2 LU patterns and demand
The illustrative LU patterns applied to answer question three are based on projec-20
ESDD
5, 1075–1099, 2014Uncertainty in crop production and its
role in mitigation planning
K. Frieler et al.
Title Page
Abstract Introduction
Conclusions References
Tables Figures
◭ ◮
◭ ◮
Back Close
Full Screen / Esc
Printer-friendly Version Interactive Discussion
Discussion
P
a
per
|
Discus
sion
P
a
per
|
Discussion
P
a
per
|
Discussion
P
a
per
|
on the historical and RCP8.5 simulations by HadGEM2-ES and associated yields pro-vided by LPJmL (Nelson et al., 2013). The pattern is based on fixed CO2-concentration
(370 ppm) crop-model simulations. MAgPIE accounts for technological change increas-ing crop yields (applied growth rates are listed in Table S4 in the Supplement), while our analysis is based on crop-model simulations accounting for increasing levels of 5
atmospheric CO2concentrations but no technological change.
2.3 Impact model simulations
Our considered crop model ensemble represents the majority of GGCMs currently available to the scientific community (run in partnership with the Agricultural Model Intercomparison and Improvement Project (AgMIP; Rosenzweig et al., 2012)). In their 10
complementarity, the models cover a broad range of crop growth mechanisms and assumptions. The quantity projected differs from model to model, ranging from yields constrained by current management deficiencies to potential yields under effectively unconstrained nutrient supply (Table S1 in the Supplement and Rosenzweig et al., 2013b). The default configuration of most models includes an adjustment of the sow-15
ing dates in response to climate change, while total heat units to reach maturity are held constant except for PEGASUS and LPJ-GUESS. Three models include an auto-matic adjustment of cultivars. The applied hydrological and biomes models and their basic characteristics are listed in Tables S3 and S5 in the Supplement, respectively.
2.4 Partitioning of the uncertainty budget associated with crop production
20
changes
To separate the climate model induced uncertainty from the impact model uncertainty the GGCM-specific spread of the relative crop production changes at different lev-els of global warming is estimated by the standard deviation of the GGCM-specific mean values calculated over all climate model- (and RCP-) specific individual values 25
ESDD
5, 1075–1099, 2014Uncertainty in crop production and its
role in mitigation planning
K. Frieler et al.
Title Page
Abstract Introduction
Conclusions References
Tables Figures
◭ ◮
◭ ◮
Back Close
Full Screen / Esc
Printer-friendly Version Interactive Discussion
Discussion
P
a
per
|
Discus
sion
P
a
per
|
Discussion
P
a
per
|
Discussion
P
a
per
the production under maximum irrigation. The climate model or water-model-induced spread is estimated as the standard deviation over the individual deviation from these GGCM means.
3 Results
3.1 Adaptive pressure on future food production
5
Crop models project a wide range of relative changes in global wheat, maize, rice and soy production at different levels of global warming and associated CO2concentrations (first column of each global mean warming box in Fig. 2). At 4◦C the GGCM spread is more than a factor 5 larger than the spread due to the different climate models (estimated as described in Sect. 2.4) (wheat: 13 % vs. 2 %, maize: 18 % vs. 2 %, rice: 10
33 % vs. 2 %, and soy: 28 % vs. 4 %). This is partly due to the bias correction of the climate projections, which includes a correction of the historical mean temperature to a common observational data set (Hempel et al., 2013), and may depend on the selection of the three GCMs. However, the results suggest that the inter-crop-model spread will also be a major component of the uncertainty distribution associated with the area of 15
crop land required to meet future food demand.
Production changes are evaluated in the context of potential demand changes based on population and GDP projections. We consider the “middle of the road” Shared So-cioeconomic Pathway (SSP2) (Kriegler et al., 2010) (red lines in Fig. 2). Despite con-siderable uncertainty, it is evident that even if global production increases based on 20
optimistic assumptions about CO2 fertilization, this effect alone is unlikely to balance
demand increases driven by population growth and economic development (assuming that the observed relationship between per capita consumption patterns and incomes holds in the future and ignoring demand-side measures; Foley et al., 2011; Parfitt et al., 2010). In terms of the risk-assessment framework, the projections mean that there 25
ESDD
5, 1075–1099, 2014Uncertainty in crop production and its
role in mitigation planning
K. Frieler et al.
Title Page
Abstract Introduction
Conclusions References
Tables Figures
◭ ◮
◭ ◮
Back Close
Full Screen / Esc
Printer-friendly Version Interactive Discussion
Discussion
P
a
per
|
Discus
sion
P
a
per
|
Discussion
P
a
per
|
Discussion
P
a
per
|
as implemented in the models is not sufficient to meet the estimated food demand in 2050.
All GGCMs show a quasi-linear dependence on global mean temperature across the three different climate models, considered scenarios and range of global mean temper-ature changes (Figs. S5–S6 in the Supplement). Values range from−3 to+7 %◦C−1for 5
wheat,−8 to+6 %◦C−1for maize,−4 to+19 %◦C−1for rice and−8 to+12 %◦C−1 for soy (Table S2 in the Supplement, cf. Rosenzweig et al., 2014 for an update of the IPCC-AR4 Table 5.2 (Easterling et al., 2007)). It is not necessarily clear that crop-production changes can be expressed in a path-independent way as a function of global mean temperature change. In particular, CO2 concentrations are expected to modify the re-10
lationship with global mean temperature. However, for the 7 GGCMs and the RCP sce-narios considered here the path dependence is weak (Figs. S1-S4 in the Supplement). This suggests that the red pdfs shown in Fig. 1 could also be determined for specific global warming (and CO2) levels, but relatively independent of the specific pathway.
The disagreement in the sign of the change in crop production in Fig. 2 arises pre-15
dominantly from differences in the strength of the CO2 fertilization effect. Projections
based on fixed CO2 levels show a smaller spread and a general decrease in global production with increasing global warming (Table S2 and Fig. S6 in the Supplement). Given the ongoing debate about the efficiency of CO2 fertilization, in particular under
field conditions (Leakey et al., 2009; Long et al., 2006; Tubiello et al., 2007), and the 20
fact that most models do not account for nutrient constraints of this effect, projections are likely to be optimistic about the growth-promoting effects of increased atmospheric CO2concentrations.
3.2 Irrigation potential
Using different means of intensifying crop production on existing crop land, the red 25
ESDD
5, 1075–1099, 2014Uncertainty in crop production and its
role in mitigation planning
K. Frieler et al.
Title Page
Abstract Introduction
Conclusions References
Tables Figures
◭ ◮
◭ ◮
Back Close
Full Screen / Esc
Printer-friendly Version Interactive Discussion
Discussion
P
a
per
|
Discus
sion
P
a
per
|
Discussion
P
a
per
|
Discussion
P
a
per
(1) biophysical limits of yield response to irrigation, and (2) water availability. For il-lustrative purposes we assume that irrigation water (plus a minor component of water for industrial and household uses) is limited to 40 % (Gerten et al., 2011) of the an-nual runoffintegrated over the area of one Food Production Unit (FPU; Kummu et al., 2010). In addition, we assume a project efficiency of 60 %, where 60 % of the irrigation 5
water is ultimately available for the plant. Runoffprojections are based on 11 hydrolog-ical models participating in ISI-MIP (Table S3 in the Supplement). The available water is distributed according to where it leads to the highest yield increases per applied amount of water, as calculated annually. The approach only accounts for renewable surface and groundwater (for details of the method see Supplement).
10
While potential expansion of irrigation (or reduction, in the case of insufficient wa-ter availability for full irrigation of currently-irrigated areas) could compensate for the climate-induced adaptive pressure projected by some GGCMs (second column of each global mean warming level in Fig. 2), the feasible increase in global production is in-sufficient to balance the relative increase in demand by the end of the century. For 15
example, the production gap that needs to be overcome through additional technolog-ical progress or land-use changes amounts to 60 % (40–70 %) (median, min and max based on the GGCM-specific dots in Fig. 2) at 2◦C in 2050 for wheat w.r.t. average 1980–2010 production. In the case of rice, which is to a large extent already irrigated (Fig. S3 in the Supplement), the imposed water limitation reduces production in com-20
parison to full irrigation on currently irrigated areas for some of the GGCMs (see Elliott et al., 2013 for a more detailed discussion of limits of irrigation on currently irrigated land).
In terms of Fig. 1, additional irrigation shifts the red uncertainty distributions to the left. However, even with this shift, it remains unlikely that the currently cultivated land 25
will be sufficient to fulfill future food demand.
ESDD
5, 1075–1099, 2014Uncertainty in crop production and its
role in mitigation planning
K. Frieler et al.
Title Page
Abstract Introduction
Conclusions References
Tables Figures
◭ ◮
◭ ◮
Back Close
Full Screen / Esc
Printer-friendly Version Interactive Discussion
Discussion
P
a
per
|
Discus
sion
P
a
per
|
Discussion
P
a
per
|
Discussion
P
a
per
|
RCP8.5 climate projections, the GGCM-induced (5 models provide the necessary in-formation) spread at 4◦C is at least a factor of 4 larger than the spread induced by the hydrological models (wheat: wheat: 17 % vs. 4 %, maize: 21 % vs. 3 %, rice: 36 % vs. 2 %, soy: 41 % vs. 3 %).
The production levels shown in Fig. 2 do not reveal whether the increase is mainly 5
biophysically limited by potential yields under full irrigation, or by water availability. Fur-ther analysis (Fig. S7 in the Supplement) shows that production under the highly opti-mistic assumptions regarding water distribution is relatively close to production under unlimited irrigation on present day crop areas with the exception of wheat. In addition, we calculated the distance from rainfed production and production under full irrigation 10
for different project efficiencies (see Fig. S8 in the Supplement), respectively.
3.3 Effect of LU changes on global crop production
Intensification options are certainly not exhausted by additional irrigation. For example, other possibilities include improved fertilizer application, switching to higher yielding varieties, or implementing systems of multiple cropping per year. Historically, most of 15
the long-term increase in crop demand was met by a variety of intensification options (Godfray et al., 2010b; Tilman et al., 2011). However, the expansion of arable land may become more important in light of further increasing demand and possibly saturating increases in crop yields (Alston et al., 2009; Lin and Huybers, 2012). A recent study (Ray et al., 2013) suggests that observed increases in yields will not be sufficient to 20
meet future demand.
To illustrate the potential to increase yields via land-use change, we apply a LU pat-tern generated by the agro-economic LU model MAgPIE for the year 2085 (Sect. 2.2) in combination with the water distribution scheme discussed above (see third column of each global mean warming bin in Fig. 2). There is a very large spread in the rela-25
ESDD
5, 1075–1099, 2014Uncertainty in crop production and its
role in mitigation planning
K. Frieler et al.
Title Page
Abstract Introduction
Conclusions References
Tables Figures
◭ ◮
◭ ◮
Back Close
Full Screen / Esc
Printer-friendly Version Interactive Discussion
Discussion
P
a
per
|
Discus
sion
P
a
per
|
Discussion
P
a
per
|
Discussion
P
a
per
that MAgPIE’s optimization scheme results in highly concentrated agricultural patterns by 2085, exaggerating regional features of the GGCM simulations (Figs. S9–S12 in the Supplement). The relative increase in production by some crop models exceeds the projected demand increase. However, in spite of the strong expansion of cultivated land, with particularly high losses in the Amazon rainforest (see Fig. S14 in the Sup-5
plement), the lower ends of the samples still do not balance the projected demand increase in 2050 (except for wheat). In terms of Fig. 1 these results indicate a very wide uncertainty distribution associated with the area required for food production. The level of expansion given by the MAgPIE pattern does not seem to be sufficient to fulfill the future demand with high confidence.
10
3.4 Effect of LU changes on natural carbon sinks and stocks
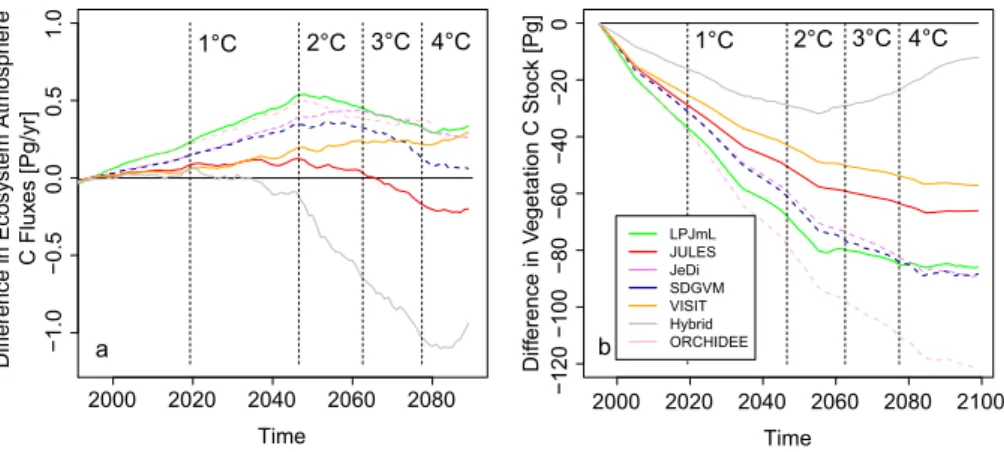
The increase in production by LU changes comes at the cost of natural vegetation. The considered illustrative reduction of the area of natural vegetation reaches 480 Mha in 2085 compare to 1995 levels. To estimate the associated potential loss of carbon sinks, the ecosystem-atmosphere carbon flux is spatially integrated over, (1) the 1995 area 15
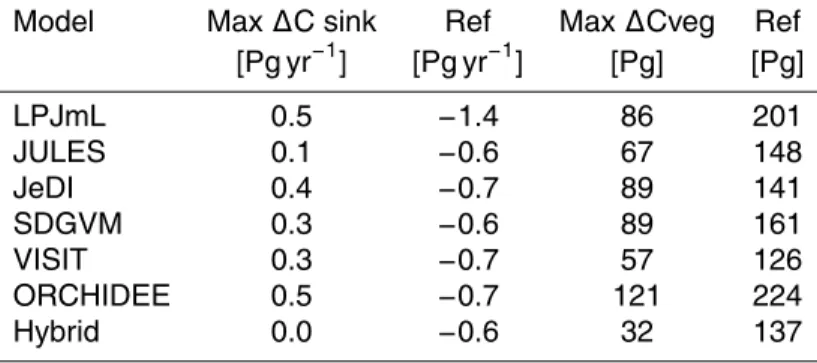
of natural vegetation provided by MAgPIE in each year; and (2) the shrinking area of natural vegetation. Biophysical simulations are based on HadGEM2-ES and RCP8.5. For all but one vegetation model (Hybrid) the reduction of the area of natural vegeta-tion (Fig. 3) means a loss of carbon sinks. There is a wide spread in losses, in some cases reaching 50 % compared to the reference period (see Table 1). For the Hybrid 20
model natural vegetation turns into a carbon source over the fixed 1995 area of nat-ural vegetation by mid-century (cf. Friend et al., 2013) (Fig. S15 in the Supplement), which means that a reduction in natural vegetation leads to an increase in the global carbon sink. Our approach does not account for the carbon released from soil after LU changes (Smith, 2008). While agricultural land can be considered as carbon neutral 25
ESDD
5, 1075–1099, 2014Uncertainty in crop production and its
role in mitigation planning
K. Frieler et al.
Title Page
Abstract Introduction
Conclusions References
Tables Figures
◭ ◮
◭ ◮
Back Close
Full Screen / Esc
Printer-friendly Version Interactive Discussion
Discussion
P
a
per
|
Discus
sion
P
a
per
|
Discussion
P
a
per
|
Discussion
P
a
per
|
multi-model median of about 85 Pg (about 8.5 years of current CO2 emissions) by the end of the century. Results for the experiments with fixed present-day CO2 are shown
in Fig. S16 in the Supplement.
4 Discussion and conclusion
The competition between food security for a growing population and the protection of 5
ecosystems and climate poses a dilemma. This dilemma is fundamentally cross sec-toral, and its analysis requires an unprecedented cross-secsec-toral, multi-impact-model-analysis of the adaptive pressures on global food production and possible response strategies. To date, a full quantification of the probability distributions necessary to address the issue in a risk-assessment framework has been inhibited by the lack of 10
cross-sectorally consistent multi-impact-model projections. Here, simulations gener-ated within ISI-MIP were applied to achieve the first steps to address the gap.
The spread across different impact models is shown to be a major component of the uncertainty of climate impact projections. In the case of multiple interests and conflict-ing response measures this uncertainty means a dilemma as ensurconflict-ing one target with 15
high certainty means putting another one at particularly high risk.
For a full quantification of the probability distributions illustrated in Fig. 1 multiple crop models, simulations and projections of socio-economic development have to be translated into a pdf of the “required food production area” accounting, for example, for changing trade patterns (Nelson et al., 2013). This integration has already started 20
within the AgMIP-ISI-MIP cooperation and will enable the generation of a probability distribution of the required food production area. However, current estimates (Nelson et al., 2013) are based on crop model runs that do not account for the CO2-fertilization effect and only a limited number of models provide explicit LU patterns in addition to the aggregated area.
25
ESDD
5, 1075–1099, 2014Uncertainty in crop production and its
role in mitigation planning
K. Frieler et al.
Title Page
Abstract Introduction
Conclusions References
Tables Figures
◭ ◮
◭ ◮
Back Close
Full Screen / Esc
Printer-friendly Version Interactive Discussion
Discussion
P
a
per
|
Discus
sion
P
a
per
|
Discussion
P
a
per
|
Discussion
P
a
per
must be quantified. Therefore, the set of demand-fullfilling LU-patterns has to be pro-vided as input for multi-model biomes simulations. ISI-MIP is designed to facilitate this kind of cross-sectoral integration, which can then be employed to fulfil the urgent de-mand for a comprehensive assessment of the impacts of climate change, and our options to respond to these impacts and socio-economic developments, along with the 5
corresponding trade-offs.
Our illustration of the uncertainty dilemma is by no means complete. In addition to the irrigation scheme considered here, a more comprehensive consideration of man-agement options for increasing crop yields on a given land area is required. To this end, the representation of management within the crop model simulations needs to be 10
harmonized to quantify the effect of different management assumptions on crop-model projections. These effects of these assumptions should be considered separately to the crop-model spread due to uncertain representation of biophysical processes.
The Supplement related to this article is available online at doi:10.5194/esdd-5-1075-2014-supplement.
15
Acknowledgements. We acknowledge the World Climate Research Programme’s Working Group
on Coupled Modelling, which is responsible for CMIP, and thank the climate modeling groups (listed in Table S6 in the Supplement) for producing and making available their model output. For CMIP the US Department of Energy’s Program for Climate Model Diagnosis and Inter-comparison provides coordinating support and led development of software infrastructure in
20
partnership with the Global Organization for Earth System Science Portals. This work has been conducted under the framework of ISI-MIP and in cooperation with AgMIP. The ISI-MIP Fast Track project was funded by the German Federal Ministry of Education and Research (BMBF) with project funding reference number 01LS1201A. Responsibility for the content of this publication lies with the author. The research leading to these results has received funding
25
ESDD
5, 1075–1099, 2014Uncertainty in crop production and its
role in mitigation planning
K. Frieler et al.
Title Page
Abstract Introduction
Conclusions References
Tables Figures
◭ ◮
◭ ◮
Back Close
Full Screen / Esc
Printer-friendly Version Interactive Discussion
Discussion
P
a
per
|
Discus
sion
P
a
per
|
Discussion
P
a
per
|
Discussion
P
a
per
|
supported by the Joint DECC/Defra Met Office Hadley Centre Climate Programme (GA01101). The research leading to these results has received funding from the European Union’s Seventh Framework Programme [FP7/2007-2013] under grant agreement no. 266992. Y. Masaki and K. Nishina were supported by the Environment Research and Technology Development Fund (S-10) of the Ministry of the Environment, Japan.
5
References
Alston, J. M., Beddow, J. M., and Pardey, P. G.: Agricultural research, productivity, and food prices in the long run, Science, 325, 1209–1210, doi:10.1126/science.1170451, 2009. Bodirsky, B. L., Rolinski, S., Biewald, A., Weindl, I., Popp, A., and Lotze-Campen, H.: Global
food demand scenarios for the 21st century, Food Security, under review, 2014.
10
Bondeau, A., Smith, P. C., Zaehle, S., Schaphoff, S., Lucht, W., Cramer, W., Gerten, D., Lotze-Campen, H., Müller, C., Reichstein, M., and Smith, B.: Modelling the role of agriculture for the 20th century global terrestrial carbon balance, Global Chang. Biol., 13, 679–706, doi:10.1111/j.1365-2486.2006.01305.x, 2007.
Easterling, W. E., Aggarwal, P. K., Batima, P., Brander, K. M., Erda, L., Howden, S. M., Kirilenko,
15
A., Morton, J., Soussana, J.-F., Schmidhuber, J., and Tubiello, F. N.: Climate change 2007: Impacts, Adaptation and Vulnerability, Chaper 5: Food, Fibre and Forest Products, in: Contri-bution of Working Group II to the Fourth Assessment Report of the Intergovernmental Panel on Climate Change, Cambridge, UK, 2007.
Elliott, J., Deryng, D., M üller, C., Frieler, K., Konzmann, M., Gerten, D., Glotter, M., Flörke,
20
M., Wada, Y., Eisner, S., Folberth, C., Foster, I., Gosling, S. N., Haddeland, I., Khabarov, N., Ludwig, F., Masaki, Y., Olin, S., Rosenzweig, C., Ruane, A., Satoh, Y., Schmid, E., Stacke, T., Tang, Q., and Wisser, D.: Constraints and potentials of future irrigation water availability on agricultural production under climate change, P. Natl. Acad. Sci. USA, 111, 3239–3244, doi:10.1073/pnas.1222474110, 2013.
25
Falloon, P. D. and Betts, R. A.: Climate impacts on European agriculture and water management in the context of adaptation and mitigation – the importance of an integrated approach, Sci. Total Environ., 408, 5667–5687, 2010.
Foley, J. A., Ramankutty, N., Brauman, K. A., Cassidy, E. S., Gerber, J. S., Johnston, M., Mueller, N. D., O’Connell, C., Ray, D. K., West, P. C., Balzer, C., Bennett, E. M.,
ESDD
5, 1075–1099, 2014Uncertainty in crop production and its
role in mitigation planning
K. Frieler et al.
Title Page
Abstract Introduction
Conclusions References
Tables Figures
◭ ◮
◭ ◮
Back Close
Full Screen / Esc
Printer-friendly Version Interactive Discussion
Discussion
P
a
per
|
Discus
sion
P
a
per
|
Discussion
P
a
per
|
Discussion
P
a
per
Carpenter, S. R., Hill, J., Monfreda, C., Polasky, S., Rockström, J., Sheehan, J., Siebert, S., Tilman, D., and Zaks, D. P. M.: Solutions for a cultivated planet, Nature, 478, 337–342, doi:10.1038/nature10452, 2011.
Friend, A. D., Richard, B., Patricia, C., Philippe, C., Douglas, B. C., Rutger, D., Pete, F., Akihiko, I., Ron, K., Rozenn, M., Axel, K., Mark, R., Wolfgang, L., Nishina, K., Sebastian, O., Ryan, P.,
5
Peylin, P., Tim, T. R., Sibyll, S., Vuichard, N., Lila, W., Wiltshire, A., and Ian, W.: Carbon res-idence time dominates uncertainty in terrestrial vegetation responses to future climate and atmospheric CO2, P. Natl. Acad. Sci. USA, 111, 3280–3285, doi:10.1073/pnas.1222477110, 2013.
Gerten, D., Heinke, J., Hoff, H., Biemans, H., Fader, M., and Waha, K.: Global Water Availability
10
and Requirements for Future Food Production, J. Hydrometeorol., 12, 885–899, 2011. Godfray, H. C. J., Beddington, J. R., Crute, I. R., Haddad, L., Lawrence, D., Muir, J. F., Pretty,
J., Robinson, S., Thomas, S. M., and Toulmin, C.: Food security: the challenge of feeding 9 billion people, Science, 327, 812–818, doi:10.1126/science.1185383, 2010a.
Godfray, H. C. J., Crute, I. R., Haddad, L., Lawrence, D., Muir, J. F., Nisbett, N., Pretty, J.,
15
Robinson, S., Toulmin, C., and Whiteley, R.: The future of the global food system, Philos. T. Roy. Soc. Lond. B, 365, 2769–2777, doi:10.1098/rstb.2010.0180, 2010b.
Haddeland, I., Clark, D. B., Franssen, W., Ludwig, F., Voß, F., Arnell, N. W., Bertrand, N., Best, M., Folwell, S., Gerten, D., Gomes, S., Gosling, S. N., Hagemann, S., Hanasaki, N., Harding, R., Heinke, J., Kabat, P., Koirala, S., Oki, T., Polcher, J., Stacke, T., Viterbo, P., Weedon, G.
20
P., and Yeh, P.: Multimodel Estimate of the Global Terrestrial Water Balance: Setup and First Results, J. Hydrometeorol., 12, 869–884, doi:10.1175/2011JHM1324.1, 2011.
Havlik, P., Schneider, U. A., Schmid, E., Böttcher, H., Fritz, S., Skalsk`y, R., Aoki, K., De Cara, S., Kindermann, G., Kraxner, F., Leduc, S., McCallum, I., Mosnier, A., Sauer, T., and Obersteiner, M.: Global land-use implications of first and second generation biofuel targets, Energy Policy,
25
39, 5690–5702, 2011.
Hempel, S., Frieler, K., Warszawski, L., Schewe, J., and Piontek, F.: A trend-preserving bias correction – the ISI-MIP approach, Earth Syst. Dynam., 4, 219–236, doi:10.5194/esd-4-219-2013, 2013.
Kriegler, E., O’Neill, B. C., Hallegatte, S., Kram, T., Lempert, R. J., Moss, R. H., and Wilbanks,
30
ESDD
5, 1075–1099, 2014Uncertainty in crop production and its
role in mitigation planning
K. Frieler et al.
Title Page
Abstract Introduction
Conclusions References
Tables Figures
◭ ◮
◭ ◮
Back Close
Full Screen / Esc
Printer-friendly Version Interactive Discussion
Discussion
P
a
per
|
Discus
sion
P
a
per
|
Discussion
P
a
per
|
Discussion
P
a
per
|
Kummu, M., Ward, P., de Moel, H., and Varis, O.: Is physical water scarcity a new phenomenon? global assessment of water shortage over the last two millennia, Environ. Res. Lett., 5, 034006, doi:10.1088/1748-9326/5/3/034006, 2010.
Leakey, A. D. B., Ainsworth, E. A., Bernacchi, C. J., Rogers, A., Long, S. P., and Ort, D. R.: Elevated CO2 effects on plant carbon, nitrogen, and water relations: six important lessons
5
from FACE, J. Exp. Bot., 60, 2859–2876, 2009.
Lin, M. and Huybers, P.: Reckoning wheat yield trends, Environ. Res. Lett., 7, 024016, doi:10.1088/1748-9326/7/2/024016, 2012.
Long, S. P., Ainsworth, E. A., Leakey, A. D. B., Nösberger, J., and Ort, D. R.: Food for thought: lower-than-expected crop yield stimulation with rising CO2 concentrations, Science, 312,
10
1918–21, doi:10.1126/science.1114722, 2006.
Lotze-Campen, H., Müller, C., Bondeau, A., Rost, S., Popp, A., and Lucht, W.: Global food demand, productivity growth, and the scarcity of land and water resources: a spatially ex-plicit mathematical programming approach, Agric. Econ., 39, 325–338, doi:10.1111/j.1574-0862.2008.00336.x, 2008a.
15
Lotze-Campen, H., Müller, C., Bondeau, A., Rost, S., Popp, A., and Lucht, W.: Global food demand, productivity growth, and the scarcity of land and water resources: a spatially explicit mathematical programming approach, Agric. Econ., 39, 325–338, 2008b.
Moss, R. H., Edmonds, J. A., Hibbard, K. A., Manning, M. R., Rose, S. K., van Vuuren, D. P., Carter, T. R., Emori, S., Kainuma, M., Kram, T., Meehl, G. A., Mitchell, J. F. B., Nakicenovic,
20
N., Riahi, K., Smith, S. J., Stouffer, R. J., Thomson, A. M., Weyant, J. P., and Wilbanks, T. J.: The next generation of scenarios for climate change research and assessment, Nature, 463, 747–756, 2010.
Müller, C., Eickhout, B., Zaehle, S., Bondeau, A., Cramer, W., and Lucht, W.: Effects of changes in CO2, climate, and land use on the carbon balance of the land biosphere during the 21st
25
century, J. Geophys. Res., 112, G02032, doi:10.1029/2006JG000388, 2007.
Nelson, G. C., Ahammad, H., Deryng, D., Elliott, J., Fujimori, S., Havlik, P., Heyhoe, E., Page, K., von Lampe, M., Lotze-Campen, H., Daniel Mason, D., van Meijl, H., van der Mensbrugghe, D., Müller, C., Robertson, R., Sands, R. D., Schmid, E., Schmitz, C., Tabeau, A., Valin, H., and Willenbockel, D.: Climate change effects on agriculture: Economic responses to biophysical
30
ESDD
5, 1075–1099, 2014Uncertainty in crop production and its
role in mitigation planning
K. Frieler et al.
Title Page
Abstract Introduction
Conclusions References
Tables Figures
◭ ◮
◭ ◮
Back Close
Full Screen / Esc
Printer-friendly Version Interactive Discussion
Discussion
P
a
per
|
Discus
sion
P
a
per
|
Discussion
P
a
per
|
Discussion
P
a
per
Parfitt, J., Barthel, M., and Macnaughton, S.: Food waste within food supply chains: quan-tification and potential for change to 2050, Philos. T. Roy. Soc. Lond. B, 365, 3065–3081, doi:10.1098/rstb.2010.0126, 2010.
Ray, D. K., Mueller, N. D., West, P. C., and Foley, J. A.: Yield Trends Are Insufficient to Double Global Crop Production by 2050, edited by: Hart, J. P., PLoS One, 8, e66428,
5
doi:10.1371/journal.pone.0066428, 2013.
Rosenzweig, C., Jones, J. W., Hatfield, J. L., Ruane, A. C., Boote, K. J., Thorburn, P., An-tle, J. M., Nelson, G. C., Porter, C., Janssen, S., Asseng, S., Basso, B., Ewert, F., Wallach, D., Baigorria, G., and Winter, J. M.: The Agricultural Model Intercomparison and Improve-ment Project (AgMIP): Protocols and pilot studies, Agr. Forest Meteorol., 170, 166–182,
10
doi:10.1016/j.agrformet.2012.09.011, 2012.
Rosenzweig, C., Elliott, J., Deryng, D., Ruane, A. C., Müller, C., Arneth, A., Boote, K. J., Fol-berth, C., Glotter, M., Khabarov, N., Neumann, K., Piontek, F., Pugh, T. A. M., Schmid, E., Stehfest, E., Yang, H., and Jones, J. W.: Assessing agricultural risks of climate change in the 21st century in a global gridded crop model intercomparison, P. Natl. Acad. Sci. USA, 14,
15
1–6, doi:10.1073/pnas.1222463110, 2013a.
Rosenzweig, C., Elliott, J., Deryng, D., Ruane, A. C., Müller, C., Arneth, A., Boote, K. J., Fol-berth, C., Glotter, M., Khabarov, N., Neumann, K., Piontek, F., Pugh, T. A. M., Schmid, E., Stehfest, E., Yang, H., and Jones, J. W.: Assessing agricultural risks of climate change in the 21st century in a global gridded crop model intercomparison, P. Natl. Acad. Sci. USA, 111,
20
3268–3273, doi:10.1073/pnas.1222463110, in press, 2013b.
Rost, S., Gerten, D., Bondeau, A., Lucht, W., Rohwer, J., and Schaphoff, S.: Agricultural green and blue water consumption and its influence on the global water system, Water Resour. Res., 44, 1–17, doi:10.1029/2007WR006331, 2008.
Schewe, J., Heinke, J., Gerten, D., Haddeland, I., Arnell, N. W., Clark, D. B., Dankers, R., Eisner,
25
S., Fekete, B. M., Colón-González, F. J., Gosling, S. N., H., K., Liu, X., Masaki, Y., Portmann, F. T., Satoh, Y., Stacke, T., Tang, Q., Wada, Y., Wisser, D., Albrecht, T., Frieler, K., Piontek, F., Warszawski, L., and Kabat, P.: Multi-model assessment of water scarcity under climate change, P. Natl. Acad. Sci. USA, 111, 3245–2350, doi:10.1073/pnas.1222460110, 2013. Schmitz, C., Biewald, A., Lotze-Campen, H., Popp, A., Dietrich, J. P., Bodirsky, B.,
30
ESDD
5, 1075–1099, 2014Uncertainty in crop production and its
role in mitigation planning
K. Frieler et al.
Title Page
Abstract Introduction
Conclusions References
Tables Figures
◭ ◮
◭ ◮
Back Close
Full Screen / Esc
Printer-friendly Version Interactive Discussion
Discussion
P
a
per
|
Discus
sion
P
a
per
|
Discussion
P
a
per
|
Discussion
P
a
per
|
Searchinger, T., Heimlich, R., Houghton, R. A., Dong, F., Elobeid, A., Fabiosa, J., Tok-goz, S., Hayes, D. and Yu, T.-H.: Use of U.S. croplands for biofuels increases green-house gases through emissions from land-use change, Science, 319, 1238–1240, doi:10.1126/science.1151861, 2008.
Sitch, S., Huntingford, C., Gedney, N., Levy, P. E., Lomas, M., Piao, S. L., Betts, R., Ciais,
5
P., Cox, P., Friedlingstein, P., Jones, C. D., Prentice, I. C., and Woodward, F. I.: Evaluation of the terrestrial carbon cycle, future plant geography and climate-carbon cycle feedbacks using five Dynamic Global Vegetation Models (DGVMs), Global Change Biol., 14, 2015– 2039, doi:10.1111/j.1365-2486.2008.01626.x, 2008.
Smith, P.: Land use change and soil organic carbon dynamics, Nutr. Cycl. Agroecosyst., 812,
10
169–178, 2008.
Stehfest, E., Van Den Berg, M., Woltjer, G., Msangi, S., and Westhoek, H.: Options to reduce the environmental effects of livestock production – Comparison of two economic models, Agric. Syst., 114, 38–53, doi:10.1016/j.agsy.2012.07.002, 2013.
Taylor, K. E., Stouffer, R. J., and Meehl, G. A.: An Overview of CMIP5 and the Experiment
15
Design, B. Am. Meteorol. Soc., 93, 485–498, doi:10.1175/BAMS-D-11-00094.1, 2012. Tilman, D., Socolow, R., Foley, J. A., Hill, J., Larson, E., Lynd, L., Pacala, S., Reilly, J.,
Searchinger, T., Somerville, C., and Williams, R.: Beneficial Biofuels – The Food, Energy, and Environment Trilemma, Science, 325, 270–271, 2009.
Tilman, D., Balzer, C., Hill, J., and Befort, B. L.: Global food demand and the
sus-20
tainable intensification of agriculture, P. Natl. Acad. Sci. USA, 108, 20260–20264, doi:10.1073/pnas.1116437108, 2011.
Tubiello, F. N., Amthor, J. S., Boote, K. J., Donatelli, M., Easterling, W., Fischer, G., Gifford, R. M., Howden, M., Reilly, J., and Rosenzweig, C.: Crop response to elevated CO2 and world food supply, Eur. J. Agron., 26, 215–223, doi:10.1016/j.eja.2006.10.002, 2007.
25
Warren, R.: The role of interactions in a world implementing adaptation and mitigation solutions to climate change, Philos. Trans. A. Math. Phys. Eng. Sci., 369, 217–241, doi:10.1098/rsta.2010.0271, 2011.
Warszawski, L., Frieler, K., Huber, V., Piontek, F., Serdeczny, O., and Schewe, J.: The Intersec-toral Impact Model Intercomparison Project (ISI-MIP): Project framework description, P. Natl.
30
Acad. Sci. USA, 111, 3228–3232, doi:10.1073/pnas.1312330110, 2013a.
ESDD
5, 1075–1099, 2014Uncertainty in crop production and its
role in mitigation planning
K. Frieler et al.
Title Page
Abstract Introduction
Conclusions References
Tables Figures
◭ ◮
◭ ◮
Back Close
Full Screen / Esc
Printer-friendly Version Interactive Discussion
Discussion
P
a
per
|
Discus
sion
P
a
per
|
Discussion
P
a
per
|
Discussion
P
a
per
|
Table 1.Maximal loss of carbon sinks and the vegetation carbon stock as estimated for the illustrative LU change scenario (based on colored lines in panel a and b of Fig. 3). The max-imum of the transient changes (column 2 and 4) is compared to mean values of the C-fluxes and the C-stock averaged over the reference period 1980–2010 (column 3 and 5).
Model Max∆C sink Ref Max∆Cveg Ref [Pg yr−1] [Pg yr−1] [Pg] [Pg]
LPJmL 0.5 −1.4 86 201 JULES 0.1 −0.6 67 148 JeDI 0.4 −0.7 89 141 SDGVM 0.3 −0.6 89 161 VISIT 0.3 −0.7 57 126
ORCHIDEE 0.5 −0.7 121 224
ESDD
5, 1075–1099, 2014Uncertainty in crop production and its
role in mitigation planning
K. Frieler et al.
Title Page
Abstract Introduction
Conclusions References
Tables Figures
◭ ◮
◭ ◮
Back Close
Full Screen / Esc
Printer-friendly Version Interactive Discussion
Discussion
P
a
per
|
Discus
sion
P
a
per
|
Discussion
P
a
per
|
Discussion
P
a
per
Probability of Climate Protection Failure
Probability of Food Production Failure
c f
Exemplary Food Production Area F
Exemplary Area of Natural Carbon Sinks or Bioenergy Production N = Total Area - F
Probability Density
Probability Density
Required Food Production Area F
Required Area of Natural Carbon Sinks or Bioenergy Production N
ESDD
5, 1075–1099, 2014Uncertainty in crop production and its
role in mitigation planning
K. Frieler et al.
Title Page
Abstract Introduction
Conclusions References
Tables Figures
◭ ◮
◭ ◮
Back Close
Full Screen / Esc
Printer-friendly Version Interactive Discussion
Discussion
P
a
per
|
Discus
sion
P
a
per
|
Discussion
P
a
per
|
Discussion
P
a
per
|
0
50
100
Relati
v
e Change in Global Production [%]
1 2 3 4
0
50
100
Level of Global Warming [°C]
1 2 3 4
Wheat Maize
Rice Soy
2020 2050 2100
2020 2050 2100
2020 2050 2100
EPIC GEPIC IMAGE
LPJ−GUESS
LPJmL pDSSAT
PEGASUS
0
50
100
150
ESDD
5, 1075–1099, 2014Uncertainty in crop production and its
role in mitigation planning
K. Frieler et al.
Title Page
Abstract Introduction
Conclusions References
Tables Figures
◭ ◮
◭ ◮
Back Close
Full Screen / Esc
Printer-friendly Version Interactive Discussion
Discussion
P
a
per
|
Discus
sion
P
a
per
|
Discussion
P
a
per
|
Discussion
P
a
per
|
2000 2020 2040 2060 2080
−1.0
−0.5
0.0
0.5
1.0
Time
Dif
ference in Ecosystem Atmosphere
C Flu
x
es [Pg/yr]
2000 2020 2040 2060 2080 2100
−120
−100
−80
−60
−40
−20
0
Time
Dif
ference in
V
egetation C Stock [Pg]
1°C 2°C 3°C 4°C 1°C 2°C 3°C 4°C
a b