Selection through Multi-Attribute Trustworthiness
Evaluation
Shuai Ding1,2*, Chen-Yi Xia3*, Kai-Le Zhou1,2, Shan-Lin Yang1,2, Jennifer S. Shang4
1School of Management, Hefei University of Technology, Hefei, P.R. China,2Key Laboratory of Process Optimization and Intelligent Decision-Making, Ministry of Education, Hefei, P.R. China,3Tianjin Key Laboratory of Intelligence Computing and Novel Software Technology and Key Laboratory of Computer Vision and System (Ministry of Education), Tianjin University of Technology, Tianjin, P.R. China,4The Joseph M. Katz Graduate School of Business, University of Pittsburgh, Pittsburgh, Pennsylvania, United States of America
Abstract
Facing a customer market with rising demands for cloud service dependability and security, trustworthiness evaluation techniques are becoming essential to cloud service selection. But these methods are out of the reach to most customers as they require considerable expertise. Additionally, since the cloud service evaluation is often a costly and time-consuming process, it is not practical to measure trustworthy attributes of all candidates for each customer. Many existing models cannot easily deal with cloud services which have very few historical records. In this paper, we propose a novel service selection approach in which the missing value prediction and the multi-attribute trustworthiness evaluation are commonly taken into account. By simply collecting limited historical records, the current approach is able to support the personalized trustworthy service selection. The experimental results also show that our approach performs much better than other competing ones with respect to the customer preference and expectation in trustworthiness assessment.
Citation:Ding S, Xia C-Y, Zhou K-L, Yang S-L, Shang JS (2014) Decision Support for Personalized Cloud Service Selection through Multi-Attribute Trustworthiness Evaluation. PLoS ONE 9(6): e97762. doi:10.1371/journal.pone.0097762
Editor:Peter Csermely, Semmelweis University, Hungary
ReceivedMarch 15, 2014;AcceptedApril 19, 2014;PublishedJune 27, 2014
Copyright:ß2014 Ding et al. This is an open-access article distributed under the terms of the Creative Commons Attribution License, which permits unrestricted use, distribution, and reproduction in any medium, provided the original author and source are credited.
Data Availability:The authors confirm that all data underlying the findings are fully available without restriction. All data are included within the manuscript.
Funding:This work was supported by the National Natural Science Foundation of China through grant Nos. 61374169, 71131002, and 71201042, the National Key Basic Research Program of China through grant No. 2013CB329603 and the Specialized Research Fund for the Doctoral Program of Higher Education of MOE of China through grant No. 20120111110020. These funders had no role in study design, data collection and analysis, decision to publish, or preparation of the manuscript.
Competing Interests:The authors have declared that no competing interests exist.
* Email: [email protected] (SD); [email protected] (CYX)
Introduction
Cloud computing has become the driver for innovation in the recent years, from startups (e.g. Dropbox, Instagram) to established enterprises (Samsung). They are all using cloud computing to better serve their customers around the world [1]. Cloud service is also gaining wide acceptance and becoming popular to individuals as it reduces hardware and licensing costs, and it is scalable and allows users to work from any computer anywhere.
Several leading IT enterprises including Google, IBM, Micro-soft, and Amazon have started to offer cloud services to their customers [2–4]. While many small and medium-sized enterprises (SMEs) and individual customers prefer to apply cloud services to build their business system or personal applications, they are often facing two major challenges at the selection time: (1) multiple cloud services are often available by different venders providing similar functional properties (i.e., ‘‘functionally-equivalent’’). Cus-tomers usually lack appropriate, qualified, sufficient information and benchmarks to assess cloud services with regard to individual preferences and market dynamics [5]; (2) although cloud service vendors are struggling to improve service quality and perfor-mance, cloud computing are not necessarily trustworthy – unhandled exceptions and crashes may cause cloud service to
deviate dramatically from the expectation [6,7]. Therefore, there is an increasing demand to help the non-expert customers with the selection of trustworthy cloud service.
The trustworthiness of cloud service affects customers’ percep-tion towards service quality, which has significant bearing on customer satisfaction and royalty. The trustworthy attributes include reliability, scalability, availability, safety, security, etc [8– 10]. Designing a general and comprehensive analytical model for trustworthiness evaluation is challenging, as the model needs the assessor to achieve, in reasonable time, useful results to determine the best service option. Due to their commercial value (similar to online recommendation system), several evaluation models [11– 14] have been proposed by academia and industry lately. These models focus on quantitative analysis and evaluate trustworthiness through a collectively exhaustive dataset.
theoretical foundation to derive a generic trustworthiness model to support the evaluation of cloud service.
There have been some attempts to improve the accuracy of cloud service assessment by a CF process. However, very little attention is paid to the trustworthiness of cloud service, and no interest is given to the case when significant attribute values are missing. The lack of general and formal methodology can be attributed to the large process gap between the cloud service recommenders and trustworthiness researchers. To deal with this challenge, we propose a new CF approach to make use of hidden information (i.e. experience usability, value distribution) to measure the similarity between different services. Moreover, to support personalized selection of cloud services, we also provide a natural treatment for multi-attribute aggregation taking into account customer’s preference and expectation.
Background
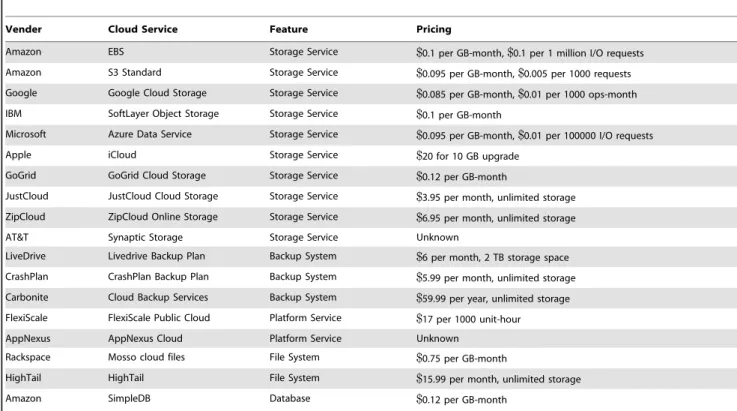
In the current market, multiple cloud services of similar functions are often available for specific domains. For example, in cloud storage service (e.g. data service, online file system, online backup plan), over 100 functionally-equivalent cloud services are offered by vendors. Some typical examples can be found in Table 1. Given the lack of cloud computing experience of non-expert customers, it is tedious to manually select an appropriate candidate from a set of functionally-equivalent services. Therefore, cloud service evaluation through quality analysis has gained much attraction among service-oriented computing and cloud comput-ing communities over the past two decades.
Given the intricate interactions among QoS (Quality of Service) attributes, customer preferences and market dynamics that jointly influence the perceived quality of cloud services, developing a market-relevant analytical model is crucial to cloud service selection [16–18]. Due to their commercial value and the
associated research challenges, many researchers and practitioners have studied the topics. Two types of service selection models are widely examined: evaluation-focused service selection models and prediction-focused service selection models.
By achieving market-relevant evaluations, customers can identify risks and benefits of each cloud service application and choose the best for adoption. The most employed evaluation models include: AHP-based cloud service ranking [19], reputa-tion-aware service rating [20], trust-aware service selection [21], brokerage-based selection [22], SLA-based cloud trustworthiness estimation [11], trustworthy service selection [23]. Although these techniques can accurately and exhaustively estimate service quality, their implementation is time-consuming and costly.
Instead of real-world cloud service invocations, the prediction-focused service selection models can produce QoS values or service ranking using collaborative filtering (CF). The CF approaches for cloud service selection can be categorized as: item-based approaches [24], customer-based approaches [25], their fusion approaches [26], model-based approaches [27], and ranking-oriented approaches [28], where the first three categories are rating-oriented approaches. These approaches help assessors predict the missing attribute values by exploiting neighbors’ usage experiences. Several collaborative filtering approaches for cloud service selection have been studied, but they did not consider customer preference and expectation in trustworthiness assess-ment.
In the prediction process, similar neighbors (customers or services) are identified to generate useful collaborative informa-tion. Popular choices for similarity estimation include Pearson correlation coefficient (PCC) [29] and vector similarity (VS) [30]. Since these measures only consider the numerical relationship between different ratings, they remain imprecise and confusing for estimating the neighbor similarity to support missing value
Table 1.Online cloud storage services.
Vender Cloud Service Feature Pricing
Amazon EBS Storage Service $0.1 per GB-month,$0.1 per 1 million I/O requests
Amazon S3 Standard Storage Service $0.095 per GB-month,$0.005 per 1000 requests
Google Google Cloud Storage Storage Service $0.085 per GB-month,$0.01 per 1000 ops-month
IBM SoftLayer Object Storage Storage Service $0.1 per GB-month
Microsoft Azure Data Service Storage Service $0.095 per GB-month,$0.01 per 100000 I/O requests
Apple iCloud Storage Service $20 for 10 GB upgrade
GoGrid GoGrid Cloud Storage Storage Service $0.12 per GB-month
JustCloud JustCloud Cloud Storage Storage Service $3.95 per month, unlimited storage
ZipCloud ZipCloud Online Storage Storage Service $6.95 per month, unlimited storage
AT&T Synaptic Storage Storage Service Unknown
LiveDrive Livedrive Backup Plan Backup System $6 per month, 2 TB storage space
CrashPlan CrashPlan Backup Plan Backup System $5.99 per month, unlimited storage
Carbonite Cloud Backup Services Backup System $59.99 per year, unlimited storage
FlexiScale FlexiScale Public Cloud Platform Service $17 per 1000 unit-hour
AppNexus AppNexus Cloud Platform Service Unknown
Rackspace Mosso cloud files File System $0.75 per GB-month
HighTail HighTail File System $15.99 per month, unlimited storage
Amazon SimpleDB Database $0.12 per GB-month
prediction. Concerned that PCC may overestimate the similarities of negative services, Zheng et al. [26] propose a significance weight and modify PCC to improve the accuracy of similarity compu-tation in service recommendation. However, the significance weight affects the similarity computation of positive services with more usage experiences. To address this problem, Ding et al. [31] define a convex function (usage structure factor) to reflect the usability of customer experience.
While a great number of researchers have focused on the trust-aware service selection and recommendation, little attention has been devoted to the role of customer preference and expectation in multi-attribute trustworthiness evaluation [32]. In addition, large quantities of works offer some valuable clues to discern between different services, the significances arising from value distribution is seldom considered. Thus, we will here combine evaluation-focused and prediction-evaluation-focused approaches to propose a novel trustworthiness evaluation method which will fully utilize the information of similar services and customer’s experience, and take into account both the missing attribute value prediction and the multi-attribute trustworthiness evaluation at the same time.
Methods and Materials
Based on the fact that the size and rate of growth in customers outweigh the expansion of delivered services in the cloud computing market, we employ item-based CF approach rather than the user-based or their fusion approach to produce the missing attribute values in trustworthiness evaluation. Motivated by the observation that experience usability and value distribution could provide valuable insight and distinctive information in the CF process, we create a new similarity measure for enhancing the prediction performance.
Pearson Correlation Coefficient
To make an accurate prediction, we first estimate the similarity between different cloud services. Given a service selection problem consisting of Mcustomers and N services, the customer-service matrix for missing value prediction is denoted as
q1,1 q1,N
.. .
P ...
qM,1 qM,N
2 6 6 4 3 7 7 5
ð1Þ
where the entry qm,n denotes a historical record (QoS value or customer rating) of cloud service csn made by customer um, ‘‘qm,n=null’’ states thatumdidn’t invokecsnyet.
Pearson Correlation Coefficient (PCC). [29] Taking use of numerical distance to estimate the correlation between different services, PCC has been successfully adopted for recommendation system evaluations. Let csn and csv be two services, Un,y be the subset of customers who have invoked bothcsnandcsv, then PCC is applied to calculate the similarity betweencsnandcsvby
Sim csn ,csy ~
X
m[Un,y(qm,n{qqn)(qm,y{qqy)
ffiffiffiffiffiffiffiffiffiffiffiffiffiffiffiffiffiffiffiffiffiffiffiffiffiffiffiffiffiffiffiffiffiffiffiffiffiffiffiffiffiffi X
m[Un,y(qm,n{qqn) 2
r ffiffiffiffiffiffiffiffiffiffiffiffiffiffiffiffiffiffiffiffiffiffiffiffiffiffiffiffiffiffiffiffiffiffiffiffiffiffiffiffiffiffi X
m[Un,y(qm,y{qqy) 2
r
ð2Þ
whereSim(csn,csv) is in the interval of [21, 1],qqnandqqystand for the average values of csn and csv made by different customers. However, as noted in Ref. [26], PCC always overestimate the
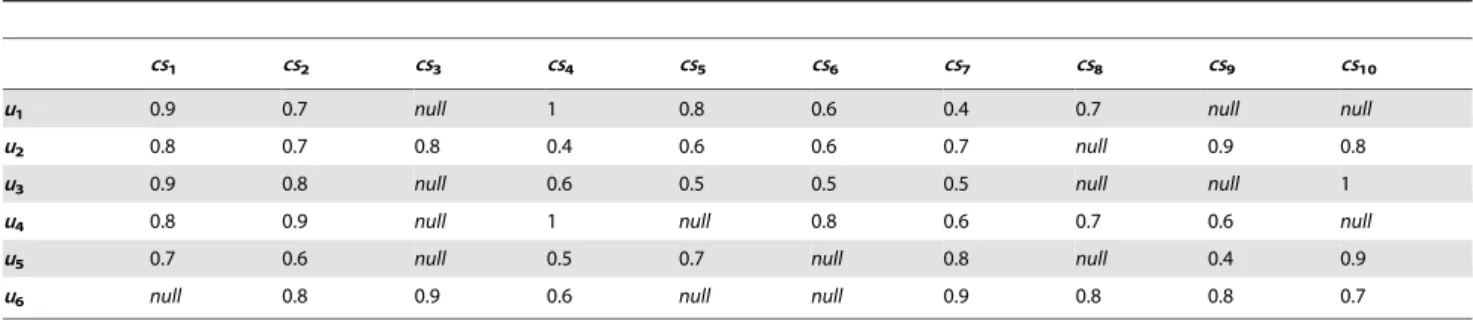
similarities of negative services, which are actually not similar but happen to have similar usage experience made by few customers. Table 2 shows a simple customer-service matrix which contains six customers (u1 to u6) and ten cloud services (cs1 to cs10). When
utilizing Eq. (2), we calculate the PCC values between the services, and get the following relation:Sim(cs1, cs3).Sim(cs1, cs4).Sim(cs1,
cs2), which indicatescs3is more similar tocs1thancs2andcs4. It is
clearly contrary to the reality due to the limited usage experience. Therefore, it is necessary to reinforce the similarity information in the CF process.
Significance estimation
It seems logical to believe that some cloud services in customer-service matrix may have high significances in making recommen-dations [33,34]. For instance, a cloud service, which has more useful historical records, may be regarded as more important compared with a negative service. PCC is only related to the numerical distance between different services, but it has nothing to do with the statistical features of historical records. For this case, we introduce two types of significances arising from the experience usability and value distribution of historical records, respectively.
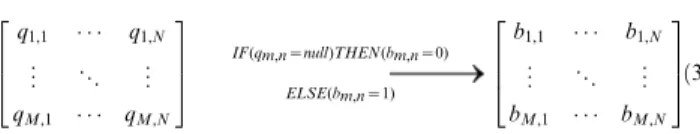
Estimating the experience usability. To determine the significance of neighbors in a CF process, one often assumes a linear relationship between usage experiences and neighbor significances [26,31]. One difference of our work from traditional CF approaches is that we apply a distance measurement method to estimate the experience usability in customer-service matrix. During the distance measurement, Jaccard’s coefficient [35] is frequently employed to estimate the discrimination of asymmetric information on binary variables. Before integrating Jaccard’s coefficient into our similarity measure, we map the original customer-service matrix into a rectangular binary matrix as follows:
q1,1 q1,N
.. .
P ...
qM,1 qM,N
2 6 6 4 3 7 7 5
IF(qm,n~null)THEN(bm,n~0)
ELSE(bm,n~1)
b1,1 b1,N
.. .
P ...
bM,1 bM,N
2 6 6 4 3 7 7 5
ð3Þ
where the entrybm,n= 1 denotes the customerumhas invoked the service csn previously, whereas bm,n= 0 denotes that um didn’t invokecsn. Let |Un| be the number of customers who has invoked
csn before, and |Un,y| be the number of customers who invoked bothcsnandcsv. We use the Jaccard’s coefficientJn,yto reflect the rise of significance due to the experience usability, which can be expressed mathematically as:
Jn,y~
DUn,yD DUnDzDUyD{DUn,yD
~ XM
m~1
bm,n^bm,y
XM
m~1
bm,n_bm,y
, ð4Þ
whereJn,yis in the interval of [0, 1], and a largerJn,yvalue indicates that the historical records made overcsvis more useful in the CF process.Jn,y=Jy,nholds for all services, which is consistent with the intuition that the similarity betweencsvandcsnis only related to the subset of historical records made by the customers who have invoked bothcsnandcsv.
Based on the customer-service matrix in Table 2, we get the significances arising from the experience usability for each service, as shown in Table 3. The values shown in grey are calculated for the negative servicecs3. As observed from Table 2,cs3 has only
are significantly lower than other services (e.g.J1,3,,J1,2). We can
infer that integrating Jn,y into similarity measure will notably reduce the influence of negative service. It is worth noting that neither PCC norJn,ycan distinguish betweencs2andcs4, since they
do not have sufficient power to detect the crucial difference in value distributions.
Estimating the value distribution. The neighbors which have the same PCC similarity may have different value distributions. It is necessary to detect more hidden information in the customer-service matrix for significance estimation. For this case, we propose a method to discriminate neighbors’ significances arising from their unique value distributions. In practice, the customer-service matrix is very sparse due to limited usage experiences. Therefore, we will ignore the historical records made by the customeru, whereu6[Un,y. LetDn= {qm,n|um[Un,y} and Dy= {qm,y | um [ Un,y} be the historical records in similarity computation made overcsnandcsv, and |Dy| be the cardinality of
Dn, and dom(Dn) be the domain of Dn subject to the following
constraints:
dom(Dn)?½q{
n,q
z
n* q{
n~MIN qm,nDum[Un,y
,
qz
n~MAX qm,nDum[Un,y
:
(
ð5Þ
Following dom(Dn), the dataset Dy can be grouped into three
categories:
D[n
y ~ qm,yDum[Un,y,qm,y[({?,q{n)
,
D~n
y ~ qm,yDum[Un,y,qm,y[½q{n,q
z
n
,
D]n
y ~ qm,yDum[Un,y,qm,y[(qzn,z?)
:
8
> > <
> > :
ð6Þ
SinceDyis a finite discrete dataset, the probability of each category can be computed as:
p1
y~ DD[n
y D DDyD ,p
2
y~ DD~n
y D DDyD ,p
3
y~ DD]n
y D DDyD
, ð7Þ
whereX3k
~1 p
k y
~1, andDD[n y DzDD
~n y DzDD
]n
y D~DDyD. From the information entropy aspect, we use the following expression to detect the difference between the value distributions ofcsnandcsy:
VDn,y~1{ Hn,y Hmax
, ð8Þ
where Hn,y~
X
pky=0 {p
k ylog2(pky)
denotes the information
entropy ofDy, andHmaxdenotes the maximal entropy in customer-service matrix, respectively.VDn,yis a linear function defined in [0, 1]. From the maximum entropy principle [36], we have Hmax= log2(3). Thus, Eq.(8) can be rewritten as
VDn,y~1{
X
pky=0 {p
k ylog2(pky)
log2(3) , ð9Þ
where VDn,y attains its unique global minimum VDMINn,y ~0 if p1
y~p2y~p3y~1=3; otherwise it attains global maximum VDMAX
n,y ~1whenApky~1.
We can thus calculate the significancesVDn,y arising from the value distribution using Eq.(9) over the customer-service matrix in
Table 2.A simple customer-service matrix.
cs1 cs2 cs3 cs4 cs5 cs6 cs7 cs8 cs9 cs10
u1 0.9 0.7 null 1 0.8 0.6 0.4 0.7 null null
u2 0.8 0.7 0.8 0.4 0.6 0.6 0.7 null 0.9 0.8
u3 0.9 0.8 null 0.6 0.5 0.5 0.5 null null 1
u4 0.8 0.9 null 1 null 0.8 0.6 0.7 0.6 null
u5 0.7 0.6 null 0.5 0.7 null 0.8 null 0.4 0.9
u6 null 0.8 0.9 0.6 null null 0.9 0.8 0.8 0.7
doi:10.1371/journal.pone.0097762.t002
Table 3.Significances arising from the experience usability.
cs1 cs2 cs3 cs4 cs5 cs6 cs7 cs8 cs9
cs2 0.833
cs3 0.167 0.333
cs4 0.833 1 0.333
cs5 0.8 0.667 0.2 0.667
cs6 0.8 0.667 0.2 0.667 0.6
cs7 0.833 1 0.333 1 0.667 0.667
cs8 0.333 0.5 0.25 0.5 0.167 0.4 0.5
cs9 0.5 0.667 0.5 0.667 0.333 0.333 0.667 0.4
cs10 0.5 0.667 0.5 0.667 0.6 0.333 0.667 0.167 0.6
Table 2. Table 4 shows the values of these significances. The values shown in grey are calculated for the cloud servicescs2and
cs4.
Similarity measurement adopting significance. After we have defined the two types of significance for each service, we can then create the similarity measure,Sims(csn,csv), which takes into account the significance previously defined. To estimate the significance as accurately as possible, we identify the significance of csvwith respect tocsnas a linear combination ofJn,yandVDn,y, such that:
SIGn,y~a|Jn,yz(1{a)|VDn,y, ð10Þ whereais defined to determine how much our significance relies
on experience usability and value distribution. If a= 0, we only
extract the experience usability for conducting significance estimation, and if a= 1, we consider only the value distribution.
Hence, the similarity measure can be written in standard form:
Sims(csn,csy)~SIGn,y|Sim(csn,csy) ð11Þ
whereSIGn,ydenotes the significance ofcsvwith respect tocsn, and
Sim(csn, csv) denotes the PCC value betweencsnand csv. Different from existing similarity measures, our approach employs not only numerical distance but also usage experience as well as value
distribution to determine the similarity between different services. With the definition of similarity measure defined in Eq.(11), for every cloud service in customer-service matrix, we rank their neighbors and select the top-k most similar services to make missing value prediction. Following the top-k similar service defined in [26], we get
CSnk~fcsyDcsy[CSn,SimS(csn,csy)w0,y=ng, ð12Þ
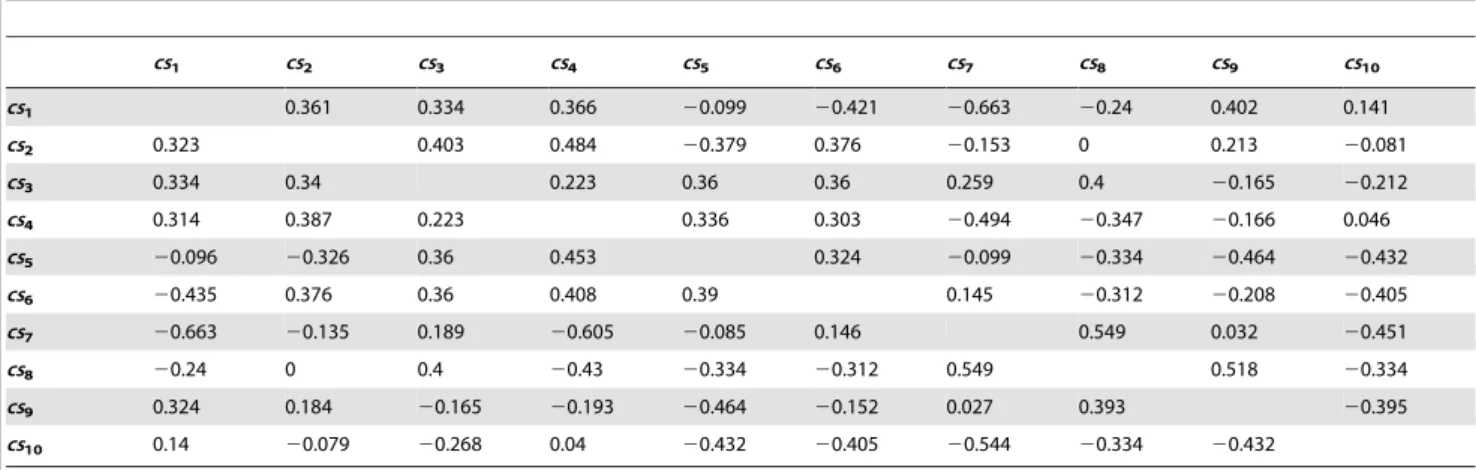
where CSn denotes the neighbor set of csn in customer-service matrix, andSimS(csn,csv) denotes the similarity betweencsnandcsv. For the customer-service matrix in Table 2, we set a to 0.8 to obtain the similarity measures between different services (see Table 5). The top 3 neighbors of each service are marked in grey areas as seen in each column.
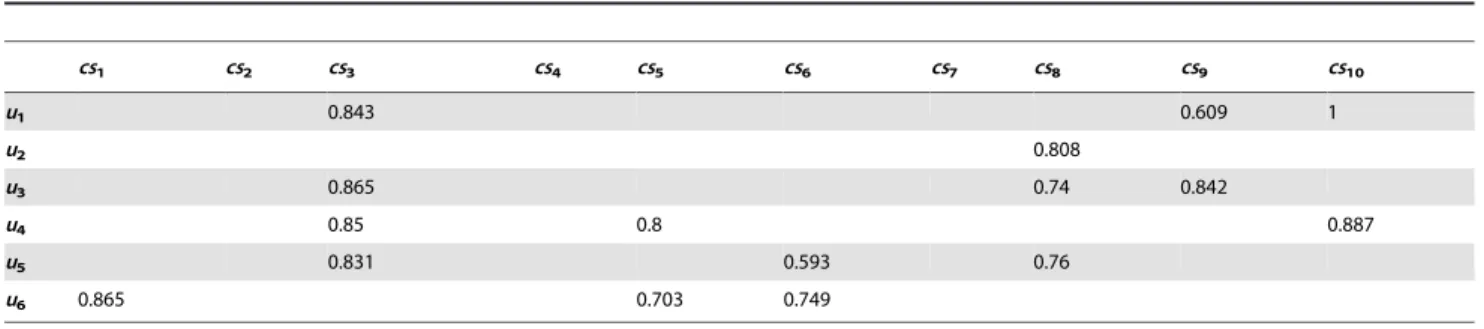
Missing value prediction. With the exponential growth of cloud service on the Internet, service recommendation techniques like QoS-aware CF approaches have become increasingly important and popular [37]. Based on our similarity measure, we propose an enhanced item-based CF approach (named as JV-PCC) to reinforce the prediction performance. To predict the missing value^qqm,nof servicecsnfor customerum, we first determine the objective weight of each similar neighbor:
Table 4.Significances arising from the value distribution.
cs1 cs2 cs3 cs4 cs5 cs6 cs7 cs8 cs9 cs10
cs1 1 1 1 0.488 0.369 0.387 1 1 0.421
cs2 0.545 0.685 1 1 0.488 1 0.421 1 0.488
cs3 1 0.369 1 1 1 1 1 1 0.369
cs4 0.387 0 1 0.054 0.054 0.079 0.421 0.488 1
cs5 0.369 0.488 1 1 0.421 1 1 1 1
cs6 0.488 0.488 1 1 1 0.488 1 1 1
cs7 0.387 0.421 0.369 1 0.488 0.488 1 1 0.369
cs8 1 1 1 1 1 1 1 1 1
cs9 0.421 0.488 1 1 1 0.369 0.421 0.369 0.421
cs10 0.421 0.421 1 1 1 1 1 1 0.685
doi:10.1371/journal.pone.0097762.t004
Table 5.Similarities between different services.
cs1 cs2 cs3 cs4 cs5 cs6 cs7 cs8 cs9 cs10
cs1 0.361 0.334 0.366 20.099 20.421 20.663 20.24 0.402 0.141
cs2 0.323 0.403 0.484 20.379 0.376 20.153 0 0.213 20.081
cs3 0.334 0.34 0.223 0.36 0.36 0.259 0.4 20.165 20.212
cs4 0.314 0.387 0.223 0.336 0.303 20.494 20.347 20.166 0.046
cs5 20.096 20.326 0.36 0.453 0.324 20.099 20.334 20.464 20.432
cs6 20.435 0.376 0.36 0.408 0.39 0.145 20.312 20.208 20.405
cs7 20.663 20.135 0.189 20.605 20.085 0.146 0.549 0.032 20.451
cs8 20.24 0 0.4 20.43 20.334 20.312 0.549 0.518 20.334
cs9 0.324 0.184 20.165 20.193 20.464 20.152 0.027 0.393 20.395
cs10 0.14 20.079 20.268 0.04 20.432 20.405 20.544 20.334 20.432
vn,y~ Sim
S(csn,csy)
X
qm,y=nullSim
S(csn,csy), ð13Þ
wherecsv[CSkndenotes a similar neighbor ofcsn, whileSimS(csn,csv) denotes the similarity betweencsn andcsv. The objective weights define the relative importance of each similar neighbor in the CF process. Next, we attain a prediction by a classic aggregation function:
^
q qm,n~
X
qm,y=null
qm,y|vn,y
, ð14Þ
whereqm,ydenotes the historical record ofcsymade by customerum. In practice, local runtime environment (e.g. network bandwidth) and customer’s rating style may significantly influence the historical records over delivered services. However, the above function deems inappropriate as it is calculated through only one customer. To address this problem, JV-PCC predicts the missing attribute value by the following equation:
^
q qm,n~q
z
nz q
z
n{q
{
n
X
csy[CSkn,
qm,y=null
vn,y| qm,y {q{
y qz
y{q
{
y
!
, ð15Þ
wherevn,ydenotes the objective weight ofcsywith respect tocsn,
whileq{
y andq
z
y denote the minimum and maximum values of servicecsy, respectively. Table 6 displays the values estimated for the missing records in Table 2. In the experimental examples, both customer-based and service-based neighborhood information were adopted for approximating the missing value.
Trustworthiness-aware service selection
Several models, focusing on the quantitative measurement of service trustworthiness, have been proposed in Refs. [9,18,38]. However, different customers have different preference and expectation in service selection. A thorough understanding into these factors is essential to ensure effective evaluation finding. Here, we introduce a cloud service evaluation model, which helps aggregate trustworthy attributes by considering customer’s prefer-ence and expectation.
Attribute utility determination. To make use of observed or estimated values, we need to know that different attributes may have inconsistent dimensions. The results in [32] show that utility can be used to identify an entity’s trustworthiness. Therefore, we first derive the utility from the customer-service matrix so as to ensure their values are in the range of [0, 1]. Trustworthy
attributes are often divided into quantitative and qualitative attributes, of which the former are objective measures (e.g. QoS value), and the latter are subjective customer ratings. In addition, quantitative trustworthy attributes can be grouped into two classes: ‘‘benefit’’ and ‘‘cost’’. For ‘‘benefit’’ (‘‘cost’’) attribute, e.g. throughput(response-time), the higher (lower) its value is, the greater the possibility that a customer would choose it becomes. In our model, qualitative attributes are also considered as ‘‘benefit’’ attributes. Letqm,nbe the attribute value ofcsn, and the attribute utility (risk-neutral)Hm,nhas the following form:
Hm,n~
qm,n{q{m qz
m{q{m
, qm,n[00benefit00, qz
m{qm,n qz
m{q{m
, qm,n[00cost00,
8 > > < > > :
ð16Þ
whereq{
m andq
z
m denote the minimum and maximum attribute values for customer um, and they are subject to the following constraints:
q{
m~MIN qmð ,nDn~1,:::,NÞ, qz
m~MAX qmð ,nDn~1,:::,NÞ:
ð17Þ
The attribute utilityHm,nis in the range of [0, 1], where a larger
Hm,nindicates that customerum is more satisfied with the service
csn.
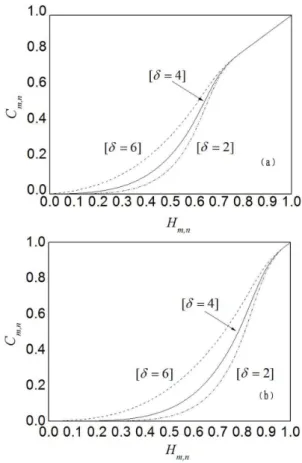
Customer satisfaction estimation. From influential theory in marketing science, we consider that the perception of cloud service trustworthiness is a customer satisfaction function, which includes customer preference and expectation attributes. In general, customer satisfaction function should exhibit two charac-teristics: (1) given the same expectation, a trustworthy cloud service is weighed much more heavily than an untrustworthy service. This effect is reflected in the derivation of attribute utility; (2) customer satisfaction slightly increases when attribute utility surpasses a certain value (expectation), and significantly decreases when attribute utility falls below expectation [39]. We formalize this interaction as a piecewise linear function:
Cm,n~
Hm,n, Hm,n§Hexp,
Hm,n(Hm,n{Hexpz1)d, Hm,nƒHexp,
ð18Þ
whereCm,nis constrained to 0#Cm,n#1; the parameterdregulates the impact of customer preference on perceived trustworthiness; andHexpdenotes the customer expectation with regard to selecting trustworthy cloud service. As shown in Fig. 1,Cm,nis continuous (i.e. the piecewise function converges atHm,n= Hexp).
Table 6.Predicted attribute values.
cs1 cs2 cs3 cs4 cs5 cs6 cs7 cs8 cs9 cs10
u1 0.843 0.609 1
u2 0.808
u3 0.865 0.74 0.842
u4 0.85 0.8 0.887
u5 0.831 0.593 0.76
u6 0.865 0.703 0.749
The severity and rate of satisfaction (controlled byHexpandd, respectively) reflect different customer’s tolerance to untrustworthy candidates. LetHexp= 0.7, andd=2. Table 7 shows the customer satisfaction for each attribute value (historical record or predicted value), which corresponds to the original customer-service matrix in Table 2 and the predicted missing values given in Table 6.
Trustworthy attribute aggregation. After estimating cus-tomer satisfaction and ensuring the value ofCm,nin the interval of [0, 1], the degree of trustworthiness (alias ‘‘trust value’’ [40]) of each cloud service in customer-service matrix can be achieved by aggregating trustworthy attributes. LetC1
m,n::CmJ,nbe the customer
satisfaction on a set of specified attributes A1..AJ, then the trust
value ofcsnis computed as:
trustn~
XJ
j~1vj|C
j m,n
J , ð19Þ
where vj denotes the weight of trustworthy attribute Aj,
XJ
j~1vj~1.
The trust value gives the comprehensive perception of cloud service trustworthiness, while the weights modify this trust value based on the relative importance of trustworthy attributes. Actually, a set of specified trustworthy attributes can be easily weighted by applying existing technologies such as those discussed in [32]. We omit the details for brevity.
Decision support for personalized service selection. Multi-attribute trustworthiness evaluation is an im-portant step for making accurate service selection. We suppose that um is the active customer, who requires trustworthy cloud service. While the evaluation results have arrived, a set of appropriate service candidates can be identified forumby:
CSm~fcsnDtrustnwem,n~1,:::,Ng, ð20Þ
wheretrustndenotes the trust value ofcsn,em denotes the selection threshold determined byum. We aim to remedy the shortcomings of evaluation-focused selection methods by avoiding the costly and time-consuming real-world service invocations. Note that when CSm~1the service selection for the active customeru
mneeds to be degrade by decreasing the parameterem.
Lete1~:::~e6~0:85, a set of trustworthy cloud services can be recommended foru1…u6as
CS1~fcs
1,cs4,cs5g, CS2~fcs8,cs9g, CS3~fcs1,cs9,cs10g,
CS4~fcs
2,cs4,cs5,cs6g,CS5~fcs7g, CS6~fcs7,cs8g,
ð21Þ
where the customer satisfaction for each attribute value is presented in Table 7. In practice, our approach makes it possible to deal with various types of trustworthiness-aware cloud service selections by combing the evaluation-focused and the prediction-focused methods. Note that if trustworthiness is not the only issue that affects customer’s decision making, it is necessary to extend the selection process of our approach, e.g., price-oriented service filtering, into other attributes or indexes.
Results
In this section, abundance of experiments are conducted to show how to recommend trustworthy cloud service in the context Figure 1. Customer satisfaction functionCm,n.(a) and (b) depict
the distributions of customer satisfaction as recorded at the fixed expectationHexp= 0.7 andHexp= 0.9, where the parameterdis varied from 2 to 6 in increment of 2. It can be observed that the rate of change in customer satisfaction differs significantly whenHm,nfalls below and
exceeds the expectation.
doi:10.1371/journal.pone.0097762.g001
Table 7.Customer satisfaction.
cs1 cs2 cs3 cs4 cs5 cs6 cs7 cs8 cs9 cs10
u1 1 0.134 0.229 1 1 0.134 0 0 0.215 1
u2 0.32 0.134 0 0 0.134 0.134 0.486 1 1 0.134
u3 1 0.623 0.587 0.134 0 0 0.05 0.166 0.884 1
u4 0.32 1 0.32 1 1 1 0.196 0 0.196 0.531
u5 0 0 0.115 0.036 0.623 0.115 0.8 0.407 0 0.623
u6 0.825 0.623 1 0.134 0.645 0.83 1 0.926 0.8 0
of large sparse assessment dataset, and to verify the efficiency of our CF approach.
Prototype implementation and results
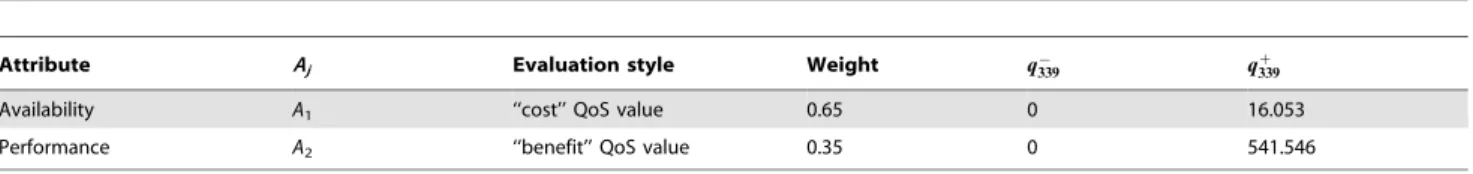
To demonstrate the effectiveness of the proposed service selection approach, we use Microsoft C# .NET to develop a prototype system. Based on literature [8,41,42], we findAvailability andPerformanceare two commonly used trustworthy attributes. We utilize them to conduct trustworthiness-aware service selection, by including two types of historical records:response-timeandthroughput. Their evaluation styles and weights are summarized as Table 8.
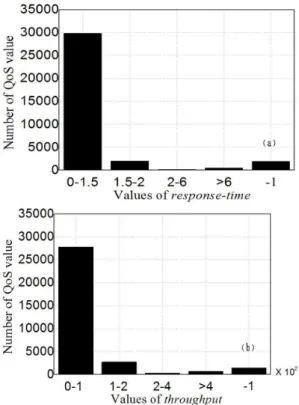
We employ an open QoS research dataset [43] to simulate the historical records of Performance and Availability in cloud service market. The QoS values for response-time and throughput were collected from 339 users over 5825 web services in a real-world environment. Since it is impractical to discover and distinguish all functionally-equivalent services at the selection time, we randomly select 100 services’ QoS records, and construct two 3396100 customer-service matrices for our experiment. Figure 2 shows the value distribution ofresponse-timeandthroughputinuser-servicematrix. We cannot simply utilize these QoS records to analyze and rank the cloud services since these customer-service matrices are sparse assessment datasets, and cannot accurately interpret the trustwor-thiness status of all services. Supposeu339 is the active customer.
The historical records made by u339 contains 9 and 7 missing
values (on response-time and throughput, respectively) which will potentially affect his cloud service selection decision. Therefore, the proposed CF approach is employed to predict the missing attribute values. At this simulation experiment, the similarity parameterais set to 0.8 and remains so until the trust values for u339are reported. Once the prototype system obtains the customer
satisfactions by utilizing Eqs.(12)–(14), where the parameterd=2 and the expectationHexp= 0.7, the active customer will receive the trust values of each service. We vary the selection parametere339
from 0 to 1 in increment of 0.1, and count the cloud services whose trust values surpasse339(the number of recommended services for u339, i.e. |CS339|). The experiment results are shown in Figure 3.
Although we only study two trustworthy attributes in the Figure 2. QoS value distributions. (a) and (b) depict the value
distributions ofresponse-time andthroughputin our customer-service matrices, where ‘‘21’’ indicates that the service invocation failed due to an http error. The ranges ofresponse-timeandthroughputare 0–16.053 seconds and 0–541.546 kbps, respectively.
doi:10.1371/journal.pone.0097762.g002
Figure 3. The number of recommended services foru339.Results
are presented for the proposed cloud service selection approach, where the parametere339is varied from 0 to 1 in increment of 0.1.
doi:10.1371/journal.pone.0097762.g003
Figure 4. Impact of preference and expectation.(a) and (b) depict the experimental results of preference parameterd and expectation Hexp, respectively. They indicates thatdregulates the elimination rate of untrustworthy cloud services, whereas Hexp controls the degree of
experiment, the proposed approach can be easily extended to other trustworthiness-aware service selection problems. When selecting the optimal trustworthy services from a set of function-ally-equivalent candidates, the entry data of our approach are the corresponding historical records (i.e., QoS values or customer ratings), the active customer’s preference and expectation towards service trustworthiness, and the selection parameter.
Impact ofd andTexp
Different customers have different preference and expectation in trustworthy service selections. Instead of risk-neutral attribute utility, we use the customer satisfaction Cm,n to identify the perceived trustworthiness of delivered services. To evaluate the impact of customer’s preference and expectation, we have conduct additional experiments with variable parameters dand Hexp. In these experiments, we first varydfrom 2 to 6 in increment of 2, where the expectationHexpis fixed at 0.7 first. Later, we setdto 2,
and varyHexp from 0.7 to 0.9 in increment of 0.1. Figure 4 (a) shows the experimental results of preference parameter d and
Figure 4 (b) shows the experimental results of expectationHexp. The parametersdandHexp
jointly determine how to derive the customer satisfaction from attribute utility to approximate the active customer’s attitude towards profit and risk.
Performance comparison of CF approaches
In this work, we present an enhanced item-based CF approach (i.e., JV-PCC) to predict the missing attribute values for cloud service selection. Our approach engages the significances (Jn,yand
VDn,y) to improve the accuracy of similarity estimation. To study the prediction performance, we compare JV-PCC with two existing item-based approaches: Item-based CF adopting PCC (IPCC) [44], and Extended PCC approach (f-PCC) [31].
Evaluation metric. We use Mean Absolute Error (MAE) and Root Mean Square Error (RMSE) to evaluate the prediction
Table 8.Trustworthy attributes of cloud service.
Attribute Aj Evaluation style Weight q{339 qz339
Availability A1 ‘‘cost’’ QoS value 0.65 0 16.053
Performance A2 ‘‘benefit’’ QoS value 0.35 0 541.546
doi:10.1371/journal.pone.0097762.t008
Figure 5. Impact of neighborhood sizek.(a) and (b) depict the MAE fractions of JV-PCC, f-PCC and IPCC forresponse-timeandthroughput, while (c) and (d) depict the RMSE fractions. It can be observed that JV-PCC achieves smaller MAE and RMSE consistently than f-PCC for bothresponse-time
andthroughput. Regardless of JV-PCC or f-PCC, askincreases, MAE and RMSE drop at first, indicating that better performance can be achieved by employing more similar services’ records to generate the predictions. However, whenksurpasses a specific level (i.e.k =25), they fail to drop with a further increase ink, which were caused by the limited number of similar neighbors.
performance of our approach in comparison with other approach-es. MAE and RMSE are defined as:
MAE~
X
m,nD^qqm,n{qm,nD Q
RMSE~
ffiffiffiffiffiffiffiffiffiffiffiffiffiffiffiffiffiffiffiffiffiffiffiffiffiffiffiffiffiffiffiffiffiffiffiffiffiffiffi X
m,n(^qqm,n{qm,n)
2 Q s 8 > > > > < > > > > : ,
ð22Þ
where^qqm,n andqm,n are the predicted QoS value and the actual value, respectively.
Experimental setup and results. The size of top-ksimilar service set plays an important role in CF approach, which determines how many neighbors’ historical records are employed to generate predictions. To study the impact of neighborhood size k, we separate the customer-service matrices into two parts: training set (80% historical records in the matrix) and test set (the remaining 20% records). We set the density to 50%, the significance parameter a to 0.7, and vary k from 5 to 30 in increment of 5. Figure 5 shows the experimental results for response-timeandthroughput. Under the same simulation condition, JV-PCC and f-PCC significantly outperform IPCC. The observations also suggest that better accuracy can be achieved by our model when more historical records are available in the service selection study.
Conclusions
Trustworthiness-aware service selection is a critical issue among cloud computing and service-oriented architecture communities.
In this paper, we propose a personalized service selection approach which takes into account the missing value prediction and the multi-attribute evaluation requirements. We find that the proposed approach can tackle various types of trustworthiness-aware selection problems in cloud service market. Meanwhile, the experimental results demonstrate that the proposed CF approach significantly improves the prediction performance as compared with other competing item-based approaches.
Employing untrustworthy cloud service will expose users to high-risk IT structure, resulting in a host of intra-organizational hazards that detriment the organization and disrupt the normal operations [45]. In the present work, we can only look into the static approach for trustworthy service selection, and we will investigate more types of trustworthiness evaluation models (e.g. probability model, dynamic model, etc) in the future since different cloud service applications may have different selection criteria and data structures.
Acknowledgments
We would like to thank Prof. Youtao Zhang, from University of Pittsburgh, for giving detailed and valuable comments on the paper.
Author Contributions
Conceived and designed the experiments: SD CYX KLZ SLY JSS. Performed the experiments: SD. Analyzed the data: SD JSS CYX. Contributed reagents/materials/analysis tools: SD CYX. Contributed to the writing of the manuscript: SD CYX.
References
1. Katzan H (2011) Cloud software service: concepts, technology, economics. Service Science 1(4): 256–269.
2. Stolyar AL (2013) An infinite server system with general packing constraints. Operations Research 61(5): 1200–1217.
3. Chen PY, Wu SY (2013) The impact and implications of on-demand services on market structure. Information Systems Research 24(3): 750–767.
4. Sunyaev A, Schneider S (2013) Cloud services certification. Communications of the ACM 56(2): 33–36.
5. Sanjukta D, Anna YD (2011) Risk management and optimal pricing in online storage grids. Information Systems Research 22(4): 756–773.
6. Marston S, Li Z, Bandyopadhyay S, Zhang JH, Ghalsasi A (2011) Cloud computing – The business perspective. Decision Support Systems 51: 176–189. 7. Cusumano M (2010) Cloud computing and SaaS as new computing platforms.
Communications of the ACM, 53(4): 27–29.
8. Alhamad M, Dillon T, Chang E (2011) A trust-evaluation metric for cloud applications. International Journal of Machine Learning and Computing 1(4): 416–421.
9. Yao JH, Chen SP, Wang C, Levy D, Zic J (2011) Modelling collaborative services for business and QoS compliance. IEEE International Conference on Web Services (ICWS), pp.299–306.
10. Tao F, Zhao DM, Hu YF, Zhou ZD (2010) Correlation-aware resource service composition and optimal-selection in manufacturing grid. European Journal of Operational Research 201(1): 129–143.
11. Grag SK, Versteeg S, Buyya R (2013) A framework for ranking of cloud computing services. Future Generation Computer Systems 29(4): 1012–1023. 12. Limam N, Boutab R (2010) Assessing software service quality and
trustworthi-ness at selection time. IEEE Transactions on Software Engineering 36(4): 559– 574.
13. Hang CW, Singh MP (2011) Trustworthy service selection and composition. ACM Transactions on Autonomous and Adaptive Systems 6(1): 1–17. 14. Chakraborty S, Roy K (2012) An SLA-based framework for estimating
trustworthiness of a cloud. IEEE 11th International Conference on Trust, Security and Privacy in Computing and Communications, pp. 937–942. 15. Mehdi M, Bouguila N, Bentahar J (2012) Trustworthy web service selection
using probabilistic models. IEEE 19th International Conference on Web Services (ICWS), Honolulu, HI, pp.17–24.
16. Hackney R, Xu HN, Ranchhod A (2006) Evaluating web services: Towards a framework for emergent contexts. European Journal of Operational Research 173(3): 1161–1174.
17. Ding S, Yang SL, Zhang YT, Liang CY, Xia CY (2014) Combining QoS prediction and customer satisfaction estimation to solve cloud service trustworthiness evaluation problems. Knowledge-Based Systems, 56(1): 216– 225.
18. Lecue F (2010) Combing collaborative filtering and semantic content-based approaches to recommend web services. IEEE Fourth International Conference on Semantic Computing, pp. 200–205.
19. Tserpes K, Aisopos F, Kyriazis D, Varvarigou T (2012) A recommender mechanism for service selection in service-oriented environments. Future Generation Computer Systems, 28(8): 1285–1294.
20. Zheng ZB, Ma H, Lyu MR, King I (2011) QoS-aware web service recommendation by collaborative filtering. IEEE Transactions on Services Computing, 4(2): 140–152.
21. Chen X, Liu XD, Huang ZC, Sun HL (2010) Region KNN: A scalable hybrid collaborative filtering algorithm for personalized web service recommendation. IEEE International Conference on Web Service (ICWS), pp.9–16.
22. Zheng ZB, Wu XM, Zhang YL, Lyu MR, Wang JM (2013) QoS ranking prediction for cloud services. IEEE Transactions on Parallel and Distributed Systems, 24(6): 1213–1222.
23. Pal R, Hui P (2013) Economic models for cloud service markets: Pricing and capacity planning. Theoretical Computer Science, 496(22): 113–124. 24. Sundarewaran S, Squicciarini A, Lin D (2012) A brokerage-based approach for
cloud service selection. IEEE Fifth International Conference on Cloud Computing, pp.558–565.
25. Resnick P, Iacovou N, Suchak M, Bergstrom P, Riedl J (1994) Grouplens: An open architecture for collaborative filtering of networks. Proceeding of ACM Conference on Computer Supported Cooperative Work, pp.175–186. 26. Breese JS, Heckerman D, Kadie C (1998) Empirical analysis of predictive
algorithms for collaborative filtering. Proceedings of 14th
Annual Conference on Uncertainty in Artificial Intelligence, 43–52.
27. Ding S, Ma XJ, Yang SL (2012) A software trustworthiness evaluation model using objective weight based evidential reasoning approach. Knowledge and Information Systems 33(1): 171–189.
28. Jin R, Chai J, Si L (2005) An automatic weighting scheme for collaborative filtering. SIGIR, 337–344.
29. Bobadilla J, Hernando A, Ortega F, Gutierrez A (2012) Collaborative filtering based on significances. Information Sciences 185: 1–17.
31. Cheng HD, Chen JR (1997) Automatically determine the membership function based on the maximum entropy principle. Information Sciences 96(4): 163–182. 32. Shao LS, Zhang J, Wei Y, Zhao JF, Xie B, et al. (2007) Personalized QoS Prediction for Web Services via Collaborative Filtering. IEEE International Conference on Web Services (ICWS), pp.439–446.
33. Dozelli P, Basili V (2006) A practical framework for eliciting and modeling system dependability requirements: Experience from the NASA high depend-ability computing project. Journal of Systems and Software 79(1): 107–119. 34. Hwang SY, Lee CH (2013) Reliable web service selection in choreographed
environments, Decision Support Systems54(3): 1463–1476.
35. Anderson EW, Sullivan MW (1993) The antecedents and consequences of customer satisfaction of firms. Marketing Science 12(2).
36. Karaoglanoglou K, Karatza H (2011) Resource discovery in a Grid system: Directing requests to trustworthy virtual organizations based on global trust values. Journal of Systems and Software 84(3): 465–478.
37. Cruz JM, Liu ZG (2012) Modeling and analysis of the effects of QoS and reliability on pricing, profitability, and risk management in multiperiod grid-computing networks. Decision Support Systems 52(3): 562–576.
38. Rosario S, Benveniste A, Haar S, Jard C (2008) Probabilistic QoS and soft contracts for transaction-based web services orchestrations. IEEE Transactions on Services Computing 1(4): 187–200.
39. Zheng ZB, Zhang YL, Lyu MR (2010) Distributed QoS evaluation for real-world web services. Proceedings of the 8th International Conference on Web Services (ICWS), Miami, Florida, USA, pp. 83–90.
40. Deshpande M, Karypis G (2004) Item-based top-N recommendation. ACM Transactions on Information System 22(1): 143–177.
41. Benlian A, Hess T (2011) Opportunities and risks of software-as-a-service: Findings from a survey of IT executives. Decision Support Systems 52: 232–246. 42. Demirkan H, Cheng HK, Bandyopadhyay S (2010) Coordination strategies in a SaaS supply chain. Journal of Management Information Systems 26(4): 119– 143.
43. Tsesmetzis D, Roussaki I, Sykas E (2008) QoS-aware service evaluation and selection. European Journal of Operational Research 191: 1101–1112. 44. Wang Q, Wang C, Ren K, Lou KJ, Li J (2011) Enabling public auditability and
data dynamics for storage security in cloud computing. IEEE Transactions on Parallel and Distributed Services 22(5): 847–859.