www.biogeosciences.net/10/7759/2013/ doi:10.5194/bg-10-7759-2013
© Author(s) 2013. CC Attribution 3.0 License.
Biogeosciences
Soil physical restrictions and hydrology regulate stand age and wood
biomass turnover rates of Purus–Madeira interfluvial wetlands in
Amazonia
B. B. L. Cintra1,2, J. Schietti1, T. Emillio1, D. Martins1, G. Moulatlet1, P. Souza1, C. Levis1, C. A. Quesada1, and J. Schöngart1,2
1Instituto Nacional de Pesquisas da Amazônia (INPA), Manaus, Amazonas, Brazil 2Max Planck Institute for Chemistry, Biogeochemistry Department, Mainz, Germany
Correspondence to:B. B. L. Cintra ([email protected])
Received: 6 January 2013 – Published in Biogeosciences Discuss.: 5 April 2013
Revised: 21 October 2013 – Accepted: 23 October 2013 – Published: 29 November 2013
Abstract.In Amazonia, wetlands constitute about 30 % of its entire basin, of which ancient fluvial terraces located in vast interfluvial regions cover a large portion. Although the increased number of permanent plots in the recent years has contributed to improved understanding of regional variation in forest dynamics across the Amazon Basin, the function-ing of large lowland interfluvial wetlands remain poorly un-derstood. Here we present the first field-based estimate for tree ages, wood biomass productivity and biomass turnover rates for eight 1 ha plots in wetland and non-flooded forests distributed along the BR-319 Highway along a distance of about 600 km crossing the Purus–Madeira rivers interfluvial region in central-southwestern Amazon Basin. We estimate stand age, wood biomass productivity and biomass turnover rates combining tree-ring data and an allometric equation based on diameter, tree height and wood density and re-late these structural parameters to physical soil and hydro-logical restrictions. Wood biomass and productivity varied twofold among the plots, with wood biomass stocks rang-ing between 138–294 Mg ha−1and productivity varying
be-tween 3.4–6.6 Mg ha−1yr−1. Soil effective depth,
topogra-phy, structure and mainly soil water saturation significantly affected stand age (64–103 yr) and forest dynamics in terms of annual biomass turnover rates (2.0–3.2 %). On harsher soils characterized by a poor structure, low effective depth and high water saturation, biomass turnover rates were in-creased and forests stands were younger compared to well-drained sites. We suggest that soil constraints, especially soil water saturation, limit the development of the stand
struc-ture, resulting in forests with younger stand ages and higher biomass turnover rates compared to forests growing on well-drained soils. We do not find, however, any relation between physical soil restrictions or hydrology and wood biomass productivity, but there is a trend of increasing wood biomass productivity and phosphorus concentrations at the soil sur-face. Based on our results we establish hypotheses for differ-ent dynamical processes between forests growing on water-logged and well-drained soils and discuss how these results can be applied in the background of conservation as well as the potential development of forest management plans in this region, which will experience increased deforestation due to the construction of the BR-319 Highway crossing the inter-fluvial region of the Purus–Madeira rivers.
1 Introduction
About two million square kilometers of the Amazon Basin falls under wetland classification criteria (Junk et al., 2011). Although the increased number of permanent plots in recent years has contributed to improved understanding of regional variation in forest dynamics across the Amazon Basin (Baker et al., 2004; Malhi et al., 2004; Girardin et al., 2010), most of the studies on forest dynamics focus on non-flooded terra firme forests. Only a few studies focus on forest
such as large interfluvial wetlands which are found along vast regions in the central and western Amazonia (Sombroek, 2001), are poorly studied and understood.
Little is known about how environmental factors such as soil conditions, climate and hydrology control forest dynam-ics in interfluvial wetlands. In these ecosystems soil drainage and the depth of the water table vary considerably, creating a patchwork of seasonally flooded or waterlogged and non-flooded forests. This process often leads to the formation of a firm plinthite layer that can change to hardpan if exposed to repeated wetting and drying cycles (Quesada et al., 2011). Therefore, the presence of soil physical constraints, such as the depth to which tree roots penetrate and the presence of restriction layers (e.g., hardpans) may be very important for stand development. In this study we focus on how the hetero-geneous and complex hydrology and soil properties influence stand development and forest dynamics.
Forest dynamics expressed in terms of productivity, tree mortality and turnover rates is known to be affected by edaphic and/or climatic disturbances. Soil physical proper-ties are determinant for tree turnover rates (Quesada et al., 2012), while soil fertility, especially phosphorous (P) status, is related with wood productivity (Malhi et al., 2004; Que-sada et al., 2012). However, the responses of forest dynam-ics to climate vary between forest types (Schöngart et al., 2010). In non-flooded terra firme forests diameter growth
is strongly related to seasonal precipitation (Brienen and Zuidema, 2005) and severe droughts negatively affect for-est dynamics, decreasing wood biomass productivity and in-creasing tree mortality (Foley et al., 2002; Phillips et al., 2009; Corlett et al., 2011; Lewis et al., 2011). In contrast, the seasonal inundation of floodplain forests of the central Ama-zonia leads to a reduction of diameter growth (Schöngart et al., 2002), and an enhanced tree growth during the non-flooded period can be attributed to El Niño-induced droughts, since the terrestrial phase is extended during El Niño years compared to other years (Schöngart et al., 2004; Schöngart and Junk, 2007).
In this study we use tree-ring analysis showing how stand development may be affected by varying conditions of hydrology and soil physical constraints along the Purus– Madeira rivers interfluvial region in the central-southwestern Amazonia. In this region smooth topographic variations re-sult in contrasting soil physical and hydrological condi-tions at local scale. We expect that forests on well-drained soils present a higher wood biomass productivity and wood biomass turnover than sites characterized by waterlogged, anoxic soils. The presented results are the first field-based es-timates for tree ages, wood biomass productivity and biomass turnover rates in this vast interfluvial landscape. As predicted by future deforestation scenarios, the region will suffer huge impacts as a consequence of human occupation following the re-paving of the BR-319 Highway planned by the Brazilian Government (Laurance et al., 2001; Soares-Filho et al., 2006; Fearnside et al., 2009; Davidson et al., 2012). We discuss the
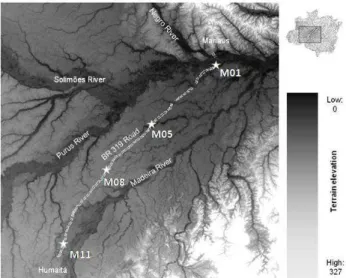
Fig. 1.Map of the Purus–Madeira interfluvial area that is crossed by the BR-319 Highway. The study sites are indicated by white as-teriks. All study sites are sampling modules (M) of the PRONEX-Project “Rapid Assessment for Long Duration Ecological PRONEX-Projects” (RAPELD).
application of the obtained scientific data on wood produc-tivity, stand age and biomass turnover and their relationship to environmental conditions in the background of the sustain-able development of the region to discriminate between areas for strict conservation or management priorities.
2 Material and methods
2.1 Study region
2.2 Sampling design
A total of eleven research modules of the PRONEX project “Rapid Assessment for Long Duration Ecological Projects” (RAPELD) was established along the Purus–Madeira inter-fluvial region as part of the research module network of the Research Program in Biodiversity (PPBio, http://ppbio. inpa.gov.br/sitios/br319). For this study, we selected four out of the eleven modules (Table 1). The average distance be-tween the modules was 140–200 km, spanning an approxi-mately 600 km distance (Fig. 1). In each module we choose two of the ten 1 ha (250×40 m) permanent plots previously installed: one at the highest altitude (well-drained) and the other plot at the lowest topography (poorly drained), using SRTM-DEM data (Shuttle Radar Thematic Mapper Digital Elevation Model, NASA Jet Propulsion Laboratory, US Ge-ological Survey) (Miranda, 2005; Farr et al., 2007). Each plot followed an isocline to minimize variation in the topog-raphy and soil conditions within a plot (Magnusson et al., 2005). The RAPELD program records all trees with diame-ter at breast height (DBH) above 30 cm in the installed 1 ha plots. Trees with a DBH of 10–29.9 cm are considered on two 10 m-large sections on both sides of the 250 m-long transect in the middle of the plot (0.5 ha) (Magnusson et al., 2005). 2.3 Soil data
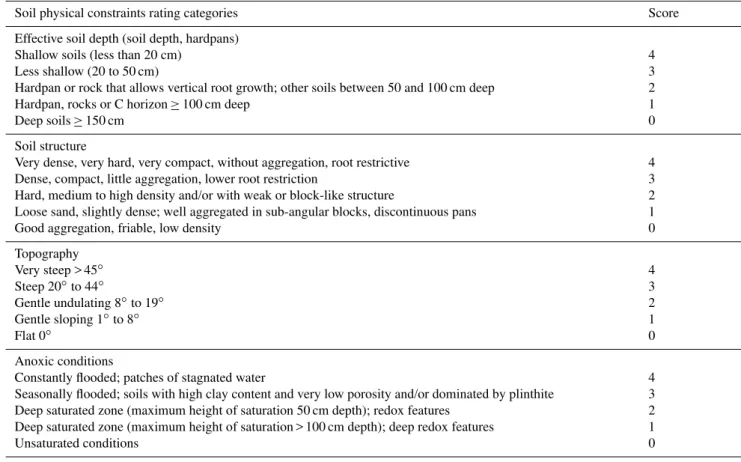
Soil samples of 30 cm depth were extracted with an auger every 50 m along the central 250 m-long transect in all plots, totaling six samples per plot, and kept in sealed plastic bags for 2–5 days. On arrival at the laboratory, the samples were air dried at ambient temperature and composite samples were prepared, resulting in one sample per plot. Soil texture was then analyzed following standard protocol of total disper-sion using sodium pyrophosphate to obtain clay, sand and silt percentages (Donagema et al., 2011). Chemical analy-sis concentration was also analyzed, following the protocol by Donagema et al. (2011). Soil physical constraints in each plot were scored using the classification index of Quesada et al. (2010) (Table 2), using soil samples of 2 m depth collected by the HIDROVEG project (http://ppbio.inpa.gov.br/sitios/ br319). Additionally pits of 2 m depth were dug in modules M01, M05 and M08 for detailed soil descriptions. Soil phys-ical constraints classified by Quesada’s index are based on the effective depth of the soil (i.e. maximum depth that roots can attain), topography, soil structure and density as well as anoxic/hydromorphic properties. Anoxic condition (Table 2) is referred to in the present study as water saturation index. This index may be an important edaphic parameter as it ap-pears to be related to vegetation parameters (Martins et al., 2013), and can be easily scored by identification of redox features at different depths. Superficial phosphorus concen-tration and soil water saturation index scores were available for all 55 plots spread in eleven modules in the whole inter-fluvial region. All soil samples were collected in cooperation
with the HIDROVEG and RAINFOR project and analyzed at the Thematic Soils Laboratory of the National Institute for Amazon Research (INPA).
2.4 Topographical and hydrological conditions
The plots were preselected, based on SRTM data to capture a wide range of topographies within and between the selected modules. Afterwards we applied the Height Above the Near-est Drainage model (HAND) based on SRTM data that indi-cated the vertical distance of the plot in relation to the near-est water-table as an indicator for the hydrological conditions (Rennó et al., 2008; Moulatlet, 2010). We also used the soil water saturation index (Table 2) to indicate the terrain’s hy-drological condition. The difference between this index and the height above the nearest drainage is that the HAND data describe hydrology based on topography, and therefore will be most effective in terrains with pronounced topographi-cal variations, since the level of the groundwater table may vary with the elevation depending on the soil conditions. The water saturation index, on the other hand, is based on soil features that were developed by long-term underground wa-ter fluctuations, such as patches of oxidation/reduction reac-tions and formation of plinthite hardpans (see Quesada et al., 2010), and is therefore a more reliable indicator for variations in soil water saturation of the study sites.
2.5 Field measurements
We considered all trees with DBH > 30 cm in the forest in-ventory (Schietti, 2013) in order to obtain data on wood den-sities as well as to estimate ages and diameter increment rates for each tree by tree-ring analysis. Trees with DBH > 30 cm were selected in ascending order of their numbers in the in-ventory, in order to select trees spread along the plot. Fur-ther, we sampled 30 randomly selected trees within the DBH classes 10–29.9 cm in each plot. Palm trees (Arecaceae) were not considered in this study, since they do not present tree rings. In the studied plots palm trees comprise 9.8±7.9 % of all individuals and 10.2±8.2 % of the total basal area.
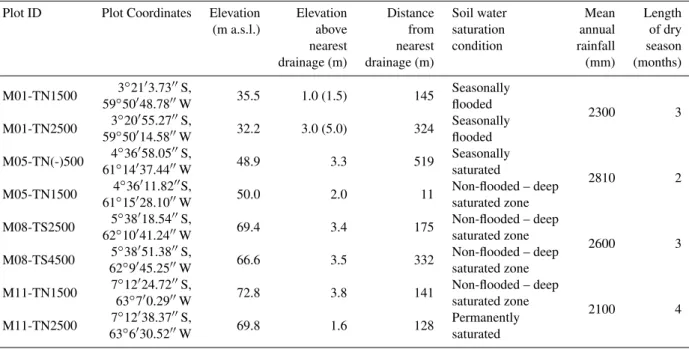
Table 1.Geographical position, hydrology and rainfall patterns of the selected study sites. Elevation above sea level (a.s.l.) is estimated by SRTM data (Shuttle Radar Topographic Mission). Data of the HAND model (Height Above Nearest Drainage) indicate the distance and elevation above the nearest drainage (Rennó et al., 2008); number in parenthesis indicates the flood height of seasonally inundated forests measured in the field. Soil water saturation conditions are described and presented in more detail in Table 2. Rainfall data were obtained from the Brazilian Water Agency (Agência Nacional de Águas – ANA). Length of dry season refers to number of months with less than 100 mm of rainfall.
Plot ID Plot Coordinates Elevation Elevation Distance Soil water Mean Length
(m a.s.l.) above from saturation annual of dry
nearest nearest condition rainfall season
drainage (m) drainage (m) (mm) (months)
M01-TN1500 3◦21′3.73′′S, 35.5 1.0 (1.5) 145 Seasonally
2300 3
59◦50′48.78′′W flooded
M01-TN2500 593◦◦5020′′14.5855.27′′′′WS, 32.2 3.0 (5.0) 324 Seasonallyflooded
M05-TN(-)500 4◦36′58.05′′S, 48.9 3.3 519 Seasonally
2810 2
61◦14′37.44′′W saturated
M05-TN1500 4◦36′11.82′′S, 50.0 2.0 11 Non-flooded – deep
61◦15′28.10′′W saturated zone
M08-TS2500 5◦38′18.54′′S, 69.4 3.4 175 Non-flooded – deep
2600 3
62◦10′41.24′′W saturated zone
M08-TS4500 625◦◦389′′45.2551.38′′′′WS, 66.6 3.5 332 Non-flooded – deepsaturated zone
M11-TN1500 7◦12′24.72′′S, 72.8 3.8 141 Non-flooded – deep
2100 4
63◦7′0.29′′W saturated zone
M11-TN2500 637◦◦126′′30.5238.37′′′′WS, 69.8 1.6 128 Permanentlysaturated
bags to avoid dehydration for three to nine days before an-alyzing. The second sample was glued on labeled wooden supports for later tree-ring analysis. All wood samples were transported to the Dendroecological Laboratory of the sci-entific cooperation between INPA and MPIC (Max Planck Institute for Chemistry) in Manaus for further analyses. 2.6 Botanical data
All listed species were identified by Priscila Souza and Car-olina Levis. After a preliminary identification, the botanical determination was confirmed with the aid of specialists, field guides and by comparing the collected vouchers with spec-imens at the INPA herbarium (Manaus, Brazil) and virtual herbariums (http://sciweb.nybg.org/science2/vii2.asp). Fer-tile specimens were deposited at INPA and sterile mate-rial will be stored in an adjacent working collection. Plants were identified in accordance with the APG III (Angiosperm Phylogenetic Group III) classifications. For name correction of the taxa the Brazilian Flora Species List was consulted (http://floradobrasil.jbrj.gov.br/2012/).
2.7 Biomass and carbon stock estimates
Information on the total basal area and number of individ-uals per hectare for the diameter classes 10–29.9 cm and above 30 cm was obtained from forest inventory data (Schi-etti, 2013). Since trees in the RAPELD program protocol
with DBH of 10–29.9 cm are sampled only on 0.5 ha (Mag-nusson et al., 2005), information on basal area for this diam-eter class was multiplied by factor two to obtain estimates for the entire hectare. To calculate wood density (ρ) the fresh volume (Vfresh) of each sample was determined by the wa-ter displacement method. The object is mounted on a needle and immersed into a recipient filled with water on an analytic balance calibrated to zero. The volume (in mL) of the object is equal to the indicated weight (in g) of the displaced water after submerging the object entirely into the water without touching the side or the bottom of the recipient. After this step of analysis the samples were dried at a temperature of 105◦C to obtain their dry weight (Wdry) (Chave et al., 2005;
Schöngart et al., 2005). Wood specific density was than cal-culated as
ρ=WdryV
fresh. (1)
Table 2.Score table for physical soil constraints (withdrawn and adapted from Quesada et al., 2010). Anoxic conditions were referred to as “water saturation index” in the present study.
Soil physical constraints rating categories Score
Effective soil depth (soil depth, hardpans) Shallow soils (less than 20 cm)
Less shallow (20 to 50 cm)
Hardpan or rock that allows vertical root growth; other soils between 50 and 100 cm deep Hardpan, rocks or C horizon≥100 cm deep
Deep soils≥150 cm
4 3 2 1 0
Soil structure
Very dense, very hard, very compact, without aggregation, root restrictive Dense, compact, little aggregation, lower root restriction
Hard, medium to high density and/or with weak or block-like structure
Loose sand, slightly dense; well aggregated in sub-angular blocks, discontinuous pans Good aggregation, friable, low density
4 3 2 1 0
Topography Very steep > 45◦
Steep 20◦to 44◦
Gentle undulating 8◦to 19◦
Gentle sloping 1◦to 8◦
Flat 0◦
4 3 2 1 0
Anoxic conditions
Constantly flooded; patches of stagnated water
Seasonally flooded; soils with high clay content and very low porosity and/or dominated by plinthite Deep saturated zone (maximum height of saturation 50 cm depth); redox features
Deep saturated zone (maximum height of saturation > 100 cm depth); deep redox features Unsaturated conditions
4 3 2 1 0
Feldpausch et al., 2011) due to vegetation type shifts from the north to the south within the interfluvial region. We used the model developed by Feldpausch et al. (2012) (Eq. 2), re-porting the relative error estimated by the authors for the use of power law regional model for estimating tree height. For the equation described below, the parameters are referred to as aboveground coarse wood biomass (AGWB, in kg), diam-eter at breast height (DBH, in cm), tree height (H, in m), and wood density (ρ, in g cm−3).
AGWB=exp·(−2.9205+0.9894·ln(H·DBH2·ρ)) (2) As not all trees of the plot were sampled we estimate the AGWB in relation to the basal area of the sampled trees. This was performed separately for the two diameter classes DBH > 30 cm (> 30) and trees with DBH 10–29.9 cm (< 30). For this study we assume that the carbon content (C%) in the AGWB is about 47 % (Kirby and Potvin, 2007).
2.8 Tree-ring analysis and growth modeling
We used tree-ring analysis to obtain reliable estimates for tree ages and mean diameter growth rates which have suc-cessfully been applied to estimate wood biomass productivity in different forest types of central Amazonia (Worbes, 1997; Stadtler, 2007; Oliveira, 2010; Schöngart et al., 2010) and
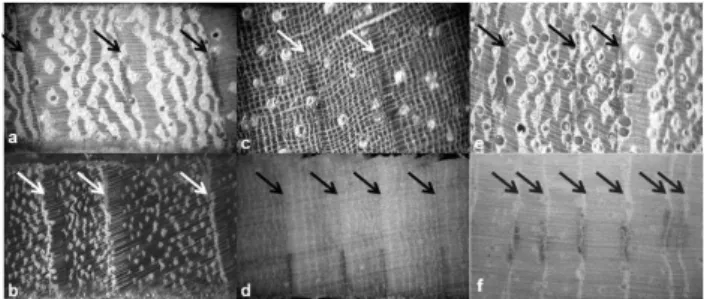
also in the Pantanal wetlands (Schöngart et al., 2011). The prepared wood samples for tree-ring analysis were sanded and polished to produce a plain surface that enabled the vi-sualization of the annual rings based on macroscopic wood anatomical analysis. Wood anatomy of tree rings was char-acterized following Worbes (2002) (Fig. 2). The anatomy of tropical wood may generate uncertainties due to indistinct, false or missing rings that cannot be detected when analyz-ing 5.15 mm cores. These uncertainties are reduced when considering the average of large number of rings for esti-mating mean radial increment and productivity. Since we use only the last five rings to estimate tree productivity, samples with indistinct tree rings were not included in the estimate of aboveground wood biomass productivity (AGWBP).
Fig. 2. Examples of distinct tree rings. The classification of wood anatomy of the tree rings is described following Worbes (2002). (a, b) Parenchyma bands limiting ring boundaries and vessel size/distribution variation from earlywood to latewood;(c, d) al-ternating fiber and parenchyma bands, large in the earlywood and narrow in the latewood;(e, f)marginal parenchyma bands limiting the tree rings. Arrows indicate the boundary of the tree rings.
with DBH > 30 cm and with DBH of 10–29.9 cm, weighted by their relative number of individuals (Ind>30 and Ind<30) in the plot:
AGEPLOT=
AGE>30·Ind>30 Indtotal
+
AGE<30·Ind<30 Indtotal
, (3)
where AGE>30 and AGE<30 represent the average of the ages calculated per diameter class, Ind>30 and Ind<30 rep-resent the number of individuals per diameter class in the plot and Indtotalrepresent the number of all individuals with DBH > 10 cm in the plot.
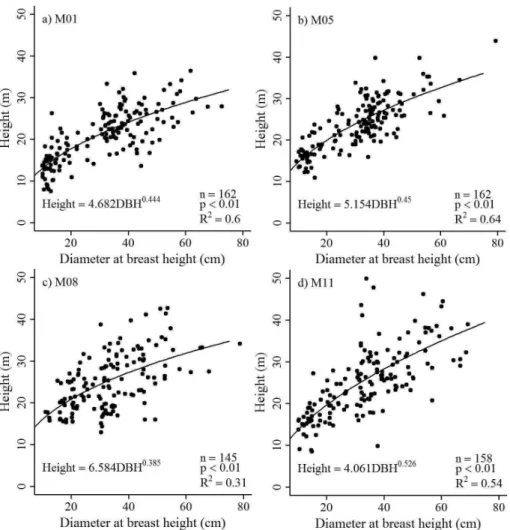
Non-linear regressions were carried out between DBH and tree height using potential equations to produce DBH-height relationships for each plot and module. The relationship be-tween tree age and DBH was fitted to non-linear regression models (Schöngart, 2008):
AGEtree=a·e−bDBH. (4)
2.9 Estimation of stand wood biomass productivity and biomass turnover rates
To estimate the AGWBP the cumulative diameter growth curve of a tree was combined with the stand-specific DBH-height regression model and the wood density to calculate AGWB by the allometric model of Eq. (2) for every year of the entire life span of the tree (Schöngart et al., 2011). We then estimated the current aboveground wood biomass pro-ductivity of each tree (AGWBPtree)calculating the average of the difference between the AGWB for the last five consec-utive years(t )(Eq. 5):
AGWBPtree=X(AGWBt−AGWBt−5) /5, (5)
wheretis the year corresponding to the last ring formed by the tree. As not all trees of the plot were considered for this analysis we estimated the productivity in relation to the basal area for all sampled trees to indicate the current total produc-tivity of the plot. This was performed separately for the two
diameter classes DBH > 30 cm (> 30) and trees with DBH 10–29.9 cm (< 30) (Eq. 6).
AGWBP=
AGWB>30·BATotal BA>30
+AGWB<30·BATotal BA<30
, (6)
Biomass turnover rates in percentage were calculated by dividing AGWBP by AGWB for each plot:
Turnoverbiomass=
AGWBP
AGWB
·100. (7)
Data on stand age, biomass turnover and wood productivity were related to the scored physical constraints indexes using linear regressions (Quesada et al., 2010), considering that the referred indices are semi-categoric. Data analysis and graphs were performed using R (R-Core Development Team, 2013) software packages stats and graphics.
3 Results
3.1 Forest structure
A total of 554 trees were cored in the eight 1 ha plots, from which 20 individuals were not considered for tree-ring anal-ysis due to very low distinction of the growth rings. The sampling effort of coring per plot was 47 to 87 trees with DBH > 30 cm per hectare, corresponding to 53–96 % of all individuals in this diameter class (Table 3). Tree height was measured for a total of 627 trees, as well as DBH. Tree di-ameter explained 56–62 % of the variability in tree height (Fig. 3), with exception of module M08 where the multiple R-squared was only 0.31 (p< 0.01) (Fig. 3c).
Among the most abundant tree species wood den-sity varied from 0.44±0.11 g cm−3 (Apeiba echinata) to
0.90±0.05 g cm−3 (Licania oblongifolia) (Table 4). Mean
wood density of the 20 individuals that were not consid-ered for tree-ring analysis due to very low distinction of the tree rings was 0.49 g cm−3 and 0.46 g cm−3 in plots M01_TN_1500 and M11_TN_1500, respectively, and var-ied between 0.68 g cm−3 and 0.84 g cm−3 in the other plots. Only one individual was not considered in the plot M11_TN_2500, with a wood density of 0.91 g cm−3.
The seasonally flooded sites at M01 presented a much lower basal area (16–17 m2ha−1) compared to the other sites
(21–28 m2ha−1) (Table 3). We also observed lower canopy
heights (24–25 m) and lower mean wood densities (0.64– 0.65 g cm−3)in the seasonally flooded forests of M01
com-pared to the other sites with canopy heights of 25–28 m and mean wood densities of 0.65–0.72 g cm−3.
3.2 Tree ages, radial increment, forest productivity and biomass turnover
Table 3.Number of sampled trees from the diameter classes 10.0–29.9 cm and > 30 cm in each plot. Stand structure is described by basal area as well as by means and standard deviation of canopy height and wood density. Estimates of AGWB and C-stocks in AGWB and the structural conversion factor (AGWBSCFrelated to m2basal area);σAGWBindicates the error of the AGWB estimate. Furthermore for each plot, information on aboveground coarse wood productivity (AGWBP) and carbon sequestration per hectare and year (C-sequestration) are indicated, as well as the annual biomass turnover. The soil conditions are indicated by the soil physical constraints and the soil water saturation indices (see Table 2 for scoring).
Plot ID
M01- M01- M05- M05- M08- M08- M11- M11-TN1500 TN2500 TN(-)500 TN1500 TS2500 TS4500 TN1500 TN2500 Number of cored trees
DBH 10.0–29.9 cm 29 33 27 24 25 25 28 27
DBH > 30 cm 38 36 43 38 47 37 43 34
Structural features
Basal area (m2ha−1) 16 17 22 27 25 28 24 21
Mean canopy height (m) 25±4.5 24±3.9 27±5.0 28±4.0 28±5.9 25±5.3 32±7.9 27±4.9
Mean wood density (g cm−3) 0.65±0.15 0.64±0.13 0.72±0.14 0.71±0.16 0.68±0.13 0.67±0.12 0.65±0.14 0.67±0.16
Stand age (years) 75 64 90 103 100 94 96 65
AGWB (Mg ha−1) 138 136 229 291 274 278 294 205 σAGWB(Mg ha−1) −16.6 −16.3 −27.5 −34.9 −32.8 −33.4 −35.2 −24.6
C-stock AGWB (Mg ha−1) 65 64 108 137 129 131 138 96
AGWBSCF(Mg m−BA2) 8.6 7.9 10.4 10.7 11.1 10.0 12.3 10.0
AGWBP (Mg ha−1yr−1) 4.0 3.4 5.5 6.5 5.6 5.9 6.2 6.6
C-sequestration (Mg ha−1yr−1) 1.9 1.6 2.6 3.1 2.6 2.8 2.9 3.1
Biomass turnover (%) 2.9 2.5 2.4 2.2 2.0 2.1 2.1 3.2 Soil conditions
Soil physical constraints index 10 10 8 8 4 7 7 10
Soil water saturation index 3 3 3 2 1 2 2 4
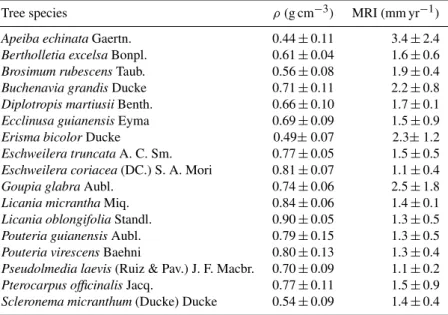
Table 4.Mean value and standard deviation of wood density (ρ) and mean radial increments (MRI) for characteristic tree species with five or more individuals in the study sites.
Tree species ρ(g cm−3) MRI (mm yr−1)
Apeiba echinataGaertn. 0.44±0.11 3.4±2.4
Bertholletia excelsaBonpl. 0.61±0.04 1.6±0.6
Brosimum rubescensTaub. 0.56±0.08 1.9±0.4
Buchenavia grandisDucke 0.71±0.11 2.2±0.8
Diplotropis martiusiiBenth. 0.66±0.10 1.7±0.1
Ecclinusa guianensisEyma 0.69±0.09 1.5±0.9
Erisma bicolorDucke 0.49±0.07 2.3±1.2
Eschweilera truncataA. C. Sm. 0.77±0.05 1.5±0.5 Eschweilera coriacea(DC.) S. A. Mori 0.81±0.07 1.1±0.4
Goupia glabraAubl. 0.74±0.06 2.5±1.8
Licania micranthaMiq. 0.84±0.06 1.4±0.1
Licania oblongifoliaStandl. 0.90±0.05 1.3±0.5
Pouteria guianensisAubl. 0.79±0.15 1.3±0.5
Pouteria virescensBaehni 0.80±0.13 1.3±0.4
Fig. 3.Non-linear relationships between tree diameter at breast height and height. M01, M05, M08 and M11 represent each sampling module for which the models were developed.
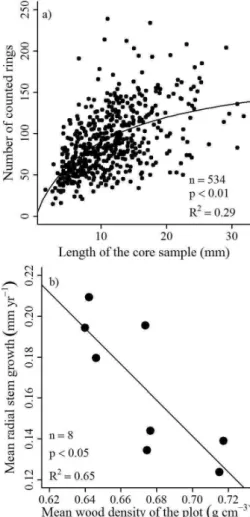
rings without reaching the pith, resulting in an age esti-mate of more than 500 yr, extrapolating the mean radial in-crements in relation to the mean radius of the tree trunk. By this calculation, we estimated that from all the 534 an-alyzed trees, 33 would be more than 200 yr old. The non-linear relationship between DBH and tree age from all plots was significant (n=534,df =532,F =108.65,R2=0.29, p< 0.01) (Fig. 4a). However, the strength of correlation was not sufficient to consider the model as a predictor of tree ages in the field only by measuring DBH, independent of the species. Only about 30 % of the variability of tree age among different species and varying growth condition can be explained by DBH, due to differences in growth rates between species and individuals of the same species grow-ing under different environmental conditions. The lowest mean annual radial increments were observed for Pseudol-media laevis (1.1±0.2 mm yr−1)andEschweilera coriacea
(1.1±0.4 mm yr−1), while A. echinata presented radial
in-crement rates of 3.4±2.4 mm yr−1 (Table 4). On the stand level mean wood density was negatively related to the mean
radial increments (n=8, df =7, F =11.12, R2=0.65, p< 0.05) (Fig. 4b).
Estimates of AGWB resulted in 230 Mg ha−1 with a
standard deviation of 65 Mg ha−1 for the whole study region (Table 3). The lower basal area, canopy height and mean wood density in the M01 stands resulted in lower AGWB estimates of 136–138 Mg ha−1 com-pared to 205–291 Mg ha−1 at the other sites (Table 3). In relation to the basal area of the stand the AGWB stocks varied 7.9–12.3 Mg m−2
basal area. The AGWBP dif-fered from 3.4 Mg ha−1yr−1 to 4.0 Mg ha−1yr−1 in the
seasonally flooded forests of module M01 and was much higher in the other modules ranging between 5.5– 6.6 Mg ha−1yr−1. The estimated C-sequestration varied
be-tween 1.6–1.9 Mg C ha−1yr−1 in the seasonally flooded
Fig. 4. (a)Significant non-linear relationship between the number of counted rings and length of the core samples for all analyzed trees with distinct growth rings and(b)significant correlation between estimated mean radial stem growth and mean wood density of the eight 1 ha plots.
age was lower at seasonally flooded and waterlogged sites (65–96 yr) compared to forests on well-drained sites (94– 103 yr).
3.3 Soil properties
The soil texture of all plots was mainly composed of silt (52.8±18.8 %), with varying smaller percentages of sand (27.7±15.7 %) and clay (19.4±6.0 %) (Table 5). Avail-able superficial phosphorus concentrations varied between 1.4 and 6.3 mg g−1
soil, with the higher values being found in the flooded forests of M01 which might be related to the seasonal inundation by river water. Iron concentration (Fe+)ranged
from 66 to 389 mg g−1
soil. The soil water saturation index var-ied at the seasonally flooded and waterlogged soils by 3–4 and in the well-drained soils by 1–2. The scored soil physical constraint index varied in well-drained soils between 4 and 8
and reached and index of 8–10 in the seasonally flooded and waterlogged soils (Table 3).
3.4 Relationship between forest dynamics and environmental conditions
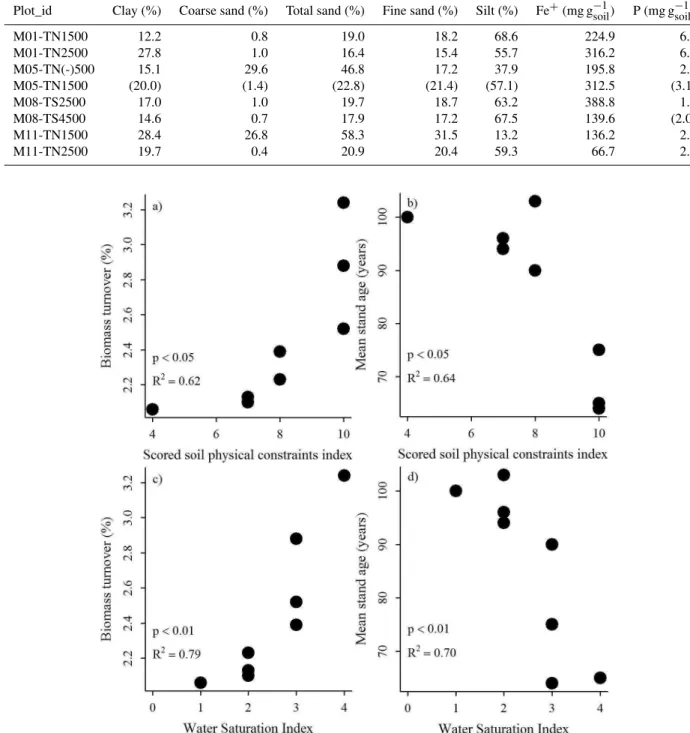
Forest dynamics, in terms of coarse wood biomass productiv-ity, biomass turnover and stand age, is here hypothesized to vary with soil structure and hydrology. We found no relation between AGWBP and the scored soil physical constraints in-dex (n=8,df =6,R2=0.15,F =1.04,p=0.34). On the other hand, the soil physical constraints index was positively related to biomass turnover rates (Fig. 5a) (n=8,df =6, R2=0.62, F=9.81, p< 0.05) and negatively related to stand age (Fig. 5b) (n=8,df =6,R2=0.64,F =10.92, p< 0.05). Among all the soil features that compose the soil physical constraints index, the soil water saturation seems to be an important parameter, showing a strong relation with both biomass turnover and stand age. The soil water satura-tion index was positively related to the biomass turnover rates (Fig. 5c,n=8,df =6,R2=0.79,F =23.31,p< 0.01) and negatively related to stand age (Fig. 5d,n=8,df=6,R2= 0.70,F =13.71,p< 0.01). No significant relationships were found between the soil water saturation index and AGWBP (n=8,df =6,R2=0.03,F =0.20,p> 0.05).
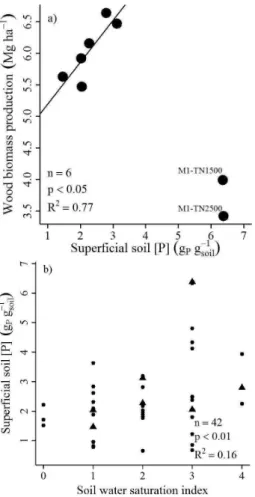
We find no correlation between AGWBP, biomass turnover rates or stand age and parameters of soil texture and chemistry. However, since flooding at the M01 module is influenced by large river waters, soil chemical properties at M01 do not follow the same patterns as in other modules. Therefore, excluding the M01 plots, we noticed a very strong correlation between AGWBP and available phosphorus in the soil (Fig. 6a) (n=,df=4,R2=0.77,F =13.21,p< 0.05). We find no relation between the water saturation index and the phosphorus concentration in our plots, but on a regional scale, there is a positive correlation between the concentra-tion of available phosphorus and the water saturaconcentra-tion index (Fig. 6b,n=42,df=40,R2=0.16,F =7.76,p< 0.01).
4 Discussion
The presented data on tree ages, diameter growth, wood biomass productivity and biomass turnover rates indicate stands of varying forest dynamics in the studied region. The AGWBP of the studied forests varies considerably between 3.4 and 6.6 Mg ha−1yr−1 (Table 3) and biomass turnover
Table 5.Chemical and physical soil properties obtained from 30 cm depth of composited soil samples for each study site. Numbers in parentheses indicate values obtained for 10 cm soil depth.
Plot_id Clay (%) Coarse sand (%) Total sand (%) Fine sand (%) Silt (%) Fe+(mg g−1
soil) P (mg g−soil1)
M01-TN1500 12.2 0.8 19.0 18.2 68.6 224.9 6.3
M01-TN2500 27.8 1.0 16.4 15.4 55.7 316.2 6.3
M05-TN(-)500 15.1 29.6 46.8 17.2 37.9 195.8 2.0
M05-TN1500 (20.0) (1.4) (22.8) (21.4) (57.1) 312.5 (3.1)
M08-TS2500 17.0 1.0 19.7 18.7 63.2 388.8 1.4
M08-TS4500 14.6 0.7 17.9 17.2 67.5 139.6 (2.0)
M11-TN1500 28.4 26.8 58.3 31.5 13.2 136.2 2.2
M11-TN2500 19.7 0.4 20.9 20.4 59.3 66.7 2.8
Fig. 5.Significant relations between the soil physical constraints index and(a)biomass turnover rates and(b)stand age, as well as the relation between soil water saturation index and(c)biomass turnover rates and(d)stand age.
seasonally flooded and waterlogged soils. This makes sense when we think that accelerating biomass turnover rates re-duces the time for late successional development, resulting in forests with younger stand ages composed by trees species with shorter life spans. So far we do not have data on for-est dynamics related to tree turnover considering mortality
and recruitment rates, but our results show that the soil con-straints, especially soil water saturation properties, accelerate forest dynamics in terms of higher biomass turnover.
Fig. 6. (a)Significant relationship between available phosphorus at the soil surface and total aboveground wood productivity (AGWBP) excluding M01 plots, and(b)significant relationship between re-gionally available phosphorus at the soil surface and soil water sat-uration index, with triangles representing the eight sampled sites of this study.
working hypothesis. This is strange at first, since water-logged sites with very evident hydromorphic soil features (higher water saturation index) indicate alternating water-logging and drying very common in Plinthsols (Quesada et al., 2010, 2011), which may reduce oxidized iron atoms, making phosphorus available for plants (Chacon et al., 2006) and thus enhancing tree growth. This mechanism may be valid for the study region as we observe a trend between wood biomass productivity and plant-available phosphorus as well as the relation between the regional variation of available phosphorus and the water saturation index (Fig. 6). Therefore, we expected that enhanced hydromorphic features would result in more productive forests, since the water satu-ration index correlates with stand age and biomass turnover. On the other hand, these stands stocking on poorly devel-oped soils (very hydromorphic, dense and shallow) present higher tree densities with smaller diameters when compared to forests growing on well-drained soils (Schietti, 2013),
probably resulting in lower productivity by structural limi-tation.
Therefore we consider that soil constraints, especially wa-ter saturation, limit the structural development of the for-est, maintaining a state of accelerated dynamics in terms of biomass turnover rates and reduced stand age. We suggest that harsher soil conditions may act as an environmental fil-ter, creating a trade-off for fast-growing trees with shorter life-cycles, especially in the flooded or waterlogged sites, as in young successional stages of central Amazonian flood-plain forests (Wittmann et al., 2006, 2010) and the bottom-land flooded forests at the terra firme(Ferry et al., 2010).
In this case we would expect lower wood densities at water-logged sites and higher wood densities on well-drained soils characterized by slow-growing tree species (Gourlet-Fleury et al., 2011). Despite the low variation of mean wood density among our plots, we find a significant negative relationship between mean radial increments and wood density between the studied sites supporting this hypothesis.
Our results are very similar to those observed by Ferry et al. (2010) in French Guiana. They observe along a gradient from non-flooded hilltops down to seasonally flooded bot-tomlands a decrease of basal area, tree height and biomass storages and an increase in tree mortality, but only small dif-ferences in wood biomass productivity. The authors argue that bottomland areas, besides being more fertile, present lower biomass due to higher mortality rates associated to a poorly developed stand structure of the waterlogged soils. They discuss that this would favor fast-growing and light-demanding species in the bottomland areas, compensating the wood biomass productivity. Our study area is very dif-ferent from the well-known hilltop-bottomland terra firme
forests, mainly because the nearest drainage is vertically very close to the surface even at the well-drained areas. But this mechanism might be also valid for the interfluvial land-scape. Since increased soil constraints lead to higher biomass turnover rates, however, the poorly developed stand structure cannot compensate for the wood biomass productivity.
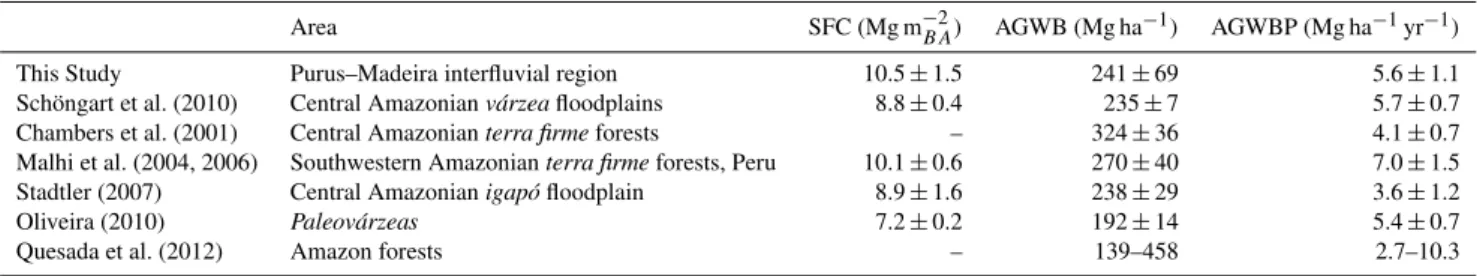
Table 6.Comparison between estimates of AGWB (in Mg ha−1)and AGWBP (in Mg ha−1yr−1)of old-growth forests from this study, with estimates from nutrient-rich (várzea) and nutrient-poor (igapó) floodplain forests, and non-flooded sites (paleovárzeason ancient fluvial terraces andterra firme). The studies of Stadtler (2007), Oliveira (2010) and Schöngart et al. (2010) applied for the estimates of AGWB and AGWBP allometric models considering three independent parameters (diameter, tree height and wood density), while Chambers et al. (2001) and Malhi et al. (2004, 2006) use allometric models with only one (diameter) and two independent variables (diameter, wood density), respectively. SFC (in Mg m−2
BA)is the structural conversion factor relating AGWB to 1 square meter basal area (BA). Values are presented as means and standard deviation (with exception of those from Quesada et al., 2012). The results of other studies presented as Mg C were doubled to correspond to wood biomass.
Area SFC (Mg m−2
BA) AGWB (Mg ha
−1) AGWBP (Mg ha−1yr−1)
This Study Purus–Madeira interfluvial region 10.5±1.5 241±69 5.6±1.1 Schöngart et al. (2010) Central Amazonianvárzeafloodplains 8.8±0.4 235±7 5.7±0.7 Chambers et al. (2001) Central Amazonianterra firmeforests – 324±36 4.1±0.7
Malhi et al. (2004, 2006) Southwestern Amazonianterra firmeforests, Peru 10.1±0.6 270±40 7.0±1.5
Stadtler (2007) Central Amazonianigapófloodplain 8.9±1.6 238±29 3.6±1.2
Oliveira (2010) Paleovárzeas 7.2±0.2 192±14 5.4±0.7 Quesada et al. (2012) Amazon forests – 139–458 2.7–10.3
and affected between 2.5 and 3.2 million square kilometers in the Amazon Basin, respectively, including the interfluvial region between the Purus and Madeira rivers (Phillips et al., 2009; Lewis et al., 2011). Applying conventional tree-ring analysis and stable isotopes analysis for characteristic tree species from different ecotypes (evergreen and deciduous species) between well-drained and waterlogged soils in the interfluvial region, we predict that the vegetation period of tree species varies temporarily between different forest types depending on the soil physical constraints and the soil water regimes such as it was observed between floodplain forests and adjacentterra firmeforests in central Amazonia with a
shift of about 3 months between the growth rhythms of trees between both ecosystems (Schöngart et al., 2004, 2010).
As expected our results indicate a varying wood biomass productivity of 5.6±1.1 Mg ha−1yr−1 in the interfluvial landscape which seems to be more related to stand struc-ture as to environmental parameters. In Table 6 we com-pare the results of AGWB and AGWBP in this study with other studies in different regions and forest ecosystems of the Amazon Basin. The AGWB stocks in the studied forests of the interfluvial landscape of the Purus–Madeira re-gion are lower than in terra firme forests, but higher than
in the nutrient-poor central Amazonian floodplain forests (igapó). Comparing the wood biomass productivity, our
studied forests indicate a similar AGWBP aspaleovárzeas
(5.4±0.7 Mg ha−1yr−1)growing on ancient fluvial terraces (Irion et al., 2010) and the nutrient-rich várzea floodplain
forests (5.7±0.7 Mg ha−1yr−1). In comparison to the sea-sonally floodedigapó(3.6±1.2 Mg ha−1yr−1)and the cen-tral Amazonianterra firmeforests (4.1±0.7 Mg ha−1yr−1) our study indicates a higher AGWBP. Only the southwestern Amazonianterra firmeforests with 7.0±1.5 Mg ha−1yr−1 seem to be more productive, however, as Malhi et al. (2004) applied allometric models, which do not consider tree height for the estimates of AGWB and AGWBP, leading to
poten-tial biases in the biomass estimates (Schöngart et al., 2010; Feldpausch et al., 2012). Still, compared with recent esti-mates of the range of wood biomass productivity for Ama-zonia (2.7–10.3 Mg ha−1yr−1)by Quesada et al. (2012), the
forests of the interfluvial Purus–Madeira region present an above-average wood biomass productivity.
suggest that forests on waterlogged sites should be excluded from any management practices since they present a limited structural development due to poorly structured soils. Forest management activities should be restricted to well-drained soils with more developed forests with a similar or even higher AGWBP of 5.6–6.5 Mg ha−1yr−1than those forests on waterlogged or seasonally flooded soils. Furthermore, the tree-ring data can subside the initial development of applying site-specific and species-specific minimum logging diameter and cutting cycles for timber species in these environments as suggested by the GOL (growth-oriented logging) concept for thevárzeafloodplain forests (Schöngart, 2008) also
con-sidering regeneration dynamics and population structure.
Acknowledgements. We thank the Coordenação de Aperfeiçoa-mento de Pessoal de Nível Superior (CAPES) for financial support; the National Institute for Amazon Research – INPA, for providing all the infrastructure for the laboratories; the Project INPA/Max Planck and the INPA/MAUA group (Ecology, Monitoring and Sustainable Use of Wetlands) coordinated by M. T. F. Piedade for fi-nancing, providing laboratories and logistics; the PPBio/CENBAM coordinated by B. Magnusson and F. Costa for financing and providing all field infrastructure and the HIDROVEG project for logistical support for fields expeditions. We thank the reviewers L. Blanc, M. Larjavaara and M. van de Weg for their valuable comments and suggestions which substantially improved the quality of this study.
The service charges for this open access publication have been covered by the Max Planck Society.
Edited by: P. Stoy
References
Agência Nacional de Águas, http://hidroweb.ana.gov.br/ (last ac-cess: 28 February 2012), 2013.
Baker, T. R., Phillips, O. L., Malhi, Y., Almeida, S., Arroyo, L., Di Fiori, A., Erwin, T., Higuchi, N., Killeen, T. J., Laurance, S. G., Laurance, W. F., Lewis, S. L., Monteagudo, A., Neill, D. A., Vargas, P. N., Pitman, N. C. A., Silva, J. N. M., and Martínez, R. V.: Increasing biomass in Amazonian forest plots, Philos. T. Roy. Soc. B, 359, 353–365, 2004.
Betts, R. A., Cox, P. M., Collins, M., Harris, P. P., Huntingford, C., and Jones, C. D.: The role of ecosystem-atmosphere interac-tions in simulated Amazonian precipitation decrease and forest dieback under global climate warming, Theor. Appl. Climatol., 78, 157–155, 2004.
Brienen, R. J. W. and Zuidema, P. A.: Relating tree growth to rain-fall in Bolivian rain forests: a test for six species using tree ring analysis, Oecologia, 146, 1–12, 2005.
Chacon, N., Silver, W. L., Dubinsky, E. A., and Cusack, D. F. Iron reduction and soil phosphorous solubilization in humid tropical forest soils: the roles of labile carbon pools and an electron shut-tle compound, Biogeochemistry, 78, 67–84, 2006.
Chambers, J. Q., Santos, J., Ribeiro, R. J., and Higuchi, N.: Tree damage, allometric relationships, and above-ground net primary
production in central Amazon forest, Forest Ecol. Manag., 152, 73–84, 2001.
Chave, J., Condit, R., Aguilar, R., Hernandez, A., Lao, L., and Perez, L.: Error propagation and scaling for tropical forest biomass estimates, Philos. T. Roy. Soc. B, 359, 409–420, 2004. Chave, J., Andalo, C., Brown, S., Cairns, M. A., Chambers, J. Q.,
Eamus, D., Fölster, H., Fromard, F., Higuchi, N., Kira, T., Les-cure, J.-P., Nelson, B. W., Ogawa, H., Puig, H., Riéra, B., and Yamakura, T.: Tree allometry and improved estimation of carbon stocks and balance in tropical forests, Oecologia, 145, 87–99, 2005.
Cook, B., Zeng, N., and Yoon, J.-H.: will Amazonia Dry Out? Mag-nitude and Causes of Change from IPCC Climate Model Projec-tions, Earth Interact., 16, 1–27, 2012.
Corlett, R. T.: Impact of warming on tropical lowland forests, Trends Ecol. Evol., 26, 606–613, 2011.
Davidson, E. A., Araújo, A. C., Artaxo, P., Balch, J. K., Brown, I. F., Bustamante, M. C. M., Coe, M. T., De Fries, R. S., Keller, M., Longo, M., Munger, J. W., Schroeder, W., Soares-Filho, B. S., Souza Jr., C. M., and Wofsy, S. C.: The Amazon basin in transition, Nature, 481, 321–328, 2012.
Donagema, G. K., Campos, D. V. B., Calderano, S., B., Teixeira, W. G., and Viana, J. H. M.: Manual de métodos de análise de solo, EMBRAPA SOLOS, Brazil, Rio de Janeiro, 2011.
Dufresne, J.-L., Friedlingstein, P., Berthelot, M., Bopp, L., Ciais, P., Fairhead, L., Le Treut, H., and Monfray, P.: On the mag-nitude of positive feedback between future climate change and the carbon cycle, Geophys. Res. Lett., 29, 43-1–43-4, doi:10.1029/2001GL013777, 2002.
Farr, T. G., Rosen, P. A., Caro, E., Crippen, R., Duren, R., Hens-ley, S., Kobrick, M., Paller, M., Rodriguez, E., Roth, L., Seal, D., Shaffer, S., Shimada, J., Umland, J., Werner, M., Oskin, M., Bur-bank, D., and Alsdorf, D.: The shuttle radar topography mission, Rev. Geophys., 45, RG2004, doi:10.1029/2005RG000183, 2007. Fearnside, P. M., Graça, P. M. L. A., Keizer, E. W. H., Maldon-ado, F. D., Barbosa, R. I., and Nogueira, E. M.: Modelagem de desmatamento e emissões de gases de efeito estufa na BR-319, Revista Brasileira de Meteorologia, 24, 208–233, 2009. Feldpausch, T. R., Banin, L., Phillips, O. L., Baker, T. R., Lewis,
S. L., Quesada, C. A., Affum-Baffoe, K., Arets, E. J. M. M., Berry, N. J., Bird, M., Brondizio, E. S., de Camargo, P., Chave, J., Djagbletey, G., Domingues, T. F., Drescher, M., Fearnside, P. M., França, M. B., Fyllas, N. M., Lopez-Gonzalez, G., Hladik, A., Higuchi, N., Hunter, M. O., Iida, Y., Salim, K. A., Kassim, A. R., Keller, M., Kemp, J., King, D. A., Lovett, J. C., Mari-mon, B. S., Marimon-Junior, B. H., Lenza, E., Marshall, A. R., Metcalfe, D. J., Mitchard, E. T. A., Moran, E. F., Nelson, B. W., Nilus, R., Nogueira, E. M., Palace, M., Patiño, S., Peh, K. S.-H., Raventos, M. T., Reitsma, J. M., Saiz, G., Schrodt, F., Sonké, B., Taedoumg, H. E., Tan, S., White, L., Wöll, H., and Lloyd, J.: Height-diameter allometry of tropical forest trees, Biogeo-sciences, 8, 1081–1106, doi:10.5194/bg-8-1081-2011, 2011. Feldpausch, T. R., Lloyd, J., Lewis, S. L., Brienen, R. J. W., Gloor,
Domingues, T. F., Erwin, T. L., Fearnside, P. M., França, M. B., Freitas, M. A., Higuchi, N., E. Honorio C., Iida, Y., Jiménez, E., Kassim, A. R., Killeen, T. J., Laurance, W. F., Lovett, J. C., Malhi, Y., Marimon, B. S., Marimon-Junior, B. H., Lenza, E., Marshall, A. R., Mendoza, C., Metcalfe, D. J., Mitchard, E. T. A., Neill, D. A., Nelson, B. W., Nilus, R., Nogueira, E. M., Parada, A., Peh, K. S.-H., Pena Cruz, A., Peñuela, M. C., Pitman, N. C. A., Prieto, A., Quesada, C. A., Ramírez, F., Ramírez-Angulo, H., Reitsma, J. M., Rudas, A., Saiz, G., Salomão, R. P., Schwarz, M., Silva, N., Silva-Espejo, J. E., Silveira, M., Sonké, B., Stropp, J., Taedoumg, H. E., Tan, S., ter Steege, H., Terborgh, J., Torello-Raventos, M., van der Heijden, G. M. F., Vásquez, R., Vilanova, E., Vos, V. A., White, L., Willcock, S., Woell, H., and Phillips, O. L.: Tree height integrated into pantropical forest biomass es-timates, Biogeosciences, 9, 3381–3403, doi:10.5194/bg-9-3381-2012, 2012.
Ferry, B., Morneau, F., Bontemps, J.-D., and Freycon, V.: Higher treefall rates on slopes and waterlogged soils may result in lower stand biomass and productivity in a tropical rain forest, J. Ecol., 98, 106–116, 2010.
Flora do Brasil: Lista de Espécies da Flora do Brasil, http:// floradobrasil.jbrj.gov.br/2012/ (last access: 11 December 2012), 2012.
Foley, J. A., Botta, A., Coe, M. T., and Costa, M. H.: El Niño-Southern Oscillation and the climate, ecosystems and rivers of Amazonia, Global Biogeochem. Cy., 16, 1132, doi:10.1029/2002GB001872, 2002.
Girardin, C. A. J., Malhi, Y., Aragão, L. E. O. C., Mamani, M., Huaraca Huaso, W., Durand, L., Feeley, K. J., Rapp, J., Silva-Espejo, E., Silman, M., Salinas, M., and Whittaker, R. J.: Net primary productivity allocation and cycling of carbon along a tropical forest elevational transect in the Peruvian Andes, Glob. Change Biol., 16, 3176–3192, 2010.
Gourlet-Fleury, S., Rossi, V., Rejou-Mechain, M., Freycon, V., Fay-olle, A., Saint-André, L., Cornu, G., Gérard, J., Sarrailh, J.-M., Flores, O., Baya, F., Billand, A., Fauvet, N., Gally, M., Henry, M., Hubert, D., Pasquier, A., and Picard, N.: Envionmental fil-tering of dense-wooded species controls above-ground biomass stores in African Moist Forests, J. Ecol., 99, 981–990, 2011. IBGE, Recursos naturais e meio ambiente: uma visão do Brasil,
In-stituto Brasileiro de Geografia e Estatística, Brasil, 2nd ed, 1997. Instituto Nacional de Pesquisas da Amazônia (INPA), Manaus, Brazil: Programa de Pesquisa em Biodiversidade – PPBio, http: //www.ppbio.inpa.gov.br (last access: 20 February 2012), 2012. Irion, G., de Mello, J. A. S. N., Morais, J., Piedade, M. T. F.,
Junk, W. J., and Garming, L.: Development of the Amazon valley during the Middle to Late Quaternary: sedimentological and climatological observations, in: Central Amazonian flood-plain forests: Ecophysiology, biodiversity and sustainable man-agement, edited by: Junk, W. J., Piedade, M. T. F., Wittmann, F., Schöngart, J., and Parolin, P., Ecological Studies, Springer, Berlin/Heidelberg/New York, 27–42, 2010.
Junk, W. J., Piedade, M. T. F., Schöngart, J., Cohn-Haft, M., Adeney, J. M., and Wittmann, F.: A Classification of Major Naturally-Occurring Amazonian Lowland Wetlands, Wetlands, 31, 623–640, 2011.
Kirby, K. R. and Potvin, E.: Variation in carbon storage among tree species: Implications for the managements of a small-scale car-bon sink project, Forest Ecol. Manag., 246, 208–221, 2007.
Laurance, W. F., Cochrane, M. A., Bergen, S., Fearnside, P. M., Delamônica, P., Barber, C., D’Angelo, S., and Fernandes, T.: The future of the Brazilian Amazon, Science, 291, 438–439, 2001. Lewis, S. L., Brando, P., Phillips, O. L., van der Heijden, G. M. F.,
and Nepstad, D.: The 2010 Amazon Drought, Science, 331, p. 554, 2011.
Magnusson, W. E., Lima, A. P., Luizão, R., Luizão, F., Costa, F. R. C., Castilho, C. V., and Kinupp, V. R.: RAPELD: a modifica-tion of the Gentry method for biodiversity surveys in long-term ecological study sites, Biota Neotropica, 5, 1–6, 2005.
Malhi, Y., Baker, T. R., Phillips, O. L., Almeida, S., Alvarez, E., Arroyo, L., Chave, J., Czimczik, C. I., Di Fiori, A., Higuchi, N., Killeen, T. J., Laurance, S. G., Laurance, W. F., Lewis, S. L., Montoya, L. M. M., Monteagudo, A., Neill, D. A., Vargas, P. N., Patiño, S., Pitman, N. C. A., Quesada, C. A., Salomão, R., Silva, J. N. M., Lezama, A. T., Martínez, R. V., Terborgh, J., Vinceti, B., and Lloyd, J.: The above-ground coarse wood productivity of 104 Neotropical forest plots, Glob. Change Biol., 10, 563–591, 2004.
Malhi, Y., Wood, D., Baker, T. R., Wright, J., Phillips, O. L., Cochrane, T., Meir, P., Chave, J., Almeida, S., Arroyo, L., Higuchi, N., Killeen, T. J., Laurance, S. G., Laurance, W. F., Lewis, S. L., Monteagudo, A., Neill, D. A., Vargas, P. N., Pitman, N. C. A., Quesada, C. A., Salomão, R., Silva, J. N. M., Lezama, A. T., Terborgh, J., Martínez, R. V., and Vinceti, B.: The regional variation of aboveground live biomass in old-growth Amazonian forest, Glob. Change Biol., 12, 1–32, 2006.
Marengo, R.: Interdecadal variability and trends of rainfall across the Amazon basin, Theor. Appl. Climatol., 78, 79–96, 2004. Marengo, J. A., Nobre, C. A., Tomasella, J., Cardoso, M. F., and
Oyama, M. D.: Hydro-climatic and ecological behaviour of the drought of Amazonia in 2005, Philos. T. R. Soc. Lon. B, 363, 1773–1778, 2008.
Martins, D. L., Schietti, J., Luizão, F. J., Phillips, O., Andrade, A., Castilho, Andrade, A., C. V., Laurance, S.G., Oliveira, A., Toledo, J. J., Lugli, L.F. Mendoza, E.M.O., Feldpausch, T. R., and Quesada, C. A. Soil induced changes on vegetation drive necromass stocks in Central Amazonia, Plant Ecology Diversity, special ed., in review, 2013.
Miranda, E. E.: Brasil em Relevo, Campinas, Embrapa, Monitora-mento por Satélite, available in: Brasil em Relevo, Embrapa monitoramento por satélite, http://www.relevobr.cnpm.embrapa. br (last access: 29 March 2013), 2005.
Moulatlet, G. M.: A importância de condições hidrológicas na dis-tribuição e conservação de plantas herbáceas de sub-bosque em florestas amazônicas: uma contribuição em escala regional, M. Sc. Thesis, Brazil, National Institute for Amazon Research, 51 pp., 2010.
NASA Jet Propulsion Laboratory, California Institute of Technol-ogy: US Geological Survey, http://www.usgs.gov (last access: 29 February 2012), 2012.
Nogueira, E. M., Fearnside, M. P., Nelson, B. N., Barbosa, R. I., and Keizer, E. W. H.: Estimates of forest biomass in the Brazilian Amazon: new allometric equations and adjustments to biomass from wood-volume inventories, Forest Ecol. Manag., 256, 1853– 1867, 2008a.
shorter trees in south and southwest imply lower biomass, Forest Ecol. Manag., 255, 2963–2972, 2008b.
Oliveira, C. L.: Estimativas da dinâmica de carbono na biomassa lenhosa de terra firme na Reserva de Desenvolvimento Susten-tável Amanã por métodos dendrcronológicos, M.Sc. thesis, Na-tional Institute for Amazon Research, 43 pp., 2010.
Phillips, O. L., Aragão, L. E. O. C., Lewis, S. L., Fischer, J. B., Lloyd, J., López-Gonzales, G., Malhi, Y., Monteagudo, A., Pea-cock, J., Quesada, C. A., vam-der-Heijden, G., Almeida, S., Amaral, L., Arroyo, L., Aymard, G., Baker, T. R., Bánki, O., Blanc, L., Bonal, D., Brando, P., Chave, J., Oliveira, A. C. A., Cardozo, N. A., Czimczik, C. I., Feldpausch, T. R., Freitas, M. A., Gloor, E., Higushi, N., Jiménez, E., Lloyd, G., Meir, P., Men-doza, P., Morel, A., Neill, D. A., Nepstad, D., Patiño, S., Peñuela, M. C., Prieto, A., Ramírez, F., Schwartz, M., Silva, J., Silveira, M., Thomas, A. S., ter-Steege, H., Stropp, J., Vásquez, R., Ze-lazowski, P., Dávila, E. A., Andelman, S., Andrade, A., Chao, K. J., Erwin, T., Di-Fiore, A., Honório, E., Keeling, H., Kileen, T. J., Laurance, W. F., Cruz, A. P., Pitman, N. C. A., Vergas, P. N., Ramírez-Angulo, H., Rudas, A., Salamão, R., Silva, N., Terborgh, J., and Torres-Lezama, A.: Drought sensitivity of the Amazon forest, Science, 323, 1344–1347, 2009.
Quesada, C. A., Lloyd, J., Schwarz, M., Patiño, S., Baker, T. R., Cz-imczik, C., Fyllas, N. M., Martinelli, L., Nardoto, G. B., Schmer-ler, J., Santos, A. J. B., Hodnett, M. G., Herrera, R., Luizão, F. J., Arneth, A., Lloyd, G., Dezzeo, N., Hilke, I., Kuhlmann, I., Raessler, M., Brand, W. A., Geilmann, H., Moraes Filho, J. O., Carvalho, F. P., Araujo Filho, R. N., Chaves, J. E., Cruz Junior, O. F., Pimentel, T. P., and Paiva, R.: Variations in chemical and physical properties of Amazon forest soils in relation to their genesis, Biogeosciences, 7, 1515–1541, doi:10.5194/bg-7-1515-2010, 2010.
Quesada, C. A., Lloyd, J., Anderson, L. O., Fyllas, N. M., Schwarz, M., and Czimczik, C. I.: Soils of Amazonia with particular ref-erence to the RAINFOR sites, Biogeosciences, 8, 1415–1440, doi:10.5194/bg-8-1415-2011, 2011.
Quesada, C. A., Phillips, O. L., Schwarz, M., Czimczik, C. I., Baker, T. R., Patiño, S., Fyllas, N. M., Hodnett, M. G., Herrera, R., Almeida, S., Alvarez Dávila, E., Arneth, A., Arroyo, L., Chao, K. J., Dezzeo, N., Erwin, T., di Fiore, A., Higuchi, N., Honorio Coronado, E., Jimenez, E. M., Killeen, T., Lezama, A. T., Lloyd, G., López-González, G., Luizão, F. J., Malhi, Y., Monteagudo, A., Neill, D. A., Núñez Vargas, P., Paiva, R., Peacock, J., Peñuela, M. C., Peña Cruz, A., Pitman, N., Priante Filho, N., Prieto, A., Ramírez, H., Rudas, A., Salomão, R., Santos, A. J. B., Schmer-ler, J., Silva, N., Silveira, M., Vásquez, R., Vieira, I., Terborgh, J., and Lloyd, J.: Basin-wide variations in Amazon forest struc-ture and function are mediated by both soils and climate, Bio-geosciences, 9, 2203–2246, doi:10.5194/bg-9-2203-2012, 2012. R Core Team.: R: A language and environment for statistical com-puting, http://www.R-project.org/ (last access: 12 October 2013), 2013.
Rennó, C. D., Nobre, A. D., Cuartas, L. A., Soares, J. V., Hod-nett, M. G., Tomasella, J., and Waterloo, M. J.: HAND, a new terrain descriptor using SRTM-DEM: Mapping terra-firme rain-forest environments in Amazônia, Remote Sens. Environ., 112, 3469–3481, 2008.
Rosetti, D. F., Toledo, P. M., and de-Góes, A. M.: New geological framework for Western Amazonia (Brazil) and implications for biogeography and evolution, Quaternary Res., 63, 78–89, 2005. Schietti, J.: Interações entre floresta, chuva e solo em áreas de lençól
freático superficial na Amazônia Central, Ph.D Thesis, National Institute for Amazon Research, 144 pp., 2013.
Schöngart, J.: Growth Oriented Logging (GOL): A new concept towards sustainable forest management in Central Amazonian várzea floodplains, Forest Ecol. Manag., 256, 46–58, 2008. Schöngart, J. and Junk, W. J.: Forecasting the flood-pulse in central
Amazonia by ENSO-indices, J. Hydrol., 335, 124–132, 2007. Schöngart, J., Piedade, M. T. F., Ludwigshausen, S., Horna, V.,
and Worbes, M.: Phenology and stem-growth periodicity of tree species in Amazonian floodplain forests, J. Trop. Ecol., 18, 581– 597, 2002.
Schöngart, J., Junk, W. J., Piedade, M. T. F., Ayres, J. M., Hütter-mann, A., and Worbes, M.: Teleconnection between tree growth in the Amazonian floodplains and the El Niño Southern Oscilla-tion effect, Glob. Change Biol., 10, 683–692, 2004.
Schöngart, J., Piedade, M. T. F., Wittmann, F., Junk, W. J., and Worbes, M.: Wood growth patterns ofMacrolobium acaciifolium (Benth.) Benth.(Fabaceae) in Amazonian black-water and white-water floodplain forests, Oecologia, 145, 454–461, 2005. Schöngart, J., Wittmann, F., and Worbes, M.: Biomass and NPP
of Central Amazonian floodplain forests, in: Amazonian flood-plainforests: Ecophysiology, biodiversity and sustainable man-agement, edited by: Junk, W. J., Piedade, M. T. F., Wittmann, F., Schöngart, J., and Parolin, P., Ecological Studies, Springer, Berlin/Heidelberg/New York, 347–388, 2010.
Schöngart, J., Arieira, J., Felfili Fortes, C., Cezarine de Arruda, E., and Nunes da Cunha, C.: Age-related and stand-wise estimates of carbon stocks and sequestration in the aboveground coarse wood biomass of wetland forests in the northern Pantanal, Brazil, Bio-geosciences, 8, 3407–3421, doi:10.5194/bg-8-3407-2011, 2011. Soares-Filho, B. S., Nepstad, D. C., Curran, L. M., Cerqueira, G. C., Garcia, R. A., Azevedo Ramos, C., Voll, E., McDonald, A., Lefebvre, P., and Schlesinger, P.: Modelling conservation in the Amazon basin, Nature, 440, 520–523, 2006.
Sombroek, W.: Spatial and temporal patterns of Amazon rainfall, Ambio, 30, 388–396, 2001.
Stadtler, E.: Estimativas de biomassa lenhosa, estoque e seqüestro de carbono acima do solo ao longo do gradiente de inundação em uma floresta de igapó alagada por água preta na amazônia central, M. Sc. thesis, National Institute for Amazon Research, Brazil, 57 pp., 2007.
The New York Botanical Garden: International Plant Science Cen-ter – The C. V. Starr Virtual Hebarium, http://sciweb.nybg.org/ science2/vii2.asp (last access: 12 November 2012), 2012. Tomasella, J., Borma, L. S., Marengo, J. A., Rodriguez, D. A.,
Cuar-tas, L. A., Nobre, C. A., and Prado, M. C. L.: The droughts of 1996–1997 and 2004–2005 in Amazonia: hydrological response in the river main stem, Hydrol. Process., 25, 1228–1242, 2011. Wittmann, F., Schöngart, J., Montero, J. C., Motzer, T., Junk, W. J.,
Piedade, M. T. F., Queiroz, H. L., and Worbes, M.: Tree species composition and diversity gradients in white-water forests across the Amazon Basin, J. Biogeogr., 33, 1334–1347, 2006.
Ecophysiology, biodiversity and sustainable management, edited by: Junk, W. J., Piedade, M. T. F., Wittmann, F., Schöngart, J., and Parolin, P., Ecological Studies, vol. 2010, Springer Verlag, Dordrecht, Heidelberg, London, New York, 61–102, 2010. Worbes, M.: The forest ecosystem of the floodplains, in: The
Cen-tral Amazon Floodplains. Ecology of a Pulsing System, edited by Junk, W. J., Springer Verlag, Berlin, Heidelberg, 223–266, 1997.
Worbes, M.: One hundred years of tree-ring research in the trop-ics – a brief history and an outlook to future challenges, Den-drochronologia, 20, 217–231, 2002.