BGD
6, 3993–4057, 2009Effect of soils on forest structure and
dynamics in Amazonia
C. A. Quesada et al.
Title Page
Abstract Introduction
Conclusions References
Tables Figures
◭ ◮
◭ ◮
Back Close
Full Screen / Esc
Printer-friendly Version
Interactive Discussion Biogeosciences Discuss., 6, 3993–4057, 2009
www.biogeosciences-discuss.net/6/3993/2009/ © Author(s) 2009. This work is distributed under the Creative Commons Attribution 3.0 License.
Biogeosciences Discussions
Biogeosciences Discussionsis the access reviewed discussion forum ofBiogeosciences
Regional and large-scale patterns in
Amazon forest structure and function are
mediated by variations in soil physical
and chemical properties
C. A. Quesada1,10, J. Lloyd1, M. Schwarz2, T. R. Baker1, O. L. Phillips1,
S. Pati ˜no3,4, C. Czimczik5, M. G. Hodnett6, R. Herrera7, A. Arneth8, G. Lloyd5,
Y. Malhi9, N. Dezzeo7, F. J. Luiz ˜ao10, A. J. B. Santos10,
†
, J. Schmerler5,
L. Arroyo11, M. Silveira12, N. Priante Filho13, E. M. Jimenez14, R. Paiva10,15,
I. Vieira16, D. A. Neill17, N. Silva18, M. C. Pe ˜nuela14, A. Monteagudo19,20,
R. V ´asquez20, A. Prieto21, A. Rudas21, S. Almeida16, N. Higuchi10, A. T. Lezama22,
G. L ´opez-Gonz ´alez1, J. Peacock1, N. M. Fyllas1, E. Alvarez D ´avila23, T. Erwin24,
A. di Fiore25, K. J. Chao1, E. Honorio26, T. Killeen27, A. Pe ˜na Cruz20, N. Pitman28,
P. N ´u ˜nez Vargas19, R. Salom ˜ao16, J. Terborgh28, and H. Ram´ırez22
1
BGD
6, 3993–4057, 2009Effect of soils on forest structure and
dynamics in Amazonia
C. A. Quesada et al.
Title Page Abstract Introduction Conclusions References Tables Figures ◭ ◮ ◭ ◮ Back Close
Full Screen / Esc
Printer-friendly Version
Interactive Discussion
2
Ecoservices, 07743 Jena, Germany
3
Instituto de Investigaci ´on de Recursos Biol ´ogicos, Alexander von Humboldt, Bogot ´a, Colombia
4
UMR-ECOFOG, INRA, 97310, Korou, French Guiana
5
Max-Planck-Institut fuer Biogeochemie, Jena, Germany
6
Centre for Ecology and Hydrology, Wallingford, UK
7
Instituto Venezolano de Investigaciones Cient´ıficas, Caracas, Venezuela
8
Geography and Ecosystem Analysis, Lund University, Lund, Sweden
9
School of Geography and the Environment, University of Oxford, Oxford, UK
10
Institito Nacional de Pesquisas da Amaz ˆonia, Manaus, Brazil
11
Museo Noel KempffMercado, Santa Cruz, Bolivia
12
Depto de Ci ˆencias da Natureza, Universidade Federal do Acre, Rio Branco, Brazil
13
Depto de Fisica, Universidade Federal do Mato Grosso, Cuiaba, Brazil
14
Universidad Nacional de Colombia, Lecticia, Colombia
15
Secretaria M.de Desenvolvimento e Meio Ammbiente, Pref. M. de Mau ´es, Mau ´es, Brazil
16
Museu Paraense Emilio Goeldi, Bel ´em, Brazil
17
Herbario Nacional del Ecuador, Quito, Ecuador
18
Empresa Brasileira de Pesquisas Agropecu ´arias, Belem, Brazil
19
Herbario Vargas, Universidad Nacional San Antonio Abad del Cusco, Cusco, Peru
20
Proyecto Flora del Per ´u, Jardin Botanico de Missouri, Oxapampa, Peru
21
Instituto de Ciencias Naturales, Universidad Nacional de Colombia, Bogot ´a, Colombia
22
Faculdad de Ciencias Forestales y Ambientales, Univ. de Los Andes, Merida, Venezuela
23
Gestion Ambiental, interconexion eletrica S.A., Medellin, Colombia
24
Smithsonian Institution, Washington, DC 20560-0166, USA
25
Department of Anthropology, New York University, New York, NY 10003, USA
26
IIAP, Apartado Postal 784, Iquitos, Peru
27
Centre for Applied Biodiversity Science, Conservation International, Washington DC, USA
28
Centre for Tropical Conservation, Duke University, Durham, USA †
BGD
6, 3993–4057, 2009Effect of soils on forest structure and
dynamics in Amazonia
C. A. Quesada et al.
Title Page
Abstract Introduction
Conclusions References
Tables Figures
◭ ◮
◭ ◮
Back Close
Full Screen / Esc
Printer-friendly Version
Interactive Discussion Received: 18 December 2008 – Accepted: 2 February 2009 – Published: 8 April 2009
Correspondence to: C. A. Quesada ([email protected])
BGD
6, 3993–4057, 2009Effect of soils on forest structure and
dynamics in Amazonia
C. A. Quesada et al.
Title Page
Abstract Introduction
Conclusions References
Tables Figures
◭ ◮
◭ ◮
Back Close
Full Screen / Esc
Printer-friendly Version
Interactive Discussion Abstract
Forest structure and dynamics have been noted to vary across the Amazon Basin in an east-west gradient in a pattern which coincides with variations in soil fertility and geology. This has resulted in the hypothesis that soil fertility may play an important role in explaining Basin-wide variations in forest biomass, growth and stem turnover rates. 5
To test this hypothesis and assess the importance of edaphic properties in affect forest structure and dynamics, soil and plant samples were collected in a total of 59 different forest plots across the Amazon Basin. Samples were analysed for exchange-able cations, C, N, pH with various P fractions also determined. Physical properties were also examined and an index of soil physical quality developed.
10
Overall, forest structure and dynamics were found to be strongly and quantitatively related to edaphic conditions. Tree turnover rates emerged to be mostly influenced by soil physical properties whereas forest growth rates were mainly related to a measure of available soil phosphorus, although also dependent on rainfall amount and distribu-tion. On the other hand, large scale variations in forest biomass could not be explained 15
by any of the edaphic properties measured, nor by variation in climate.
A new hypothesis of self-maintaining forest dynamic feedback mechanisms initiated by edaphic conditions is proposed. It is further suggested that this is a major factor determining forest disturbance levels, species composition and forest productivity on a Basin wide scale.
20
1 Introduction
There is a coincident semi-quantitative correlation between forest above ground biomass gain (AGB) and soil fertility observed across the Amazon Basin (Malhi et al., 2004). But what controls Amazon forest productivity and function, either at a Basin wide scale or regionally remains to be accurately determined.
25
BGD
6, 3993–4057, 2009Effect of soils on forest structure and
dynamics in Amazonia
C. A. Quesada et al.
Title Page
Abstract Introduction
Conclusions References
Tables Figures
◭ ◮
◭ ◮
Back Close
Full Screen / Esc
Printer-friendly Version
Interactive Discussion also varies across the Amazon Basin (Phillips et al., 2004) with an east-west gradient
coinciding with gradients of soil fertility and geology as first described by Sombroek (1966) and Irion (1978). An average turnover rate of 1.35% yr−1 is observed in the infertile eastern and central areas whilst the average turnover rate of 2.60% yr−1occurs in the more fertile west and south-west portion of Amazonia. This pattern has resulted 5
in the hypothesis that soil fertility may play an important role in explaining the almost two-fold difference in stem turnover rates between the western and central-eastern areas (Phillips et al., 2004; Stephenson and Van Mantgen, 2005).
Nevertheless, in addition to soil fertility per se, soil physical properties such as a lim-ited rooting depth, low drainage capacity, low water holding capacity, the presence of 10
hardpans, bad soil structure and topographic position have also long been known to be an important limitations to forest growth, directly or indirectly influencing tree mor-tality and turnover rates across both temperate and tropical forest ecosystems (Arshad et al., 1996; Dietrich et al., 1996; Gale and Barfod, 1999; Schoenholtz et al., 2000). Variations in soil fertility and physical properties across the Amazon Basin are similarly 15
related to variations in soil age and type of parent material (Quesada et al., 2009). Specifically, highly weathered soils are generally of depths several metres above the parent material and usually have very good physical conditions as a result of millenni-ums of soil development (Sanchez, 1987). On the other hand, the more fertile soils in Amazonia are closely related to lower levels of pedogenesis with the parent material 20
still a source of nutrients, or often as a consequence of bad drainage and/or deposition of nutrients by flooding waters (Irion, 1978; Herrera et al., 1978; Quesada et al., 2009). It is for this reason that soil fertility is to some extent correlated with physical limiting conditions (Quesada et al., 2009).
This gives rise to the idea that the previously identified relationship found between 25
BGD
6, 3993–4057, 2009Effect of soils on forest structure and
dynamics in Amazonia
C. A. Quesada et al.
Title Page
Abstract Introduction
Conclusions References
Tables Figures
◭ ◮
◭ ◮
Back Close
Full Screen / Esc
Printer-friendly Version
Interactive Discussion In any case, relationships of forest dynamics and structure with soil fertility are not
clear. For example, the effect of soil properties on tropical forest above ground biomass have been contradictory: Some studies have found interactions between soil fertility and above ground biomass (Laurance et al., 1999; Roggy et al., 1999), but most other studies have found no relationship with soil fertility (Proctor et al., 1983; Clark and Clark 5
2000; Chave et al., 2001; DeWalt and Chave, 2004), with climate then being invoked as a causative factor.
An important step forward was made by Baker et al. (2004) who found that the vari-ations in above ground biomass are mostly related to stand wood specific gravity dif-ferences. Thus what causes variations in wood specific gravity has a direct influence 10
on the above ground biomass variations.
Here we look in some detail at the relationship between Amazon forest soil physical and chemical conditions and forest turnover rates, above ground biomass gain, aver-age plot wood density and above ground biomass. We use both previously published data (Phillips et al., 2004; Malhi et al., 2004; Baker et al., 2004) and newly calculated 15
estimates of these parameters from the RAINFOR database (Peacock et al., 2007), all estimates used were prior to 2005.
2 Material and methods
2.1 Study sites
From the complete soils dataset found in Quesada et al. (2009, Table 1), a subset of 20
59 primary forest plots across the Amazon basin was used in the analysis here. The selected areas account for sites where forest parameters and complete soil data was available. Therefore, the following sites have been excluded in this analysis: MAN-03, MAN-04, MAN-05, TAP-04, TIP-05 and CPP-01 did not have forest data available. CAX-06, SUC-03, ELD-34, SCR-04 and CAX-04 had incomplete soil data, and SUM-25
BGD
6, 3993–4057, 2009Effect of soils on forest structure and
dynamics in Amazonia
C. A. Quesada et al.
Title Page
Abstract Introduction
Conclusions References
Tables Figures
◭ ◮
◭ ◮
Back Close
Full Screen / Esc
Printer-friendly Version
Interactive Discussion
2.2 Soil sampling and determination of chemical and physical properties
Soil sampling and determination methods are described in detail in Quesada et al. (2009) and are thus only briefly summarized here.
For each one hectare plot, five to twelve soil cores were collected and soil retained over the depths 0–0.05, 0.05–0.10, 0.10–0.20, 0.20–0.30, 0.30–0.50, 0.50–1.00, 1.00– 5
1.50 and 1.50–2.00 m using an undisturbed soil sampler (Eijkelkamp Agrisearch Equip-ment BV, Giesbeek, The Netherlands).
Each plot usually had one soil pit dug to the depth of 2.0 m with samples collected from the pit walls. All sampling was done following a standard protocol (see http: //www.geog.leeds.ac.uk/projects/rainfor/pages/manualstodownload.html) in such way 10
to account to spatial variability within the plot.
Soil samples were air dried, usually in the field, and then once back in the laboratory had roots, detritus, small rocks and particles over 2 mm removed. Samples were then analysed for: pH in water at 1:2.5, exchangeable cations by the silver-thiourea method (Pleysier and Juo, 1980), complete phosphorus fractionation (modified from Hedley et 15
al., 1982), and carbon and nitrogen (Pella, 1990; Nelson and Sommers, 1996). Here results from the top soil layer (0–0.3 m) are presented.
For quantifying the magnitude of limiting soil physical properties, a score table was developed, and sequential scores assigned to the different levels of physical limitations. This was done by simply scoring a soil going through the field descriptions with the help 20
of the score table (details in Quesada et al., 2009) with this providing information on soil depth, soil structure quality, topography and anoxic conditions in a semi-quantitative format. This data was also combined in two indexes of soil physical quality by adding up the scores of each physical property. Therefore INDEX–1 was created by the adding up of soil depth, structure, topography and anoxic scores, and INDEX–2 by the adding up 25
BGD
6, 3993–4057, 2009Effect of soils on forest structure and
dynamics in Amazonia
C. A. Quesada et al.
Title Page
Abstract Introduction
Conclusions References
Tables Figures
◭ ◮
◭ ◮
Back Close
Full Screen / Esc
Printer-friendly Version
Interactive Discussion and included in the assessment of soil structure scores. Particle size analysis was
performed using the Boyoucos method (Gee and Bauder, 1986).
Available water content (AWC) was determined as a function of potential evapora-tion, depth of root system (as noted from soil pit descriptions) and by an estimation of soil available water content based on the particle size pedotransfer functions given by 5
Hodnett and Tomasella (2002). AWC was integrated to the maximum rooting depth for each area or integrated to four meters were roots were not observed to be constrained in any way. This was then modelled to vary following daily rainfall inputs and losses estimated by potential evaporation, with the time (months) in which less than 20% AWC was attained recorded using standard soil “water bucket” calculations.
10
2.3 Statistical methods
Analyses of ecological processes have usually been done using multiple regressions in which a desired response variable is regressed against sets of environmental vari-ables (see Paoli and Curran, 2007 for a recent relevant example). However, the lack of independence between pairs of observations across geographical space (spatial auto-15
correlation), results in the need for more complex strategies for data analyses (Legen-dre, 1993). This is because spatial autocorrelation generates redundant information on data and overestimation of actual degrees of freedom (Dutilleul, 1993). Therefore, au-tocorrelation in multiple regression residuals results in the underestimation of standard errors of regression coefficients, consequently inflating Type I errors. Thus models that 20
incorporate the spatial structures into model structure or regression residuals should be used to provide unbiased regression coefficients (Diniz-Filho and Bini, 2005).
In this paper eigenvector-based spatial filtering (extracted by Principal Component of Neighbour Matrices: PCNM, Borcard and Legendre, 2002) was thus used to help us understand our observed spatial patterns in forest structure and dynamics. Spatial 25
BGD
6, 3993–4057, 2009Effect of soils on forest structure and
dynamics in Amazonia
C. A. Quesada et al.
Title Page
Abstract Introduction
Conclusions References
Tables Figures
◭ ◮
◭ ◮
Back Close
Full Screen / Esc
Printer-friendly Version
Interactive Discussion interest. Spearman correlations were then adjusted to account for spatial
autocorre-lation, following Dutilleul’s method (Dutilleul, 1993), which adjusts degrees of freedom andpvalues. All spatial statistics were performed using the software Spatial Analysis in Macroecology – SAM (Rangel et al., 2006).
3 Results
5
3.1 Forest structure and dynamics in the geographic space
Figure 1 shows the geographical distribution of tree turnover rates (Fig. 1a); above ground biomass gain (AGB gain, Fig. 1b) and above ground biomass (Fig. 1c). Forest structure and dynamics are remarkably conditioned by spatial location. Tree turnover rates vary substantially across Amazonia, ranging from as little as 0.7 to 4.3% yr−1. 10
Tree turnover rates are systematically higher in the western areas of Amazonia while much lower rates occur in central and eastern sedimentary areas as well as in the north part (Guyana Shield) as has been reported before (Phillips et al., 2004). This geographical pattern is similar to that of AGB gain, which also varies with a similar pat-tern ranging from 2.7 to 10.3 Mg ha−1yr−1, also being noticeably higher in the proximity 15
of the Andean cordillera, intermediary in the Guyana Shield area and lowest in the central and eastern Amazonian areas (Malhi et al., 2004). By contrast, above ground biomass is higher in the east and central areas as well as in the north, but also having an east-west gradient with lower above ground biomass occurring in west and south-west areas of Amazonia (Baker et al., 2004; Malhi et al., 2006). Above ground biomass 20
ranged from 138.6 to 458.1 Mg ha−1 across the basin. Growth and turnover patterns are congruent with the geological history of the area (Irion, 1978) and thus have gen-erated the idea that broad edaphic and geological variations across the region might account for the regional variation in forest structure and dynamics (Stephenson and Van Mantgen, 2005; Malhi et al., 2004; Baker et al., 2004; Phillips et al., 2004). For 25
BGD
6, 3993–4057, 2009Effect of soils on forest structure and
dynamics in Amazonia
C. A. Quesada et al.
Title Page
Abstract Introduction
Conclusions References
Tables Figures
◭ ◮
◭ ◮
Back Close
Full Screen / Esc
Printer-friendly Version
Interactive Discussion Though the relationship is different all three forest properties correlate with latitude
and longitude. Thus spatial structures influence the data, because closely spaced plots are essentially replicate measures of the same conditions. Variations in forest structure and dynamics may also be affected by plant population processes which may have local variation. Moran’sI correlograms in Fig. 2 (Fig. 2c, f and i, for tree turnover, biomass 5
and AGB gain, respectively) demonstrate that all three forest variables are positively spatially autocorrelated, until an approximate distance of 900–1200 km (geographical distance among areas) then becoming negatively autocorrelated at larger distances. This suggests a need to adopt adequate strategies to perform statistical analysis for such data. This is because in such situations the usual statistical protocols such as 10
ordinary multiple least square regressions (OLS) generate autocorrelated residuals, underestimating the uncertainty of regression coefficients and consequently inflating Type I errors. This results in too liberal tests of hypothesis (Legendre, 1993; Diniz-Filho and Bini, 2005).
To account for spatial autocorrelation, eigenvector-based spatial filters (Bocard and 15
Legendre, 2002), were therefore calculated for each of the variables analysed in this study, and then used in a multiple regression framework as additional predictors. This approach, based on principal coordinate analysis of truncated geographical distance matrices provides, in principle, unbiased regression coefficients (Diniz-Filho and Bini, 2005). Following that method, three eigenvector filters were extracted to account for 20
the spatial structures in tree turnover rates, four were selected to correct for spatial autocorrelation in AGB gain, and five for above ground biomass. The selection of eigenvector filters was done according to the framework suggested by Diniz-Filho and Bini (2005). Spatial filters alone explained 44.2% of the variation in tree turnover rates, about 40% of the variation in AGB gain and, remarkably, 72% of the variation in above 25
ground biomass. The application of such spatial filters results in the effective removal of spatial autocorrelation problems from regression residuals as seen in the Moran’s
BGD
6, 3993–4057, 2009Effect of soils on forest structure and
dynamics in Amazonia
C. A. Quesada et al.
Title Page
Abstract Introduction
Conclusions References
Tables Figures
◭ ◮
◭ ◮
Back Close
Full Screen / Esc
Printer-friendly Version
Interactive Discussion
3.2 Relationships between environment and forest stem turnover rates. Effects
of soil fertility, soil physical constraints and climate
In order to investigate relationships between tree turnover rates and environmental factors, spatially adjusted Spearman correlations (Dutilleul, 1993) as described above (Table 1) for a total of 28 predictors. Associated p values and degrees of freedom 5
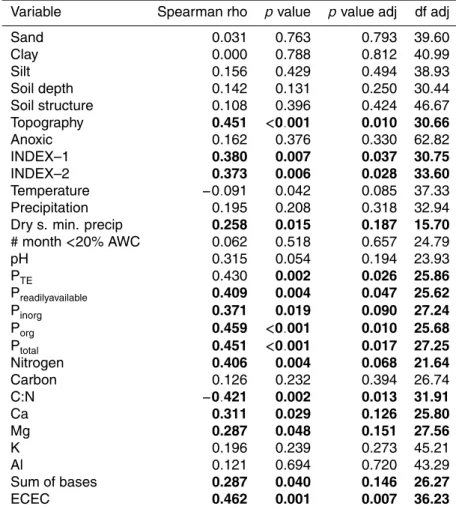
were adjusted to account for spatial autocorrelation. Among the soil fertility predictors, best correlations were with the different soil phosphorus pools (organic, readily avail-able, total extractavail-able, total and inorganicP , in decreasing order of correlation) and exchangeable Ca, Mg and K and also their combined forms sum of bases, SB, and effective cation exchange capacity, ECEC. Soil nitrogen was also relatively well corre-10
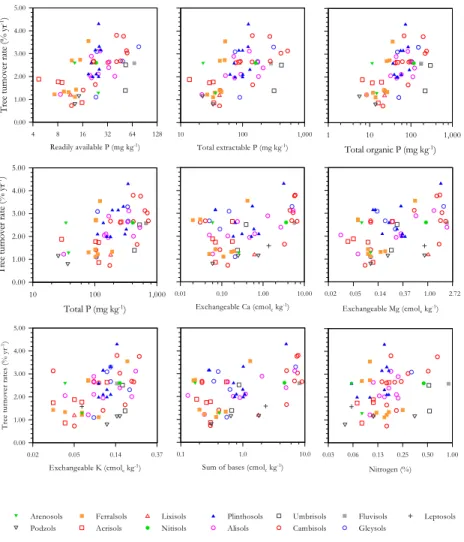
lated to tree turnover rates with soil C:N ratio negatively correlated to it. Relationships between soil fertility parameters and tree turnover rates are graphed in Fig. 3 showing that indeed tree dynamics are strongly associated with soil fertility. This association is also related to gradients in soil type as detailed elsewhere (Quesada et al., 2009). Noting that the validity of ECEC as a fertility indicator is arguable due to the inclusion 15
of aluminium into its calculation, sum of bases (SB) has been taken to represent the a base cation availability and is thus plotted against tree turnover in Fig. 3 instead of the better correlated ECEC, though the latter might, in fact, be a surrogate for soil development (Quesada et al., 20098).
Soil physical properties were also highly correlated to tree turnover rates. Soil struc-20
ture, depth and topography scores provided the best individual correlated factors, while the indexes of soil physical properties INDEX–1 and INDEX–2 were also well corre-lated. Relationships between physical properties and tree turnover rates are graphed in Fig. 4. Soil depth, structure and topography showed a strong relationship with tree turnover rates while no clear pattern could be seem with soil anoxic conditions. The 25
BGD
6, 3993–4057, 2009Effect of soils on forest structure and
dynamics in Amazonia
C. A. Quesada et al.
Title Page
Abstract Introduction
Conclusions References
Tables Figures
◭ ◮
◭ ◮
Back Close
Full Screen / Esc
Printer-friendly Version
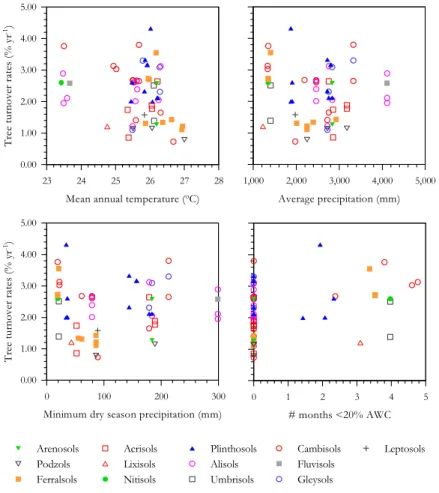
Interactive Discussion turnover rates (Fig. 5) suggests that tree turnover is related to average annual
pre-cipitation and minimum dry season prepre-cipitation for many study sites. Tree turnover rates are generally low in relatively dry areas and higher in the wetter places. How-ever, a small group of sites bearing high tree turnover rates consistently appear as deviants in these relationships, with higher turnover rates in the driest areas. Perhaps 5
these constitute areas where water shortage may influence tree turnover rates. This is best depicted by looking at the relationship between tree turnover rates and the time in which available water content was modelled to fall below 20% (# months<20% AWC). This water stress condition only occurred in a limited number of study sites but these mostly account for the “deviant” group of sites, plus a few others.
10
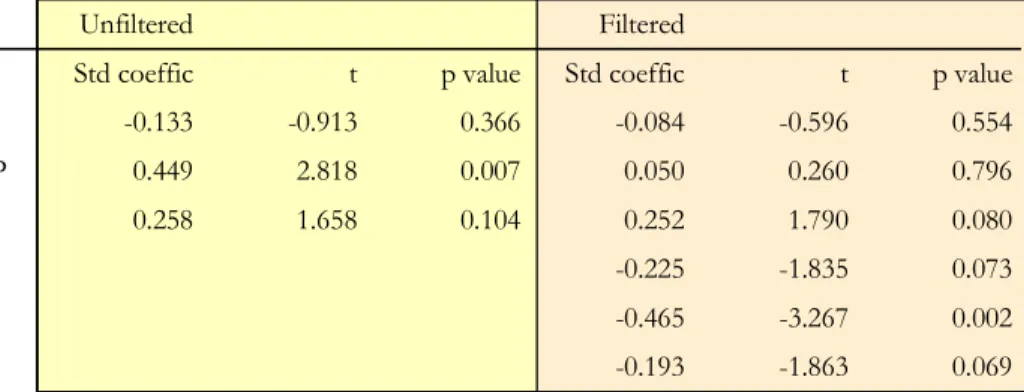
To verify the above ideas, variables were subjected to multiple partial regression analysis with and without the inclusion of spatial filters as predictors. Despite having reasonable correlations, fertility predictors emerged with a limited capacity to explain variations in tree turnover rates. Well correlated variables such as soil C:N ratio, ex-changeable cations and ECEC did not appear as significant in any regression model. 15
The best soil fertility model (Fig. 6a), chosen by maximising modelR2and minimising the Akaike information criterion (AICc), had as predictors; soil nitrogen, sum of bases and readily available phosphorus, left only readily availableP as significant (p<0.01). But once spatial filters were included, phosphorus lost it’s significance but with SB be-coming marginally significant atp<0.1 level. Indeed, the partitioning between purely 20
soil fertility and geographical effects resulted in spatial structures explaining more vari-ation in tree turnover rates than did soil fertility parameters. Space explained 44.2% of the variation while soil predictors explained a total of 32.9%, and both together ex-plained about 49% of the variation in tree turnover rates. Further partitioning for the effect of predictors and space resulted in fertility predictors alone explaining only about 25
BGD
6, 3993–4057, 2009Effect of soils on forest structure and
dynamics in Amazonia
C. A. Quesada et al.
Title Page
Abstract Introduction
Conclusions References
Tables Figures
◭ ◮
◭ ◮
Back Close
Full Screen / Esc
Printer-friendly Version
Interactive Discussion Indeed, as shown in Fig. 6b, soil physical properties have a larger capacity to explain
the observed variation in tree turnover rates, with no soil fertility parameter attaining significance when included in regression models containing soil physical predictors as well. The best model explaining tree turnover rates formed by a mixture of climatic and soil physical properties, with predictors alone explaining 52.2% of the variation 5
in tree turnover rates. This regression model included average annual precipitation, soil structure, topography and time under<20% AWC as predictors and all these vari-ables were significant with confidence intervals varying fromp<0.001 to<0.1 (Fig. 6b). Nevertheless, after inclusion of spatial filters into the regression model only soil struc-ture remained significant (p=0.002). Both environment and space together, explained 10
56.2% of variance in turnover rates, with environment alone explaining 12% of varia-tion and space alone explaining only 4%. The shared variance between space and environment was also the largest term explaining as much as 40% of variance.
However, interactions among physical constraints in soils and environment would be expected to occur and this should increase the tendency of disturbance to increase for-15
est dynamics. One example of this is that the effect of short soil depth and/or deficient structure over tree stability should be stronger when associated to steep topographies. It is thus likely that combined indexes of physical constraints might actually best de-scribe the effect of soil physical properties to influence tree turnover rates. Therefore another regression model was selected, but this time having the (summated) INDEX 20
variables as the soil physical predictor. The regression model yielding the highestR2
and lowest AICc had the variables INDEX–2 (formed by soil depth, structure and to-pography scores) and time under <20% available water content as predictors, with these two variables explaining 49% of the variation in tree turnover (Fig. 6c). Inclu-sion of spatial filters in the regresInclu-sion model did not change the overall result and both 25
variables were significant both before and after the application of corrections for spatial autocorrelation, although time under<20% AWC had its level of significance reduced
fromp<0.001 top=0.057. Both space and environment together explained about 54%
BGD
6, 3993–4057, 2009Effect of soils on forest structure and
dynamics in Amazonia
C. A. Quesada et al.
Title Page
Abstract Introduction
Conclusions References
Tables Figures
◭ ◮
◭ ◮
Back Close
Full Screen / Esc
Printer-friendly Version
Interactive Discussion
3.3 Environmental and edaphic controls over forest biomass growth rates
Spatially adjusted Spearman correlations between forest biomass gain and edaphic and climatic variables are shown in Table 2. From the soil fertility predictors, the best correlations with AGB gain came from the different pools of phosphorus, with correlations decreasing from 0.459 to 0.371 in the order total organicP >totalP >total 5
extractable>readily available>total inorganic, with all correlations remaining significant after adjusting significance for spatial autocorrelation (Table 2). In addition, soil nitro-gen and soil C:N ratio were strongly correlated to AGB gain, with soil exchangeable cations and sum of bases were also relatively well correlated to it. Effective cation exchange capacity was also remarkably well correlated to ABG gain. Relationships 10
between soil fertility parameters and AGB gain are plotted in Fig. 7. Overall there is the strong suggestion of a close relationship between soil phosphorus and growth.
But in contrast to tree turnover rates, soil physical properties had much less of a cor-relation with AGB gain; the only exception being topography. The cor-relationships between soil physical properties and AGB gain are shown in Fig. 8. Soil depth and anoxic condi-15
tions showed little relationship, but soil structure does show a different and interesting behaviour from other physical variables. AGB gain apparently increases slightly with soil structure scores but seems to decline when soil structure becomes more limiting (scores 4).
Of the climatic variables, mean annual temperature showed a relatively weak nega-20
tive correlation with AGB gain, but with variables related to water availability such as average annual precipitation and minimum dry season precipitation having stronger effects (Fig. 9). AGB gain also increases with increasing average annual precipitation, and has some sort of relationship with minimum dry season precipitation, suggesting an effect of both amount and distribution of rainfall in AGB gain. However, a few areas 25
BGD
6, 3993–4057, 2009Effect of soils on forest structure and
dynamics in Amazonia
C. A. Quesada et al.
Title Page
Abstract Introduction
Conclusions References
Tables Figures
◭ ◮
◭ ◮
Back Close
Full Screen / Esc
Printer-friendly Version
Interactive Discussion as water becomes more limiting in the plot of time (months) in which<20% AWC.
Al-most all of these sites occur in the southern fringe of Amazonia, in the transition zone with savannah areas in Bolivia. Their biomass production rates may be controlled by factors other than water and nutrient availability, perhaps being related to disturbance recovery.
5
Variables were then included into multiple regression analysis, with and without the inclusion of spatial filters. Figure 10 shows the result for the best regression model describing AGB gain, including climatic variables and soil fertility parameters. All vari-ables shown were significant in the regression model without spatial correction. As opposed to tree turnover, the inclusion of spatial filters into the regression model did 10
not change the level of significance of edaphic predictors, and so with phosphorus and sum of bases remaining significant at the same levels as in the unfiltered model. Phos-phorus and sum of bases both had the highest regression coefficients both in filtered and unfiltered models. Nevertheless, after correction for spatial autocorrelation, all climatic variables showed changed levels of significance, with average annual precipi-15
tation decreasing fromp<0.001 top=0.063 while mean annual temperature increased the level of significance from p<0.1 to p=0.056. Minimum dry season precipitation which was significant atp<0.001 before spatial filters being added to the model was not significant after spatial correction. The partitioning of effects of environment and spatial structure shows that environment accounted to 52.4% of variation in AGB gain, 20
from whichP alone accounts for about half of the variation. Space explained almost 40% of that variation and environment and space together explained about 61% of the variance in AGB gain. Further partitioning resulted in environmental predictors alone accounting for 20.7% of variation in AGB gain while spatial structures alone explained only 7.9%. The interaction between space and environmental predictors was again 25
BGD
6, 3993–4057, 2009Effect of soils on forest structure and
dynamics in Amazonia
C. A. Quesada et al.
Title Page
Abstract Introduction
Conclusions References
Tables Figures
◭ ◮
◭ ◮
Back Close
Full Screen / Esc
Printer-friendly Version
Interactive Discussion
3.4 Forest above ground biomass
Spearman correlations between above ground biomass and edaphic and climatic vari-ables are listed in Table 3. Forest biomass was generally negatively correlated to soil fertility (Fig. 11), with higher values in the lower fertility regions. The best corre-lations among soil fertility parameters were again with soil phosphorus pools, which 5
varied from ρ=−0.483 to ρ=−0.279, with correlations decreasing in the order read-ily available>total extractable> total organic>total inorganic>total phosphorus. Ex-changeable cations also had strong negative correlations with forest above ground biomass, with exchangeable K and Mg showing the best correlations (ρ=−0.449 and
ρ=−0.308, respectively). Sum of bases was also relatively well correlated to forest 10
above ground biomass (ρ=−0.294). Correlations with both soil phosphorus pools and exchangeable cations remained significant after correction for spatial autocorrelation, with significance levels of exchangeable cations generally increasing after correction. However, ECEC which was well correlated with tree turnover rates and AGB gain showed no relationship with forest biomass.
15
Soil physical properties varied in their ability to correlate with forest biomass. Soil depth and structure were the best correlated factors, with biomass decreasing as depth and structure scores increased (Fig. 12). Topography on the other hand had a weak but positive correlation with forest biomass. Nevertheless, biomass can be seen to decline once topography becomes very steep (scores 4). Anoxic conditions also had 20
a negative but weak correlation with forest biomass, as did both indexes of physical properties. Correlations between physical properties and forest biomass also remained significant after spatial correction with the exception of topography and INDEX–1.
Above ground biomass had stronger correlations with climatic variables than did tree turnover rates or AGB gain, being positively correlated with mean annual temperature, 25
BGD
6, 3993–4057, 2009Effect of soils on forest structure and
dynamics in Amazonia
C. A. Quesada et al.
Title Page
Abstract Introduction
Conclusions References
Tables Figures
◭ ◮
◭ ◮
Back Close
Full Screen / Esc
Printer-friendly Version
Interactive Discussion some response to rainfall amount as well as to its distribution during the dry season.
However, despite strong correlations with both edaphic and climatic variables, mul-tiple regression analysis did not result in significant relationships, especially after the inclusion of spatial filters. For instance, a regression model containing total extractable
P and soil structure resulted in significance at p<0.05, explaining about 26% of vari-5
ance in forest biomass, but once spatial filters were added to the regression model these variables were not significant at all. Actually, spatial filters by themselves explain 72% of variation in above ground biomass. So, when added to any regression model, it is not all that surprising that soil predictors could not explain any fraction of the variation which was not explained by space alone, with the fraction explained by edaphic prop-10
erties being actually due to a bias resulting from the integration of edaphic properties into the spatial structure (Fig. 14).
It turns out, however, that environmental variables which do not have a direct influ-ence on above ground biomass in a Basin wide scale, may still have some indirect influence on it. For instance, Baker et al. (2004) suggested that regional variations 15
in stand wood density could explain a large fraction of the variation in above ground biomass. Average plot wood density varies considerably across Amazonia, and with a remarkable relationship with forest biomass (Fig. 15). This may be related to species composition and their intrinsic genetic characteristics, but a fraction of wood density variations may also be related to resource availability.
20
Looking more closely at this question, average plot wood density is generally nega-tively correlated with soil fertility and physical properties as well as with climatic vari-ables such as average annual precipitation and minimum dry season precipitation (Ta-ble 4). Relationships between average plot wood density and various edaphic pre-dictors are shown in Figs. 16 (soil fertility) and 17 (physical properties). Figure 16 25
BGD
6, 3993–4057, 2009Effect of soils on forest structure and
dynamics in Amazonia
C. A. Quesada et al.
Title Page
Abstract Introduction
Conclusions References
Tables Figures
◭ ◮
◭ ◮
Back Close
Full Screen / Esc
Printer-friendly Version
Interactive Discussion it. The combined indexes of physical properties showed the strongest relationships
with wood density, with INDEX–1 being highly correlated (ρ−0.662). Figure 18 shows that average plot wood density was also related to climatic variables, with a strong re-lationship with mean annual temperature. Average annual precipitation and minimum dry season precipitation also had strong negative relationships suggesting an effect of 5
both amount and distribution of rainfall.
With total extractable phosphorus, sum of bases, INDEX–1 and minimum dry sea-son precipitation selected and used in a multiple regression model (Fig. 19), INDEX–1 emerged as significant (atp<0.001) but all other variables not. This regression model explained 53% of variation in wood density. But after the inclusion of spatial filters into 10
the regression model these results changed dramatically with soil phosphorus, sum of bases and dry season minimum rainfall becoming significant with INDEX–1 not. The inclusion of spatial filters into the model along with the other predictors explained 82% of variation in average plot wood density. Partitioning between the effect of predictors and space resulted in space alone explaining 72% of variation and predictors alone 15
explaining 53%. Further partitioning resulted in predictors alone explaining 10.1% of the variation, space alone explaining 29.1% and both space and predictors together explained an additional 42.9% which accounts for common spatial structures between space and predictors. Figure 19 also includes a Moran’sIcorrelogram for wood density which shows a remarkable level of spatial autocorrelation but with spatial filters being 20
able to effectively remove its effect from regression residuals.
BGD
6, 3993–4057, 2009Effect of soils on forest structure and
dynamics in Amazonia
C. A. Quesada et al.
Title Page
Abstract Introduction
Conclusions References
Tables Figures
◭ ◮
◭ ◮
Back Close
Full Screen / Esc
Printer-friendly Version
Interactive Discussion
4 Discussion
4.1 Accounting for spatial autocorrelation
Environmental data collected over wide areas such as the Amazon Basin are likely to produce a high level of correlated spatial structures. This is of significance, as inclusion of spatial filters into statistical analyses have demonstrated that spatial autocorrelation 5
creates a bias in regression coefficients which inflates tests of hypothesis and thus may eventually change interpretations of ecological processes in question (Diniz-Filho and Bini, 2005). In the study here, the inclusion of spatial filters changed the level of significance of regression predictors, and there should certainly be an overestimation of their capacity to influence response variables if no correction was applied to it. Also, 10
at least two central results of this study may have been completely misjudged if no cor-rection for spatial autocorrelation had been applied; above ground biomass would have been inferred to be significantly affected by soil structure andP availability, whereas no relationship was found with any edaphic variable when spatial filters were applied. Also wood density would have been taken as solely influenced by soil physical properties, 15
but after the removal of spatial structures associated with it, physical properties did not emerge as an important variable at all, but soil fertility and dry season precipita-tion did. Therefore, it is noteworthy that any analysis of forest biomass and/or wood density would be wrong in principle if spatial structures were not taken into account. Geographical space itself explains>70% of their variation.
20
4.2 Tree turnover rates
Results from Sect. 3.2 show that tree turnover rates are strongly correlated to soil fer-tility and soil-landscape physical conditions as well as to climatic variables such as amount and distribution of precipitation. Nevertheless, despite soil fertility parame-ters such as soil P and exchangeable base cations being highly correlated with tree 25
sig-BGD
6, 3993–4057, 2009Effect of soils on forest structure and
dynamics in Amazonia
C. A. Quesada et al.
Title Page
Abstract Introduction
Conclusions References
Tables Figures
◭ ◮
◭ ◮
Back Close
Full Screen / Esc
Printer-friendly Version
Interactive Discussion nificant. Rather, the analysis performed in Sect. 3.2 indicates that tree turnover rates
are controlled mainly by variations in soil physical properties, implying that the actual correlation with soil nutrient availability may be a result of inter-correlations between fertility and soil physical conditions as discussed in Quesada et al. (2009).
Soil physical properties are thus suggested to have a direct influence over distur-5
bance levels and hence turnover rates. For example, the proportion of trees which die standing, uprooted and snapped is related to soil physical properties such as to-pographic position, slope angle, soil depth, soil shear strength, flooding and drought, and to biological effects as herbivory, diseases and pathogens (Gale and Barfod, 1999; Chao et al., 2008). Causes for tree uprooting are predominantly physical, due to bad 10
soil anchorage, short soil depth, steep topography and slope position, storms, wind-blown, and the effect of other fallen trees. On the other hand, standing death is most strongly related to biological agents such as senescence, diseases and competition for resources (Gale and Barfod, 1999; Gale, 2000; Gale and Hall, 2001).
Individual soil physical properties could influence tree turnover in many different 15
ways. For instance, shallow soil depth implies a limited root space which often leads to short and stunted root systems, this most likely having a major influence on plant growth and survival (Schoenholtz et al., 2000; Arshad et al., 1996). This problem is often associated with steep topographies, which can greatly increase the probability of tree death by wind throw (Dietrich et al., 1996). In addition to possible constraints of 20
nutrient supply due to limited rooting depth, hydrological constraints may also occur, either by low drainage capacity or due to low water availability or seasonal drought (Arshad et al., 1996). As well as occurring for young soils such as Leptosols and Cambisols, a shallow effective rooting depth should also occur in many soils which have large and shallow hardpans or soils that have severe structural problems, such 25
BGD
6, 3993–4057, 2009Effect of soils on forest structure and
dynamics in Amazonia
C. A. Quesada et al.
Title Page
Abstract Introduction
Conclusions References
Tables Figures
◭ ◮
◭ ◮
Back Close
Full Screen / Esc
Printer-friendly Version
Interactive Discussion or more than one metre thick; sometimes allowing roots to go through and sometimes
not. The depth of occurrence and the nature of a hardpan are the best determinants of its capacity to limit plant growth (Sombroek, 1966). Nevertheless, soil depth was not significant in multiple regressions, but it may have a strong effect on turnover rates through interactions with other soil properties.
5
Poor soil structure is another important factor affecting tree turnover, expected to lead to problems that are similar to those caused by a limited soil depth because both are physical impediments to root growth. Subsoil structure development occurs in line with the soil weathering process. Thus poor soil structure is generally a feature in soils with low pedogenic status such as Gleysols and Regosols, also occurring in soils with argic 10
horizons such as Alisols, Lixisols and Acrisols as a consequence of increasing clay contents through the profile. Poor soil structure may also result in weak aeration in clay rich soils, particularly when soil is moist, with most of the pore space filled with water (Korning et al., 1994). Structural problems are also strongly related to hydrological constraints and water movement due to its relationship with soil porosity (in especially 15
macro-porosity) which influences water infiltration as well as aeration (Schoenholtz et al., 2000; Arshad et al., 1996). Root proliferation is also highly affected by soil structure and soil bulk density. High bulk density which is characteristic of soils with deficient structure, is often reported to restrict root growth at density values above 1.35 g cm−3 (Van Wambeke, 1992; Arshad et al., 1996) being associated with reductions in the 20
productivity of tree plantations in the tropics (Dedecek et al., 2001; Hirai et al., 2003). Topography is another factor that is closely associated with soil physical constraints as it is highly related to the pedogenetic status of tropical soils. Soils with steep topog-raphy are usually shallow and thus mechanical instability is often a problem for trees. For instance, Gale and Barfod (1999) reported that steep topography was an important 25
Man-BGD
6, 3993–4057, 2009Effect of soils on forest structure and
dynamics in Amazonia
C. A. Quesada et al.
Title Page
Abstract Introduction
Conclusions References
Tables Figures
◭ ◮
◭ ◮
Back Close
Full Screen / Esc
Printer-friendly Version
Interactive Discussion aus region of Brazil (Rocha et al., 2003). Lieberman and Lieberman (1987) reported
that steep slopes may lead to a threshold in tree size above which tree is much more probable to collapse. Such a relationship is thought to explain differences in mortality rates among forests in Costa Rica.
Drainage capacity has two implications. Firstly, badly drained soils may become 5
anoxic, which depending on the severity, could exclude most plant species in areas where it occurs as very few species can cope with such conditions. Seasonally flooded soils are related to high rates of tree uprooting because anaerobic conditions inhibit deep root growth and tree anchorage is limited in hard subsoils (Gale and Barfod, 1999; Gale and Hall, 2001). Gale and Hall (2001) also showed that, in poorly drained 10
soils, young trees tend to die standing, possibly suffering from anoxia, whilst larger trees tend to die uprooted; not having enough anchorage in soft waterlogged soils. On the other hand, excessively drained soils such as white sands (Arenosols) could lead to drought problems in seasonal areas. Soil texture is a less direct but important factor as it interacts with almost all process of physical limitation. Considering soil 15
depth for instance, sandier textures can increase problems of mechanical instability and drastically reduce water holding capacity.
The relationship between tree turnover and amount and distribution of precipitation is a function of regional patterns in rainfall, with more and better distributed precipitation in western Amazonia. As it seems unlikely that more and evenly distributed rainfall 20
would increase tree turnover rates, this correlation is taken here as an indication of regional patterns of rainfall distribution. Specifically, most areas included in this study do not suffer strong water deficits, as the great majority of sites never reach modelled AWC values below 20% (Fig. 5). However, the time (months) in which<20% AWC was attained had some potential to explain tree turnover rates in some specific areas. Soils 25
BGD
6, 3993–4057, 2009Effect of soils on forest structure and
dynamics in Amazonia
C. A. Quesada et al.
Title Page
Abstract Introduction
Conclusions References
Tables Figures
◭ ◮
◭ ◮
Back Close
Full Screen / Esc
Printer-friendly Version
Interactive Discussion dry spells. Nevertheless, results shown here indicate that one cannot exclude water
deficit as a potential driver affecting tree turnover rates, especially in seasonal areas of Amazonia.
On the other hand, there seems to be little influence of anoxic conditions over turnover rates. This may be because only well adapted species tend to occur on 5
severely anoxic soils, such as occur under permanent water saturation. Most species would have limited success in such environments as very few can cope with a limited availability of soil O2. Thus, permanent flooding may have limited impact on turnover as the vegetation formed on such soils consists of well adapted trees. Seasonal flooding or fluctuations of the water table are however more likely to cause stress and mortality 10
in trees (Cannel, 1979). Such conditions affected only a small fraction of the study sites.
Although single physical constraint scores showed an important indication of their relationships with tree turnover rates, it is also the case that only the most extreme conditions are likely to show a significant influence independently. As argued above, 15
interactions among field characteristics are likely to occur which should increase their effect on the tree community. A simple example is that tree mechanical instability caused by steep topography will be made worse by occurring in conjunction with shal-low soil depth. Therefore, physical constraints should be considered jointly to alshal-low for the interaction among such characteristics (Muchena, 1979). An approach to represent 20
the interactions among factors, the INDEX–1, emerged as a good explanatory factor for tree turnover rates. But it was a simplified index model consisting of soil depth, soil structure and topography only (INDEX–2) that best described the influence of physical properties on tree turnover rates.
Indexes of soil quality are a common tool both for agriculture and forestry, usually 25
Rat-BGD
6, 3993–4057, 2009Effect of soils on forest structure and
dynamics in Amazonia
C. A. Quesada et al.
Title Page
Abstract Introduction
Conclusions References
Tables Figures
◭ ◮
◭ ◮
Back Close
Full Screen / Esc
Printer-friendly Version
Interactive Discussion ing for timber production (Storie and Wieslander, 1948). All these systems are based
more or less on the same soil physical constraints thought to result in a harmful en-vironment to plants; aiming to classify lands for agricultural and/or timber production. However, as such a system that could be used for natural rainforest soils is lacking, the indexes shown here could also be used as such an index. Moreover, the simplic-5
ity of the index proposed and the fact it is almost entirely based on soil descriptions may prove to be an advantage as soil physical data is seriously lacking in Amazonia. Nevertheless, extensive soil survey description data is available (i.e. RADAMBRASIL, 1978).
Previous studies of tree turnover rates in Amazonia have resulted in the hypothe-10
sis that soil fertility plays an important role in explaining the almost two-fold difference in stem turnover rates between the western and central-eastern areas of Amazonia (Phillips et al., 2004; Stephenson and Van Mantgen, 2005). However, the results here suggest that this relationship between turnover rates and soil fertility may, to a large degree, be an effect of soil physical constraints. Nevertheless, this does not com-15
pletely rule out a role of soil fertility in influencing turnover rates, as interactions be-tween the effect of soil fertility and soil physical properties may occur. Nevertheless, factors that can cause continuous high abiotic disturbances seem more likely to af-fect stem turnover rate than those related to soil fertility alone. The most likely factors that could explain a soil fertility influence on turnover rates are high levels of competi-20
tion for resources, increased fecundity and subsequent higher mortality due to strong competition; biotic factors such as insect damage, herbivory and plagues which could be higher in more resource abundant areas; perhaps fertility effects on forest floristic composition (pioneers and light demanding taxa) and life cycles (Phillips et al., 2004). From all those possibilities it seems that the competition for resources and the effect of 25
different species composition are likely and should influence on turnover rates.
BGD
6, 3993–4057, 2009Effect of soils on forest structure and
dynamics in Amazonia
C. A. Quesada et al.
Title Page
Abstract Introduction
Conclusions References
Tables Figures
◭ ◮
◭ ◮
Back Close
Full Screen / Esc
Printer-friendly Version
Interactive Discussion tolerant trees (Phillips et al., 2004; Baker et al., 2004). This implies that these forests
have different “life cycles”, western forests being much more dynamic as fast growing species also tend to die young. However, it is quite likely that species composition could also be indirectly affected by soil physical conditions; as adverse soil physical conditions should also favour the dominance of pioneer species with short lifetimes. 5
An example of this process could be the maintenance of light demanding taxa recruit-ment after disturbance events such as induced by a limited rooting depth and steep topography or other combinations of processes. This in turn would affect the turnover rates due to intrinsically higher mortality rates, resulting in a wave like continuum driven both by soil and species composition (Phillips et al., 2004). Thus, soil physical limita-10
tions may short-circuit the successional process by promoting a continued pattern of high disturbance, with forest succession never proceeding towards climax state, unless dramatic changes in the landscape and species composition occur.
Wood density is also another important factor involved in disturbance regime. As discussed already, there is a broad gradient in wood density across the Basin with 15
higher wood density values occurring in infertile soils of central and eastern Amazo-nian areas while the lowest wood density values are found in the more fertile western areas (Baker et al., 2004). Apparently the role of wood density affecting turnover rates can be a function of two interacting factors, these being environmental conditions and stand floristic composition. Firstly, high wood density seems to be part of the slow 20
growth/shade tolerant strategy which would obviously be favoured on soils of little dis-turbance due to soil limitations. Forests with slow growth/shade tolerant strategies need a higher investment in long-term structures to support taller and large and heavy canopies. For water transport in taller trees stronger vessels walls may also be needed to cope with lower tensions. The residence time of such structures must naturally be 25
com-BGD
6, 3993–4057, 2009Effect of soils on forest structure and
dynamics in Amazonia
C. A. Quesada et al.
Title Page
Abstract Introduction
Conclusions References
Tables Figures
◭ ◮
◭ ◮
Back Close
Full Screen / Esc
Printer-friendly Version
Interactive Discussion plete one’s life-cycle. Generally higher fertility levels should fulfil nutrient requirements
for fast growth. This results in a lower level of investment in structure and in a lower residence time as well.
Floristic composition influences wood density as slow growing taxa tend to have higher wood densities while fast growing trees have lighter wood. As there is a gra-5
dient of floristic composition across the Amazon, wood density can be a result of the regional scale of species composition and abundance (Baker et al., 2004). Further-more, similar spatial patterns of wood density across Amazon regions suggest that the differences in stand-level wood density may be caused by ecological factors that regulate the abundance of taxa that share similar values of wood density (Baker et 10
al., 2004). Thus, floristic composition may be intrinsically related to what happens in the soil as well. Thus, Fig. 20 shows how soil physical and chemical conditions might take part in positive feedback mechanisms which would maintain the patterns of slow growth strategy in the eastern and central areas of Amazonia (top) as well as the fast growth – light demanding in the western and southern areas of Amazonia (bottom). 15
The strong relationships between soil physical quality and turnover as well as its co-incident pattern with wood density are therefore interpreted here to suggest that soil physical structure may be a key factor directing the mechanisms that regulate Ama-zon forest floristic composition, wood density and stem turnover rates. Soil physical quality is proposed to initiate a positive feedback mechanism that maintains the pat-20
terns of slow growth – fast growth across Amazonia. In other words, the absence of disturbance coming from soil physical properties is intrinsically a key component in a self-maintaining system (Fig. 20). Where low disturbance leads to shade environ-ments, these together with a limited nutrient supply favour a slow growth strategy. This in turn increases investment in structures to support taller and bigger trees, increasing 25
lev-BGD
6, 3993–4057, 2009Effect of soils on forest structure and
dynamics in Amazonia
C. A. Quesada et al.
Title Page
Abstract Introduction
Conclusions References
Tables Figures
◭ ◮
◭ ◮
Back Close
Full Screen / Esc
Printer-friendly Version
Interactive Discussion els lower down inside the forest. Together with higher nutrient availability, this favours
fast growth with species with a lower investment in structures (low wood density) being favoured. This then reduces mean tree life-times, increasing disturbance frequencies and so on.
Differences in mortality mode and gap formation, themselves related to soils physical 5
properties also support the idea of feedbacks controlling forest growth and dynamics at an Amazon Basin wide scale. For example, gaps from fragmentation of standing dead trees, usual in sites with favourable physical conditions, are usually smaller and formed over a more extended period than gaps formed by uprooted and snapped trees; these being mostly found in association with bad soil physical conditions being larger 10
and produce a more dense layer of debris, resulting in much higher disturbance level (Gale and Barfod, 1999; Carey et al., 1994; Sugden et al., 1985). This is thought to favour low wood density pioneer species (Gale and Hall, 2001), and maybe lianas as well (van der Heijden and Phillips, 2008).
4.3 Forest growth rates: above ground biomass gain
15
Results from Sect. 3.3 point to an effect of soil fertility as the most important factor affecting AGB gain, but with this being also associated with other environmental factors such as amount and distribution of rainfall and soil physical properties. Of all fertility parameters soil phosphorus pools and sum of bases were those best related with AGB gain.
20
Despite being the best correlated variable, soil P pools varied in their relationship with AGB gain. For instance, readily available P (the adding up of resin and bicar-bonateP fractions) which is often referred to as being essentially available for plants (Cross and Schlesinger, 1995; Johnson et al., 2003) was not significant in regression analysis. The ability ofP pools to explain variations in AGB gain increased with the in-25
clusion of more stable, slow turnover forms ofP , with the total extractable and totalP
BGD
6, 3993–4057, 2009Effect of soils on forest structure and
dynamics in Amazonia
C. A. Quesada et al.
Title Page
Abstract Introduction
Conclusions References
Tables Figures
◭ ◮
◭ ◮
Back Close
Full Screen / Esc
Printer-friendly Version
Interactive Discussion forest growth on longer timescales. This is most likely due to a transiting through buffer
pools to the immediately available forms (Tiessen et al., 1984; Hinsinger, 2001), and/or due to the effect of mycorrhizal infections (Alexander, 1989). Mycorrhizal association raise the affinity of infected roots for P in solution lowering its threshold concentration to absorption (Mosse et al., 1973), leading to more desorption of P from the labile 5
pools. Mycorrhizal association can also releaseP phosphorus that is adsorbed by iron oxides and otherwise unavailable to plant roots (Alexander, 1989). In agreement with results reported here, Kitayama et al. (2000), showed that total extractableP (total – residual) was a better estimate of P availability for plants in Borneo. As discussed in detail in Quesada et al. (2009), there is also evidence that more stableP fractions 10
such as organic, hydroxide and hydrochloric forms may become available for plants whenP is in relatively short supply (Adepetu and Corey, 1976; Tiessen et al., 1984; Gahoonia et al., 1992; Sattell and Morris, 1992; Hedley et al., 1994; Saleque and Kirk, 1995; Magid et al., 1996; Hinsinger and Gilkes, 1996; Trolove et al., 1996; Zoysa et al., 1997, 1998, 1999; Guo and Yost, 1998; Bertrand et al., 1999; Frossard et al., 2000). 15
An important implication of this result is that the true importance ofP may have been underestimated as most studies of soil fertility have usually only taken into account the immediately availableP in the soil solution. (e.g. Chambers and Silver, 2004)
Soil phosphorus has been considered the most likely nutrient to limit forest produc-tivity (Vitousek, 1982, 1984, 2004; Cuevas and Medina, 1986; Vitousek and Sanford, 20
1986; Silver, 1994; Reich et al., 1995; MacGrath et al., 2001; Paoli and Curran, 2007) and a limitation of tropical forest productivity by phosphorus is conceptually attractive. This is becauseP is almost exclusively supplied by parent material and tropical forest soils are often of considerable age as outlines elsewhere (Quesada, 2009). In addition, the evolution of soils during weathering tends to reduce plant availableP pools either 25
by parent material weathering and leaching and/or modification to the chemical state of both organic and inorganicP towards non available forms as theP occluded by Fe and Al oxides (Walker and Syers, 1976). Also, becauseP is essential for high energy
BGD
6, 3993–4057, 2009Effect of soils on forest structure and
dynamics in Amazonia
C. A. Quesada et al.
Title Page
Abstract Introduction
Conclusions References
Tables Figures
◭ ◮
◭ ◮
Back Close
Full Screen / Esc
Printer-friendly Version
Interactive Discussion in photosynthesis and thus community level primary production (Raaimakers et al.,
1995; Crews et al., 1995; Herbert and Fownes, 1995; Raich et al., 1996; Kitayma et al., 2004).
Indeed, for the majority of lowland tropical forests studied so far, soil P has been considered the most likely limiting factor for primary production. For instance, Paoli and 5
Curran (2007) showed that basal area and biomass growth and forest NPP (defined as litterfall+biomass growth) showed a strong positive relationship with soil nutrients, particularly with OlsenP (bicarbonate extractedP) in Borneo. Litterfall production was also positively related to OlsenP and sum of bases. They concluded that soilP supply was the main driver of spatial variation of NPP in their study area.
10
Physical properties were relatively well correlated with AGB gain but had much lower capacity than soil fertility to explain the variations observed. The one exception was topography scores which had a reasonable relationship with AGB gain. This may re-flect a positive influence of topography on forest growth as crow illumination may be favoured on slopes. In addition, continuous erosion processes may aid the mainte-15
nance of mineral nutrient inputs bringing less weathered soil layers to the proximity of soil surface and thus within the reach of nutrient absorbing roots.
Although appearing contradictory at first, it is also possible that harsh soil physical properties could lead to faster rates of forest growth. As discussed in Sect. 4.2, a harsh soil environment is likely to increase forest dynamics (tree turnover rates) and through 20
this, a change the structure of the forest giving rise to more open physiognomies, with more available light interception than for more “stable” forests with tall, closed canopies. Also, disturbance may short-circuit vegetation succession and favour the dominance of pioneer species over late successional ones. Thus higher growth rates typical of light wooded, light demanding pioneer species may dominate. Therefore, despite that 25
BGD
6, 3993–4057, 2009Effect of soils on forest structure and
dynamics in Amazonia
C. A. Quesada et al.
Title Page
Abstract Introduction
Conclusions References
Tables Figures
◭ ◮
◭ ◮
Back Close
Full Screen / Esc
Printer-friendly Version
Interactive Discussion most fertile areas of Amazonia.
On the other hand, low disturbance levels seems to be intrinsically related to favourable soil physical properties, which is also associated to low fertility. These con-ditions lead to the dominance of late successional shade tolerant species, in which slow growth strategies dominate. Such contrasting but characteristic conditions occur-5
ring between soils with different pedogenic development may thus be integrated into the positive feedback mechanisms described in the above section.
4.4 Above ground biomass
Basin wide variations in forest biomass across Amazonia were negatively correlated with soil fertility and physical properties. In broad terms, above ground biomass is 10
lower in areas having fertile soils with low pedogenic development and having a higher incidence of physical constraints. And by corollary, higher in infertile areas, with more developed soils and better physical conditions. Nevertheless, despite being well corre-lated with individual soil and climate variables, forest biomass did not show significant relationships with soil or climate conditions once corrections for spatial autocorrelation 15
were applied. But we also note that forest above ground biomass seems not directly influenced by edaphic conditions, unless the most extreme cases of low fertility and/or extremely bad physical environment are encountered (Vitousek and Sanford, 1986). On the other hand, average plot wood density is a prime factor determining variations of above ground biomass (Baker et al., 2004; Malhi et al., 2006), and variations in 20
species composition and relative abundance across Amazonia have been shown to account for a large fraction of wood density variations (Baker et al., 2004). Results shown here suggest that average plot wood density is significantly related to soil fer-tility, in accord with previous results from Muller-Landau (2004), who found negative correlations between wood density and estimated soil fertility among tropical forests in 25