248 C.P. Rezende et al.
Influence of Drying on the Characteristics of Zinc Oxide Nanoparticles
C.P. Rezende1, J.B. da Silva1,2, N.D.S. Mohallem1∗
1Laborat´orio de Materiais Nanoestruturados, Departamento de Qu´ımica, ICEx UFMG and
2Centro de Desenvolvimento da Tecnologia Nuclear – CDTN/CNEN 31270-901 Belo Horizonte-MG, Brazil
(Received on 1 July, 2008)
The recent growth in the field of porous and nanometric materials prepared by non-conventional processes has stimulated the search of new applications of ZnO nanoparticulate. Zinc oxide is an interesting semiconductor material due to its application on solar cells, gas sensors, ceramics, catalysts, cosmetics and varistors. In this work, the precipitation method was used followed by controlled and freezing drying processes. The materials obtained were thermally treated at various temperatures. The influence of temperature on structural, textural, and morphological properties of the materials was studied by powder X-ray diffraction, infrared spectroscopy, scanning electron microscopy, nitrogen adsorption, and thermal analysis. The characteristics of both materials were compared.
Keywords: zinc oxide, drying process, nanoparticle
I. INTRODUCTION
Zinc oxide is a versatile material due to properties such as: pyroelectricity, semiconducting, piezoelectricity, lumi-nescence, and catalytic activity[1−2]. Its optical band gap, chemical and thermal stabilities are also very important char-acteristic. These properties are essential for electronic and photonic industry due to the wide range of technological applications in devices including acoustic surface, wave fil-ters, sensors, transparent conductors, light-emitting diodes, laser diodes, solar energy conversion[3−5], electro-acoustic transducers, photovoltaic devices, catalysts and varistors [6−8]. Zinc oxide powders are also a commercially impor-tant material utilized in paints and rubber[9].
The properties of ZnO depend mainly of the crystallite size and morphology [10]. With the objective to prepare ZnO nanostructures with desire properties, some methods are used, such as the sol-gel process[11], hydrothermal route, chemi-cal vapor deposition, homogeneous precipitation and electro-deposition. Farley et al produced ZnO from zinc acetate as precursor, getting a high quality semiconductor oxide for var-ious technical applications [12]. The hydrothermal process was used to obtain different structures of ZnO [13]. ZnO nanoparticulate was prepared by solid state reaction at low temperature of calcination (500oC) through thermal decom-position,[14]. The evolution of the microstructure during the formation of ZnO powder particles obtained by the freeze-drying method was investigated by Marinkovic et al [15]. These syntheses allowed to the preparation of ZnO with a variety of morphologies, including nanoparticles, nanowire, nanorod, nanoribbon, nanoplate, nanotube, multipods, etc [16−18].
In this work the precipitation process was used to ob-tain ZnO particles by reaction between aqueous solutions of Zn(NO3)2and Na2CO3. The textural, microstructural, and
morphological characteristics were investigated to establish the correlation between the powder characteristics with the drying type and the calcination temperature.
∗Electronic address:[email protected]
II. EXPERIMENTAL
Zinc nitrate and sodium carbonate were used as precursors of the ZnO particles. In a typical synthesis, Zn(NO3)2.6H2O
were dissolved in deionized water in the molar ratio of 1:5, and mixed for homogenization during 1 h. Na2CO3were also
dissolved in deionized water in the molar ratio of 7:10, and mixing with the zinc solution leading to the formation of a white precipitate. The precipitate was washed with deionized water to remove impurities. The obtained powder was sepa-rated in two aliquots to be submitted to drying processes. One aliquot(S1)was dried in an oven at 110oC for 48 h and the other(S2)was immersed in liquid nitrogen to freezing and then was lyophilized by 78 h at -40 oC and vacuum of 0.7 Pa. Both the aliquots were calcined at different temperatures between 200 and 1000oC for 2 hours.
Simultaneous thermogravimetric and differential ther-mal analysis (T G−DTA) measurements were performed (TAInstrumentSDT2960). The samples were heated from room temperature up to 1100oC at 10oC.min−1under airflow. All samples were analyzed by X-ray diffractometry (Rigaku,Geiger f lex3034)with CuKαradiation, 40 kV and 30 mA, time constant of 0.5 s and crystal graphite monochro-mator. Crystallite size was determined by Scherrer equation (D = 0.9λ/βcosθ, where D is the crystallite diameter,λis the radiation wavelength and θ the incidence angle) [17]. The value of β was determined from the experimental integral peak width with silicon as a standard. Values were corrected for instrumental broadening.
Brazilian Journal of Physics, vol. 39, no. 1A, April, 2009 249
true density in g cm−3.
III. RESULTS AND DISCUSSION
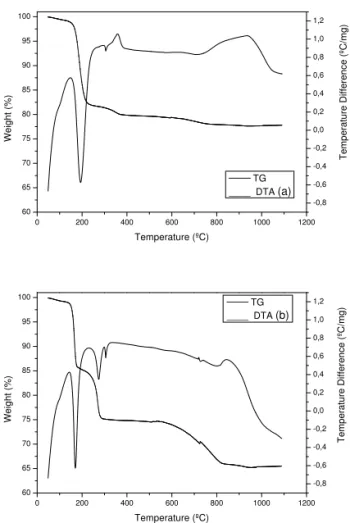
TG curve for the S1 sample (Fig.1a)shows three stages of weigh loss accompanied by two endothermic and two exothermic peaks in DTA curve. The first endothermic event between 100 and 200oC can be associated to removal of sur-face water of the sample with weight loss of 18%. The weight lost of 2% in the range of 210-380oC, accompanied by one en-dothermic and one exothermic peak, and of 2 % in the range of 410-800oC is due to the nitrate and CO
3 decomposition.
The broad and intense exothermic peak could be associated with the formation of the pure ZnO phase. The obtained residue is around 78% (pure ZnO phase).
0 200 400 600 800 1000 1200
60 65 70 75 80 85 90 95 100 T e mp e ra tu re D if fe re n c e ( ºC /mg ) W e ig h t (% ) Temperature (ºC) TG ____ DTA (a)
-0,8 -0,6 -0,4 -0,2 0,0 0,2 0,4 0,6 0,8 1,0 1,2
0 200 400 600 800 1000 1200
60 65 70 75 80 85 90 95 100 W e ig h t (% ) Temperature (ºC) TG ____ DTA (b)
-0,8 -0,6 -0,4 -0,2 0,0 0,2 0,4 0,6 0,8 1,0 1,2 T e mp e ra tu re D if fe re n c e ( ºC /mg )
FIG. 1: TG/DTA curves of ZnO previously dried at 110oC, (a) con-trolled and (b) freeze drying.
The S2 sample(Fig.1b)lost 14% weight in the range of 50-180oC due to surface water removal related to an endothermic event. The other two endothermic events between 180-250oC and 580-820oC were attributed to loss of sodium nitrate (11 %) and carbon dioxide (10 %). These events are accompanied by endothermic peaks in DTA curves. A broad exothermic event appears between 800 and 930oC, probably due to the formation of the pure ZnO phase. In this case, the residue obtained is around 65 %. We can describe the ZnO formation
with the reaction below:
Zn(NO3)2.6H2O+Na2CO3→ZnCO3+2NaNO3+6H2O
ZnCO3→ZnO+CO2↑
Figures 2a and 2b show XRD patterns of S1 and S2 sam-ples calcined at various temperatures. The characteristic peaks of the ZnO phase increase in intensity above 200oC with the calcination temperature. The S1 sample presented peaks characteristics of ZnO phase at 200oC and by-products such as NaNO3and ZnCO3(4 %), which decomposed
grad-ually with increasing in the temperature. The pure phase of ZnO was formed below 800oC.
The S2 sample shows peaks of ZnO phase with 21% of by-products such as ZnCO3and NaNO3between 200 and 600oC,
which decomposed with the increase in the temperature, orig-inating pure phase of ZnO above 800oC.
70 60 50 40 30 20 10
x
oo o
o o
o
o o
1000o
C
800oC
600oC
400oC
200o C In te n s it y ( a . u .)
2 θ (degrees)
(a)
70 60 50 40 30 20 10
vv x v v x x
oo o
o o o oo 1000o C 800o C 600o C 400o C
200oC
In te n s it y ( a . u .)
2 θ (degrees)
(b)
FIG. 2: X-ray diffraction patterns of o = ZnO, x = NaNO3 and
v = ZnCO3 powders treated at different temperatures a) prepared
by controlled drying (S1) and b) prepared by freeze drying (S2).
Figure 3 shows infrared spectra of the ZnO samples (S1 and S2) treated at various temperatures. The spectra show bands (3500 cm−1) assigned to OH−stretching vibrations of crystalline and adsorbed H2O. Two bands were observed at
1512 and 1365 cm−1, corresponding toν3frequency of
car-bonate groups (C – O and C = O). In the spectra of S1 sam-ple, these bands disappear after treatment at 600oC and in S2 spectra only after 800oC. Bands at 1050 cm−1, 835 cm−1and
250 C.P. Rezende et al.
appear in S1 spectra only for treatment at 110oC and in S2 spectra until treatment at 800oC. Bands with small intensity characteristics of nitrate groups appear at 1630 cm−1. These bands disappear only above heating at 800oC. The S1 spectra show a broad band between 550 and 465 cm−1 with shoul-der shape, characteristic of hexagonal Zn-O phase. With the increasing in the calcination temperature, the shoulder shape changes and a unique broad band is formed. The S2 spectra also show a broad band, without the shoulder shape, more in-tense than the S1 sample ones. According to literature[18], the shape of the IR bands can be due to the geometry and size of the particles, and/or the aggregate formation.
4000 3500 3000 2500 2000 1500 1000 500
3500 1000ºC
800ºC
600ºC
400ºC
200ºC
110ºC
Wavenumber (cm-1
)
T
ra
n
s
m
it
ta
n
c
e
(
a
.
u
.)
(a)
1512 1365 835 465
4000 3500 3000 2500 2000 1500 1000 500
T
ra
n
s
m
it
ta
n
c
e
(
a
.
u
.)
1000ºC
800ºC
600ºC
400ºC
200ºC
110ºC
Wavenumber (cm-1) 1515
3500 1370
1050835 750 305 1625
447 457
(b)
FIG. 3: Infrared spectra of ZnO powders treated at different tem-peratures a) prepared by controlled drying (S1) and b) prepared by freeze drying (S2).
The IR spectra show that the S2 sample has more impu-rities than the S1 sample, according to XRD patterns and TG/DTA curves, confirming the difference between the pow-ders produced in both the process.
Figure 4 shows the morphology of the ZnO. The images obtained by SEM of the S1 samples treated at 110oC(Fig4a) show plate-like nanoparticles forming agglomerates. After treatment at 800oC, these particles (Fig.4b)grow and den-sify, reaching an average particle size of 0.550±0.050µm. The S2 images (Fig. 4c) also shows plate-like nanoparticles, which grow after treatment at 800oC (Fig.4d), reaching an average particle size of 1.1±0.1µm. The samples showed significant morphological differences.
Table 1 shows the textural characteristics of ZnO samples
a
c
b
d
FIG. 4: Images of ZnO powders treated at different temperatures a) S1 - 100oC, b) S1 - 800oC, c) S2 - 100oC and d) S2 - 800oC.
± μ
± μ
Table 1 – Textural and morphological characteristics of the ZnO nanoparticles.
Temperature (ºC)
SSA
(m2 g-1)
True Density
(g.cm-3)
Total pore volume
(10-3 cm-3 g-1)
Average particle size (nm)
Average crystallite
size by XRD(nm)
Controlled drying
110 39.1 3.8 48 40 12
200 27.2 3.9 35 57 29
400 17.1 4.2 23 84 35
600 7.2 4.5 10 185 45
800 2.1 4.8 2 595 64
Freeze drying
As-prepared 20.1 2.5 31 119 46
200 7.2 3.0 8 278 35
400 2.0 3.3 1 909 66
600 1.5 3.8 2 1051 82
800 1.0 5.0 2 1200 91
Brazilian Journal of Physics, vol. 39, no. 1A, April, 2009 251
0,0 0,2 0,4 0,6 0,8 1,0
0 5 10 15 20 25 30 35
(a)
(b)
(c)
(d)
P/P0
(e)
V
ol
um
e(
c
c
g
-1 )
(f)
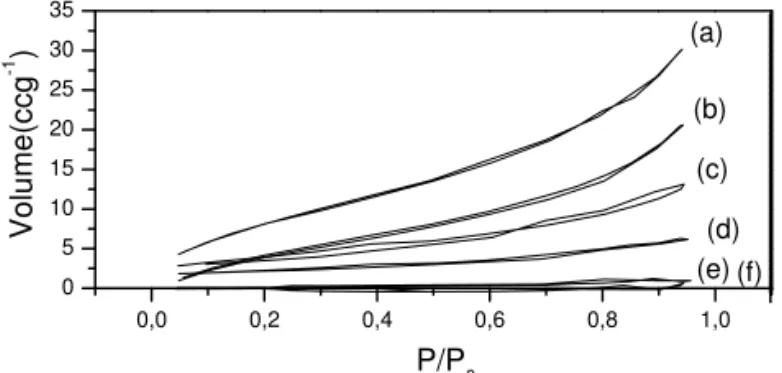
FIG. 5: Adsorption-desorption isotherms of ZnO nanoparticles (Sl) treated at different temperatures: (a)110oC, (b) 200oC, (c) 400oC,
(d) 600oC, (e) 800oC and f) 1000oC.
The freeze drying materials showed irregular isotherm curves (not shown), with C constant negative, characteristic of small interaction of the nitrogen with the material. We ob-served that the nitrogen did not wet the ZnO surface, showing
that this kind of drying change significantly the surface sam-ple, confirming the IR results.
IV. CONCLUSION
The as-prepared zinc oxide obtained by controlled tem-perature(S1)was more pure than ZnO powder obtained by freeze drying(S2). These impurities were eliminated with the increasing in the calcination temperature but influenced dras-tically the morphological and textural characteristics of the fi-nal product. All the samples calcined at 800oC had the same structure but with different particle size and surface charac-teristic.
V. ACKNOWLEDGEMENT
This work was supported by CNPq and CAPES.
[1] Y. Ni, X. Cao, G.Wu, G.Hu, Z. Yang and X. Wei, Nanotech-nology, 18, 1 (2007).
[2] K. M Parida; S. S. Dash and D. P. Dash, Journal of Colloid and Interface Science, 298, 787 (2006).
[3] H. Cheng, J. Cheng, Y. Zhang and Q. Wang, Journal of Crystal Growth, 299, 34 (2007).
[4] S. Dutta, S. Chattopadhyay and D. Jana, Journal of Applied Physics, 100, 114328 (2006).
[5] L. Schmidt-Mende. and J. MacManus-Driscoll, J., Materials Today, 10, n.5, 40 (2007).
[6] M. Zunic, Z. Brankovic, S. Bernik, M. S. G´oes and G. Brankovic, Journal of the European Ceramic Society, 27, 3897(2007).
[7] E.M. El-Melinegy, H.I Saleh,. and M. Selim, Materials Char-acterization,.52, 371 (2004).
[8] M. Jitianu and A. V Goia, Journal of Colloid and Interface Sci-ence, 309, 78 (2007).
[9] G. S. Brady, H. R. Clauser and J. A Vaccari, Materials Hand-book, Fourteenth Edition, Mc Graw-Hill, (1997).
[10] S. Music, D. Dragcevic; S. Popovic, Journal of Alloys and Compounds, 429, 242 (2007).
[11] Y.P. Gao, C. N. Sisk and L. J. Hope-Weeks, Chemistry of Ma-terials, 19, 6007 (2007).
[12] N. R. S. Farley, C. R. Staddon et al, J. of Materials Chemistry, 14, 1087 (2004).
[13] Y. S. Fu, X. Du, J. Sun, Y. Song and J. Liu, J. Phys. Chem. C, 111, 3863 (2007).
[14] H. Zhang; G. Cheng, G. Yang, J. Zhang and X. Lu, J. Mater Sci: Mater Electron, 18, 381 (2007).
[15] Z.V.Marinkovic, O Milosevic et al, Materials Science and En-gineering A, 375, 620 (2004).
[16] Z.L. Wang, Journal of Physics Condensed Mater, 16, R829 (2004).
[17] R. Jenkins and R. L.Snyder, Introduction to X-Ray Powder Diffractometry in Chemical Analysis, 138, John Wiley & Sons, Inc
(1996).
[18] S. Music, A.Saric and S. Popovic, Journal of Alloys and Com-pounds, 448, 277 (2008).