*e-mail: [email protected], [email protected]
1. Introduction
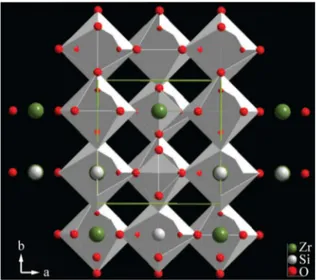
Electronic and vibrational properties of nanometric doped zirconium silicate (ZrSiO4) are of considerable interest because of the large number of applications of this compound. ZrSiO4, commonly called zircon is widely used in the ceramic, foundry and refractory industries, Zircon adopts a garnet-related structure (Figure 1) having lattice parameters a = 6.607(1) Å; c = 5.982(1) Å, Z = 4[1-3]. The zircon structure can be described as built of chains of alternating edge-sharing SiO4 tetrahedra and ZrO8 triangular dodecahedra extending parallel to the c-axis, which are joined laterally by edge-sharing dodecahedra4-6. This oxide exhibits low thermal expansion7, low thermal conductivity, and high resistance to thermal shock7, as well as good corrosion resistance (for example, against glass melts, slag and liquid metal alloys). Furthermore, a large variety of transition and/or rare-earth metal cations can be incorporated into the host lattice. It is for this reason that zircon is often considered as a natural host material for the storage of radioactive waste material8-11. ZrSiO4 is also considered as a promising alternative to silicon oxide as the gate dielectric material in metal-oxide semiconductor devices because of its high permittivity12.
For Fe doped-ZrSiO4 compound, it is vital interest to
gain a fundamental understanding of the inluence of size and
shape morphology; aggregation of several particles leading to defects in the structure of particles and improvement of crystallinity, which mediate the oxygen ion transport, on the functional properties. In the last decade, several authors have studied different topics referred to the structural and chemical characteristics of Fe-ZrSiO4[10-24]. The mechanism of formation, the chemical state, and location of Fe cation
in the zircon structure, the actual presence of segregated hematite and dissociation of zircon25-27 have been considered as main topics. In this context, our work over the last few years has been to develop Fe-containing zircon solid solution materials from free-mineralizer precursors with new potential applications, as for instance in electrocatalytic processes28,29.
Nasdala et al.30-33 have introduced Raman spectroscopy as a method to estimate quantitatively the degree of radiation
damage in zircon. In particular, the peak proile of Raman ν3 (SiO4) band at approximately 1,000 cm–1 has been used to predict the thermal history of zircon, and this one quantiies
the degree of short order around the fourfold Si sites. Nasdala et al.34 used the width to estimate the possible thermal history of natural zircons, whereas Geisler et al.35 proposed the use of both the width and frequency to trace potential thermal alterations. They showed that Raman spectra clearly
shift towards lower wavenumbers and broaden, which relects
the loss of short-range order and the general expansion of the lattice. The FWHM (full width at half maximum) of the
internal ν3 mode was found to increase most sensitively with increasing radiation damage. It increases from 2 cm–1 for well-crystallized (i.e., undamaged) to well above 30 cm–1 for strongly radiation-damaged zircon.
Based on these facts, the motivation of the present work is to investigate and demonstrate that the increase of Fe content in ZrSiO4 prepared by the sol-gel technique plays an important role over size effects during the heat treatments
and it has an important inluence on the intensity, shift symmetry and bandwidth of the Raman results. The irst
goal was to prepare a series of Fex–ZrSiO4 solid solutions from free-mineralizer precursors with increasing content of Fe. The gels were annealed at 1100 °C during 3h, 1200 °C
Iron Doped-ZrSiO
4: Structural, Microstructural and Vibrational Characterization
Guillermo Manuel Herrera-Péreza,b*
aConsejo Nacional de Ciencia y Tecnología – CONACYT, Centro de Investigación en Materiales Avanzados – CIMAV, Miguel de Cervantes 120, Chihuahua 31109, Chihuahua, Mexico bDepartamento de Química Inorgánica, Universitat de Valencia, 46100 Burjassot, Valencia, España
Received: August 13, 2015; Revised: October 1, 2015
Fex-ZrSiO4 is known for the applications in the ceramic industry such as ceramic pigment. In this article, we focus our attention to the structural, microstructural and vibrational changes of Fex-ZrSiO4 from free-mineralizer precursors, treated at different temperatures in the range of 1100-1600 °C.
The reinements of X-ray diffraction patterns show that Fe3+ cations were distributed into tetrahedral sites replacing Si4+. The evolution of the shape distribution analyzed by transmission electron microscopy, reveal a polyhedral morphology at 1100 °C during 3h. In comparison, well-rounded and homogeneous particle size was determined in the sample heated at 1600 °C during 24 h. On the other hand, it was observed that increase the content of iron and the increased heat treatment (temperature and time) both
plays an important effect on the observed Raman results. The proile line deconvolution applied through the ν3 vibration of the SiO4 group shows a spectral change similar to that seen in radiation-damaged zircon: a decrease in frequency and increase in bandwidth.
during 3 h and 1600 °C during 24 h. The last temperature
and holding time was selected to improve the densiication
of the material. Our second purpose was to estimate the solubility limit of iron in the zircon structure (in particular in the sample heated at 1600 °C) and compare and elucidate
the crystal parameters of the samples by the X-ray diffraction (XRD) Rietveld reinements. The particle size evolution
was monitored by transmission electron microscopy (TEM) as the Fe concentration increased. In the third goal, the Raman investigations are motivated by the close relation between the asymmetric broadening of Raman peaks with the crystal-chemical effects such as the tetrahedral distortion
determined by the XRD Rietveld reinements.
2. Experimental Procedure
2.1. Samples preparation
Gels with stoichiometry, FeX–ZrSiO4, where x = 0, 0.02, 0.05, 0.07, 0.1 and 0.125 were prepared by the sol–gel liquid phase route, using zirconium n-propoxide (ZnP, Zr(OC3H7)4) tetraethylorthosilicate (TEOS, Si(OC2H5)4) and iron acetylacetonate (Fe(AcAc)3, FeC15H24O6), as sources for Zr, Si and Fe, respectively. Details of synthesis and structure analysis can be found elsewhere36,37.
2.2. Characterization techniques
X-ray powder diffraction analysis (Model AXS D5005
Bruker) was performed using a graphite monochromatic
CuKα radiation. The diffractograms were run with a step size of 0.02° 2θ and a counting time of 10 sec. Lattice
constants and other structural parameters of zircon phase
were determined by reinement with the Rietveld technique
using Fullprof98[38] available in the software package Winplotr39. The Rietveld reinement involved the following parameters: scale factor; zero displacement correction; unit
cell parameters; peak proile parameters using a
pseudo-Voigt function; and overall temperature factor. The starting structural parameters and atomic positions of tetragonal zirconia[40], monoclinic zirconia41, hematite42 and of zircon-type crystal structure7-9, were taken from the literature. They were also reined and plotted with Diamond 3.2143 as shown in Figure 1. The morphology of iron-containing zirconia and zircon particles was also examined using transmission
electron microscopy (Model 1010, Jeol Ltd., Tokyo, Japan)
at an accelerating voltage of 100 kV. Samples were crushed and dispersed in absolute ethyl alcohol and drops of the dispersion were transferred to a specimen copper grid
carrying a lacey carbon ilm. Particle size analyses were
carried out by using the Image J software44. The Raman spectra were recorder with spectral windows of 3500-100 cm–1 in a high performance dispersive Raman Jasco NRS-3100 spectrometer. A L1200/B500 nm grating dispersed
the radiation onto a TE-cooled CCD detector. The spectra were excited with a 632.8 nm radiation from a He-Ne ion laser. The laser beam was focused on the sample with an
acquisition time of 10 sec. Proile line deconvolution was
performed following the approach as described by Presser & Glotzbach45. For the undoped sample we determined the true Raman bandwidth to be 3.3 ± 0.1 cm−1. This value falls within the range of the reported values by Presser & Glotzbach45 and Gucsik et al.46.
3. Results and Discussion
3.1. X-ray powder diffraction and the Rietveld
reinement
The irst step of this study was to characterize the thermal
stability of Fex-ZrSiO4 reactions up to 1600 °C. Figure 2 shows
the evolution of X-ray diffraction results for the powders of
Fe0.1-ZrSiO4 heated at different temperatures. In panel (a) one can observe an important contribution of tetragonal zirconia (t-ZrO2), hematite and zircon phases on the sample heated at
Figure 1. A schematic representation of garnet-type crystal structure of ZrSiO4. The chains of alternating edge-sharing SiO4 tetrahedra
and ZrO8 dodecahedra projected on (001) and showing the edge
sharing between dodecahedra. This representation was obtained by CIF ile of Fullprof and it was plotted by Diamond 3.21 software.
Figure 2. (a) X-ray powder diffraction data for the sample with
Fe0.1-ZrSiO4 heated at 1100 °C during 3 h (♦ is tetragonal ZrO2).
(b) XRD data for the same composition heated at 1200 °C during 3 h (* is hematite). (c) Rietveld reined X-ray diffraction pattern for the sample with Fe0.1-ZrSiO4 powders obtained after the heat
1100 °C during 3 h. The XRD pattern obtained at 1200 °C during 3 h shows the decrease in the intensity of the relections
attributed to the t-ZrO2; the hematite phase still remains and it is indicated by an asterisk in panel (b). Panel (c) shows the
XRD for the sample obtained at 1600 °C during 24 h. In this XRD pattern, one can observe the Rietveld reinement proile, the residual proile and the vertical lines (Bragg positions)
related to zircon. According to Alahakoon et al.26, the presence of monoclinic zirconia (m-ZrO2) indicates that zircon is slightly dissociated at this time and temperature25. At this stage, the relection due to t-ZrO2 disappearing, conirms the theory that zircon is formed from amorphous silica and m-ZrO2[26]. Furthermore, at this stage, relatively sharp relections of hematite crystal phase are resolved in XRD. The detailed structural parameters and goodness of it between the observed and calculated proiles at selected temperatures are given in
Table 1. One can observe from the Rietveld reinement results that a small portion of Fe crystallizes as hematite.
As suggested by Ocaña et al.47,48 iron must play some role as catalyzer in the zircon formation. Thus, the complete formation of zircon takes place over the range of temperatures between around 1100 °C and 1600 °C depending on the nominal amount
of iron. The Rietveld reinements of XRD patterns allowed us to
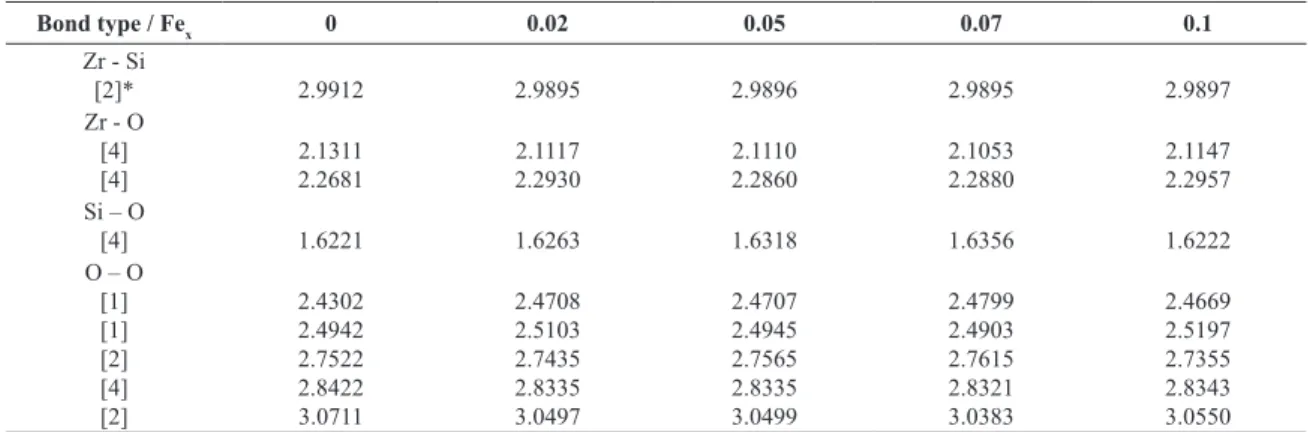
monitor the local distortions of the oxygen around the cations. Table 2 summarized the selected interatomic distances for the samples obtain at 1600 °C during 24 h. In order to perform the calculation we used the structural parameters obtained from
Rietveld reinements of the XRD data (CIF ile) using Bond
Str subprogram in Fullprof49. One can observe in Table 2 that
the selected interatomic distances reveal a gradual increase in the SiO4 tetrahedra with increasing iron content up to the sample with 0.07 mol of iron per mol of zircon. On the other hand, one can observe an apparent anomalous variation of the O-O distances.
Figure 3 shows the evolution of the lattice volume against the Fe nominal content in Fex–ZrSiO4 solid solutions heated at 1600 °C during 24 h. This behavior is similar to the one reported previously for the samples heated at 1100 °C or 1200 °C[36]. From these results, it can be inferred that the
Table 1. Crystallographic data and results of Rietveld reinement of X-ray diffraction patterns for Fe0.1-ZrSiO4 heated at different temperatures.
1100 °C / 3h 1200 °C / 3h 1600 °C / 24h
a(Å) 6.5993(2) 6.6003(5) 6.6030(7)
c(Å) 5.9777(1) 5.9773(3) 5.9793(4)
V(Å3) 260.335(4) 260.400(1) 260.702(5)
Rp(%) 8.8 8.6 9.2
Rwp(%) 11.6 10.7 12.1
Rwp (expected)(%) 7.9 8.1 7.5
χ2 1.5 1.7 1.6
tetragonal phase (wt %) 30.5 3.4
----monoclinic phase (wt %) 2.5 1.9 3.5
zircon phase (wt %) 65.5 92.8 93.8
hematite phase (wt %) 1.4 1.9 2.7
Y atomic coordinate of O 0.6649(8) 0.6634(2) 0.6634(2)
z atomic coordinate of O 0.1964(9) 0.1982(3) 0.1993(6)
Table 2. Selected interatomic distances (A) for Fex-ZrSiO4 powders heated at 1600 °C during 24 h.
Bond type / Fex 0 0.02 0.05 0.07 0.1
Zr - Si
[2]* 2.9912 2.9895 2.9896 2.9895 2.9897
Zr - O [4] [4]
2.1311 2.2681
2.1117 2.2930
2.1110 2.2860
2.1053 2.2880
2.1147 2.2957 Si – O
[4] 1.6221 1.6263 1.6318 1.6356 1.6222
O – O [1] [1] [2] [4] [2]
2.4302 2.4942 2.7522 2.8422 3.0711
2.4708 2.5103 2.7435 2.8335 3.0497
2.4707 2.4945 2.7565 2.8335 3.0499
2.4799 2.4903 2.7615 2.8321 3.0383
2.4669 2.5197 2.7355 2.8343 3.0550
*Bracketed numbers are bond multiplicities.
solubility limit is higher than 0.07 mol of iron per mol of zircon (~3.0 wt. % as Fe2O3). However, it must be lower than 0.1 mol of Fe (~4.2 wt. % as Fe2O3) because in the sample Fe0.1–ZrSiO4, hematite is detected as a secondary phase and also a small decrease in its lattice volume. The change of lattice parameters, as the iron content increases in the solid solution, is consistent with the idea of expansion of the lattice, as a larger ion substitutes a small ion. The observed increase in lattice parameters can be understood by assuming that Fe3+ replaces Si4+ in tetrahedral sites. The larger ionic radius of Fe3+ compared with Si4+ causes the progressive increase of the unit cell parameters with increasing substitution36,50. However, it is to be noted that for reaching electroneutrality in the formation of the Fe-doped zircon solid solution, some oxygen vacancies should be produced. Thus, the probable mechanism could be written out as Si4+ → Fe3+ + ½O2-. Furthermore, the simultaneous creation of anion vacancies would be in agreement with the small increase of lattice volume in the Fe-doped zircon series of samples. An alternative simple mechanism of solid solution formation involving the substitution of Zr4+ by Fe3+ does not seem to be operative because the difference of ionic radius of Zr+4 and Fe3+ and the simultaneous oxide vacancies creation would give rise to a large decrease in doped-zircon lattice parameters. Carreto et al.51
studied the preparation of Fe–zircon pigments by the ceramic
method adding LiF as mineralizer and reported results on the
Fe–zircon solid solution formation51,52. They found that only a small fraction of iron, about 2.5 mol %, was hosted in the zircon structure. Strikingly, the trend in the lattice volume variation of Fe–ZrSiO4 solid solutions with increasing the Fe nominal content found by those authors is opposite to the one reported in this work, that is, the lattice volume exhibits a contraction on incorporating the Fe into the zircon lattice. These changes in lattice parameters for samples heated at 1600 °C could be caused by the dissociation of zircon25,26. This dissociation will be subjected for a further characterization work.
3.2. Transmission electron microscopy
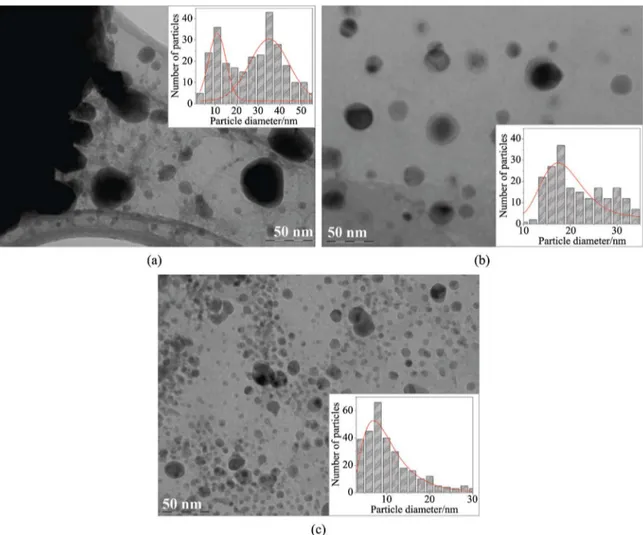
As a second step, transmission electron micrographs of Fe0.1-ZrSiO4 powders without any etching to remove the amorphous silica were collected. Three representative micrographs are show in Figure 4a-c. In Figure 4a it can be observed that the powders heated at 1100 °C during 3 h, the non-aggregated particles shows a small quasi-spherical particles and polyhedral-shape particles. The particle size distribution was determined over the analysis (histograms)
Figure 4. TEM micrographs evolution of Fe0.1–ZrSiO4 powders obtained at different temperatures and their respective particle size
of ive micrographs. The results show a bimodal particle
size distribution center at 11 ± 2 nm and 35 ± 2 nm, respectively. TEM micrograph of Fe0.1–ZrSiO4 powders heated at 1200 °C during 3 h is display in Figure 4b. As can be seen an arrangement of quasi-spherical particles with the average size around 19 ± 2 nm is observed. At this stage, it seems that the amount of dopant plays an important role in the particle size and shape distribution. We also may assume that almost all previous non-crystalline parts of the sample are recrystallizing at this stage, in favor of the remnant ZrO2. Figure 4c shows the TEM micrograph for the powders heated at 1600 °C during 24 h. The increase of the heat treatment gives rise to a decrease of zircon particle size. The results shows well-rounded particles exhibiting a particle size distribution center at 29 ± 1 nm.
3.3. Raman spectroscopy
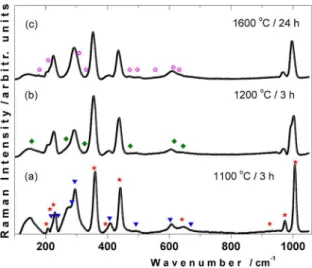
The next objective was to characterize the Raman evolution for Fex-ZrSiO4 powders in order to monitor the structural changes. Figure 5 shows the evolution of the Raman spectra obtained for Fe0.1–ZrSiO4 powders heated at different temperatures. Panel (a) of Figure 5 shows the Raman spectrum after a heat treatment at 1100 °C during 3 h, this result supports
the interpretation of XRD showed in Figure 3a. The space group for zircon (ZrSiO4) is I41/amd, Z=4, D19
4h, No. 141 [53]
and from group theory considerations, 12 Raman active modes are predicted (2A1g + 4 B1g + B2g + 5Eg)54-61. According to Nicola & Rutt54 and Dawson et al.55, the most intensive Raman bands of zircon, which lie in the wavenumber range 350-450 cm–1 and around 1000 cm–1, must be interpreted as internal vibrations of the SiO4 units. Intense external lattice vibrations (rotational and translational) occur in the range 200-230 cm–1. On the other hand, zirconium oxide (ZrO
2) exists in three polymorphic forms, namely: (1) monoclinic, which has space group P21/b (C5
2h) and Z = 4. It has 18 Raman active modes 9Ag + 9Bg; (2) the tetragonal phase (ZrO2), space group P42/mnc (D15
4h) and Z = 2. It has six Raman active modes, A1g + 2 B1g + 3Eg; and (3) the cubic phase, space group Fm3m (O5
h), Z = 4 with only one Raman active mode56. Hematite belongs to the D6
3d crystal space group and seven phonon lines are expected in the Raman spectrum55,56, namely two A1g modes (225 and 498 cm–1) and ive E
g modes (247, 293, 299, 412 and 613 cm–1). The positions of the characteristic Raman bands of this work are generally in good agreement with those reported in the literature57-63. One can observe that the frequency of the ν3(SiO4) band shows a shift by about 2 cm–1 toward lower wavenumbers, when compared with undoped crystalline zircon (Table 3).
Analogously, the Raman spectrum at 1200 °C (Figure 5b) show the bands of zircon, t-ZrO2 and hematite as one can
observe in the XRD pattern (Figure 3b). At this stage ν3(SiO4) FWHM shows a notable broadening by about 10.3 cm–1 and a clear shift approximately of 4 cm–1 from undoped ZrSiO
4. In panel (c) of Figure 6 shows the Raman spectrum for the
sample heated at 1600 °C during 24 h, this one conirms the
presence of zircon, m-ZrO2 and hematite. This spectrum shows the gradual increase back to the initial value of 1008 cm-1, however it shows an increase in the FWHM around 15.2 cm–1. Considering these observations and the fact that Fe and heat
treatments causes changes in the crystal size and structure; in the next part of this study we focus on the most intensive Raman bands of zircon (between 960-1020 cm–1) in order to discuss the effects of Fe, in particular on the samples obtained at 1600 °C during 24 h. It can be observe from Figure 6 that the Raman peak position shows a systematic red shift on going from the undoped sample to the sample with x=0.05. On the other hand, as one increase the iron concentration from x=0.05 to x=0.1, a reverse trend in the peak position is observed, i.e. a systematic blue shift of the peak position. According to Nasdala et al.64 the slight shift toward higher vibrational energies is due to the compressive strain in small ZrSiO4 particles, which increases with decreasing particle size. Figure 6 also shows the deconvoluted spectra of ν3(SiO4)
and ν1(SiO4) modes for the samples heated at 1600 °C during 24 h. All spectra were itted with a Gaussian-Lorentzian
Figure 5. Room temperature Raman spectra for Fe0.1-ZrSiO4 powders (a) heated at 1100 °C during 3 h (b) heated at 1200 °C during 3 h and (c) heated at 1600 °C during 24 h. (* is zircon; ▼is hematite, ○ is monoclinic ZrO2 and ♦ is tetragonal ZrO2).
Figure 6. (a-e) Raman spectra evolution for powders of Fex-ZrSiO4
to demonstrate band deconvolution obtained at symmetric stretching (ν1; A1g mode at 974 cm
-1) and antisymmetric stretching (ν 3; B1g
mode at 1008 cm–1) of SiO
4 tetrahedra. Individual’s peaks were
type proile to estimate their peak position and its full width
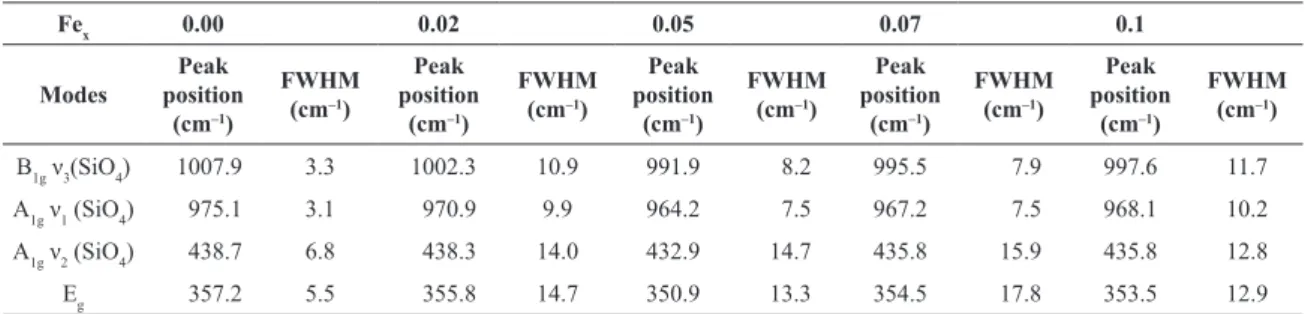
half maximum (FWHM). The estimated values of the peak positions and FWHMs are list in Table 3. It can be observe
from this table that the peak position of the ν3(SiO4) Raman mode has the lowest value of 1007.9 cm–1 at undoped sample and this value gradually shifted to lower wavenumbers with respect to this one. In addition, one can observe a pronounce asymmetry as one increases the iron content. Now we will discuss the mechanism of the wavenumber shift of the
ν3(SiO4) mode. Several factors such as temperature, defects and stress can cause a signiicant shift in the Raman peak
position. According to Balkanski et al.65 and Verma et al.66 temperature causes shift and broadening of Raman bands. In the present case, all measurements were performed at room temperature. It may be noted that high laser power
can cause signiicant thermal effect, which can result in
the broadening and shift of the Raman band67. Defects in the structure also cause shifts of the Raman peaks and
signiicant broadening of Raman line shape. The defects in
Fe-ZrSiO4 can in fact double the Raman line width. The shift of all main Raman bands (Figure 6, Figure 7 and Table 3) toward lower wavenumbers indicates that in general the average distances between atoms become somewhat larger.
As already mentioned in the XRD section concerning the
lattice is slightly expanded (Table 2). The increase in band full-width and the accompanying decrease of intensity can be interpreted in such a way that the distribution of bond lengths and bond angles within and between SiO4 tetrahedra becomes increasingly irregular. The discrepancy between
the Raman and XRD evaluation of lattice parameters is due to the fact the XRD is a predominantly probe of long order
and Raman is a probe of short order. Also mathematical formalism behind each method that investigates the line broadening is different, resulting in different results.
4. Conclusions
Structural, microstructural and vibrational properties of Fex-ZrSiO4 from free-mineralizer precursors were investigated
as a function of heat treatments. XRD, TEM and Raman
analyses demonstrated that iron plays an important role over the crystal size and shape distribution in Fe-ZrSiO4. The increase in lattice parameters determined by the Rietveld
reinement of XRD patterns is consistent with the idea that
Fe3+ cations are distributed mainly into tetrahedral sites replacing Si4+. The solubility limits of Fe3+ in ZrSiO4 at 1600 °C are in the range 0.07-0.1 mol of iron per mol of zircon. The evolution of particle size and shape distribution reveals a polyhedral morphology at 1100 °C during 3 h. The well-rounded and homogeneous particle size and shape distribution was determined in the sample heated at 1600 °C during 24 h. The Raman spectra for Fex-ZrSiO4 treated at different temperatures in the range 1100-1600 °C shows that, as the iron content increases, all Raman bands decrease in intensity becoming increasingly broader and show a notable shift toward lower wavenumbers. These changes suggest that the bond length of SiO4 tetrahedra become increasingly irregular and the lattice is slightly expanded.
Acknowledgements
G. Herrera thanks Mexico-CONACyT for the student fellowship Grant No. 170588; Postdoctoral Research Scholarship No. 129569 and No. 172529. GH is also indebted with A. Moreno for the library facilities at
PUEC-UNAM (Mexico) and L. R. Jiménez-Velasquez and
G. Rojas-George. The author also thanks to M.Sc. A. Mestre (SCSIE-Universitat de Valencia) for their assistance in
XRD measurements and M.Sc. M. Alcalde for Raman
measurements performed at Universitat Jaume I.
Table 3. Results obtained from the proile* deconvolution of selected Raman peak positions and corrected bandwidth values (full width
at half maximum, FWHM) for Fex-ZrSiO4 powders heated at 1600 °C during 24 h.
Fex 0.00 0.02 0.05 0.07 0.1
Modes
Peak position
(cm–1)
FWHM (cm–1)
Peak position
(cm–1)
FWHM (cm–1)
Peak position
(cm–1)
FWHM (cm–1)
Peak position
(cm–1)
FWHM (cm–1)
Peak position
(cm–1)
FWHM (cm–1)
B1g ν3(SiO4) 1007.9 3.3 1002.3 10.9 991.9 8.2 995.5 7.9 997.6 11.7
A1g ν1 (SiO4) 975.1 3.1 970.9 9.9 964.2 7.5 967.2 7.5 968.1 10.2
A1g ν2 (SiO4) 438.7 6.8 438.3 14.0 432.9 14.7 435.8 15.9 435.8 12.8
Eg 357.2 5.5 355.8 14.7 350.9 13.3 354.5 17.8 353.5 12.9
*Averaged at least over ive analysis.
Figure 7. (a-e) Raman spectra evolution and the result of itting
Gauss-Lorentz functions for Fex-ZrSiO4 powders in the region
References
1. Berry FJ, Eadon D, Holloway J and Smart LE. Iron doped zirconium silicate. Part 1: the location of iron. Journal of Materials Chemistry. 1996; 6(2):221-225. http://dx.doi. org/10.1039/jm9960600221.
2. Tartaj P, González-Carreño T, Serna CJ and Ocaña M. Iron zircon pigments prepared by pyrolysis of aerosols. Journal of Solid State Chemistry. 1997; 128(1):102-108. http://dx.doi. org/10.1006/jssc.1996.7176.
3. Bondioli F, Ferrari AM, Leonelli C and Manfredini T. Syntheses of Fe2O3/silica red inorganic inclusion pigments for ceramic applications. Materials Research Bulletin. 1998; 33(5):723-729. http://dx.doi.org/10.1016/S0025-5408(98)00047-6.
4. Robinson K, Gibbs GV and Ribbe PH. The structure of zircon:
a comparison with garnet. American Mineralogist. 1971;
56:782-790.
5. Hazen RM and Finger LW. Crystal structure and compressibility
of zircon at high pressure. American Mineralogist. 1979;
64:196-201.
6. Finch JR and Hanchar JM. Structure and chemistry of zircon and zircon-group minerals. Reviews in Mineralogy and Geochemistry. 2003; 53(1):1-25. http://dx.doi.org/10.2113/0530001.
7. Mori T, Yamamura H, Kobayashi H and Mitamura T. Preparation of high-purity ZrSiO4 powder using sol-gel processing and
mechanical properties of the sintered body. Journal of the American Ceramic Society. 1992; 75(9):2420-2426. http:// dx.doi.org/10.1111/j.1151-2916.1992.tb05594.x.
8. Ewing RC and Lutze W. Disposing of plutonium. Science.
1997; 275(5301):737-741. http://dx.doi.org/10.1126/ science.275.5301.737a.
9. Ewing RC. Nuclear waste forms for actinides. Proceedings
of the National Academy of Sciences of the United States of America. 1999; 96(7):3432-3439. http://dx.doi.org/10.1073/ pnas.96.7.3432. PMid:10097054.
10. Burakov BE, Hanchar JM, Zamoryanskaya MV, Garbuzov VM and Zirlin VA. Synthesis and investigation of Pu-doped single crystal zircon, (Zr, Pu)SiO4. Radiochimica Acta. 2002; 89:1-3. 11. Ewing RC, Lutze W and Weber W. Zircon: a host-phase for
the disposal of weapons plutonium. Journal of Materials
Research. 1995; 10(02):243-246. http://dx.doi.org/10.1557/ JMR.1995.0243.
12. Smirnov MB, Sukhomlinov SV and Smirnov SK. Vibrational spectrum of reidite ZrSiO4 from first principles. Physical Review B: Condensed Matter and Materials Physics. 2010; 82(9):0943071. http://dx.doi.org/10.1103/PhysRevB.82.094307. 13. Berry FJ, Eadon D, Holloway J and Smart LE. Iron-doped zircon:
the mechanism of formation. Journal of Materials Science. 1999; 34(15):3631-3638. http://dx.doi.org/10.1023/A:1004691019526. 14. Llusar M, Badenes JA, Calbo J, Tena MA and Monrós G.
Estudio del efecto de la adición de distintos mineralizadores en la síntesis cerámica del pigmento rosa coral de hierro-circón. Boletín de la Sociedad Española de Cerámica y Vidrio. 1999; 38:201-208.
15. Shoyama M, Hashimoto K, Hashimoto T, Nasu H and Kamiya K. Iron-zircon pigments prepared by the sol-gel method. Journal of the Ceramic Society of Japan. 1999; 107(1246):534-540. http://dx.doi.org/10.2109/jcersj.107.534.
16. Llusar M, Badenes JA, Calbo J, Tena MA and Monrós G. Environmental and colour optimisation of mineraliser addition in synthesis of iron zircon ceramic pigment. British Ceramic Transactions. 2000; 99(1):14-22. http://dx.doi.org/10.1179/ bct.2000.99.1.14.
17. Llusar M, Calbo J, Badenes JA, Tena MA and Monrós G. Synthesis of iron zircon coral by coprecipitation routes. Journal of Materials Science. 2001; 36(1):153-163. http://dx.doi. org/10.1023/A:1004801406230.
18. Ardizzone S, Binaghi L, Cappelletti G, Fermo P and Gilardoni S. Iron doped zirconium silicate prepared by a sol–gel procedure. The effect of the reaction conditions on the structure, morphology and optical properties of the powders. Physical Chemistry Chemical Physics. 2002; 4(22):5683-5689. http:// dx.doi.org/10.1039/b207381a.
19. García A, Llusar M, Sorlí S, Calbo J, Tena MA and Monrós G. Effect of the surfactant and precipitant on the synthesis
of pink coral by a microemulsion method. Journal of the
European Ceramic Society. 2003; 23(11):1829-1838. http://
dx.doi.org/10.1016/S0955-2219(02)00451-X.
20. Cortés EC, Fuente JAM, Moreno JM, Pérez CP, Cordoncillo EC and Castelló JBC. Solid-solution formation in the synthesis of fe-zircon. Journal of the American Ceramic Society. 2004; 87(4):612-616. http://dx.doi.org/10.1111/j.1551-2916.2004.00612.x.
21. Cappelletti G, Ardizzone S, Fermo P and Gilardoni S. The influence of iron content on the promotion of the zircon structure and the optical properties of pink coral pigments. Journal of the European Ceramic Society. 2005; 25(6):911-917. http:// dx.doi.org/10.1016/j.jeurceramsoc.2004.04.023.
22. Ozel E and Turan S. Production of coloured zircon pigments
from zircón. Journal of the European Ceramic Society.
2007; 27(2-3):1751-1757. http://dx.doi.org/10.1016/j. jeurceramsoc.2006.05.008.
23. Pyon K-R and Lee B-H. Effect of iron content and annealing temperature on the color characteristics of Fe-ZrSiO4 coral pink pigments synthesized by Sol-gel method. Journal of the Ceramic Society of Japan. 2009; 117(1363):258-263. http:// dx.doi.org/10.2109/jcersj2.117.258.
24. Yu R, Kim YJ, Pee JH, Kim KJ and Kim W. Thermal behavior and coloration study of silica-coated alpha-Fe2O3 and beta-FeOOH
nanocapsules. Journal of Nanoscience and Nanotechnology.
2011; 11(7):6283-6286. http://dx.doi.org/10.1166/jnn.2011.4379. PMid:22121702.
25. Kaiser A, Lobert M and Telle R. Thermal stability of zircon (ZrSiO4).
Journal of the European Ceramic Society. 2008; 28(11):2199-2211. http://dx.doi.org/10.1016/j.jeurceramsoc.2007.12.040.
26. Alahakoon WPCM, Burrows SE, Howes AP, Karunaratne BSB, Smith ME and Dobedoe RS. Fully densified zircon co-doped with iron and aluminium prepared by sol-gel processing. Journal of the European Ceramic Society. 2010; 30(12):2515-2523. http://dx.doi.org/10.1016/j.jeurceramsoc.2010.05.011. 27. Kock LD, Lekgoathi MDS, Snyders E, Wagener JB, Nel JT and
Havenga JL. The determination of percentage dissociation of zircon (ZrSiO4) to plasma-dissociated zircon (ZrO2•SiO2) by
Raman spectroscopy. Journal of Raman Spectroscopy : JRS.
2012; 43(6):769-773. http://dx.doi.org/10.1002/jrs.3090. 28. Herrera G, Montoya N, Doménech-Carbó A and Alarcón J.
Synthesis, characterization and electrochemical properties of iron-zirconia solid solution nanoparticles prepared using a sol-gel technique. Physical Chemistry Chemical Physics. 2013; 15(44):19312-19321. http://dx.doi.org/10.1039/c3cp53216j. PMid:24121534.
29. Doménech-Carbó A, Herrera G, Montoya N, Pardo P, Alarcón J, Doménech-Carbó T, et al. Solid state electrochemistry of iron-doped zircon and zirconia materials. Journal of the Electrochemical Society. 2014; 161:H539-H546. http://dx.doi. org/10.1149/2.0751409jes.
Mineralogy. 1995; 7(3):471-478. http://dx.doi.org/10.1127/ ejm/7/3/0471.
31. Nasdala L, Irmer G and Jonckheere R. Metamictisation of natural zircon: accumulation versus thermal annealing of radioactivity-induced damage. Contributions to Mineralogy and Petrology. 2002; 143(6):758-765. http://dx.doi.org/10.1007/10.1007/ s00410-002-0380-7.
32. Nasdala L, Zhang M, Kempe U, Panczer G, Gaft M, Andrut M, et al. Spectroscopic methods applied to zircon. Reviews in Mineralogy and Geochemistry. 2003; 53(1):427-467. http:// dx.doi.org/10.2113/0530427.
33. Nasdala L, Miletich R, Ruschel K and Váczi T. Raman study of radiation-damaged zircon under hydrostatic compression.
Physics and Chemistry of Minerals. 2008; 35(10):597-602. http://dx.doi.org/10.1007/s00269-008-0251-5.
34. Nasdala L, Wenzel M, Vavra G, Irmer G, Wenzel T and Kober B. Metamictisation of natural zircon: accumulation versus thermal annealing of radioactivity-induced damage. Contributions to Mineralogy and Petrology. 2001; 141(2):125-144. http://dx.doi. org/10.1007/s004100000235.
35. Geisler T, Pidgeon RT, van Bronswijk W and Pleysier R. Kinetics of thermal recovery and recrystallization of partially
metamict zircon: a Raman spectroscopic study. European
Journal of Mineralogy. 2001; 13(6):1163-1176. http://dx.doi. org/10.1127/0935-1221/2001/0013-1163.
36. Herrera G, Montoya N and Alarcón J. Synthesis and characterization of iron-doped ZrSiO4 solid solutions from gels. Journal of the American Ceramic Society. 2011; 94(12):4247-4255. http:// dx.doi.org/10.1111/j.1551-2916.2011.04808.x.
37. Herrera G, Montoya N and Alarcón J. Microstructure of Fe–ZrSiO4 solid solutions prepared from gels. Journal of the
European Ceramic Society. 2012; 32(1):227-234. http://dx.doi. org/10.1016/j.jeurceramsoc.2011.08.014.
38. Rodriguez-Carvajal J. FULLPROF: a program for rietveld refinement and pattern matching analysis. In: Abstracts of the Satellite Meeting on Powder Diffraction of the XV Congress of the International Union of Crystallography; 1990; Toulouse, France. Toulouse: IUCr; 1990. p. 127.
39. Rodriguez-Carvajal J and Roisnel T. Fullprof.98 and WinPLOTR New Windows 95/NT applications for diffraction. Newsletter. 1998; 20:35-36.
40. Teufer G. The crystal structure of tetragonal ZrO2. Acta Crystallographica. 1962; 15(11):1187. http://dx.doi.org/10.1107/
S0365110X62003114.
41. Smith DK and Newkirk HW. The crystal structure of baddeleyite (monoelinie ZrOz) and its relation to the polymorphism of ZrO2. Acta Crystallographica. 1965; 18(6):983-991. http://
dx.doi.org/10.1107/S0365110X65002402.
42. Blake RL, Hessevick RE, Zoltai T and Finger LW. Refinement of the hematite structure. American Mineralogist. 1966; 51:123-129.
43. Bergerhoff G, Berndt M and Brandenburg K. Evaluation of crystallographic data with the program DIAMOND. Journal of Research of the National Institute of Standards and Technology. 1996; 101(3):221-225. http://dx.doi.org/10.6028/jres.101.023.
44. Rasband WS. ImageJ. Bethesda: U.S. National Institutes of Health. Available from: <http://imagej.nih.gov/ij>. Access in: 13 Aug. 2015.
45. Presser V and Glotzbach C. Metamictization in zircon: Raman investigation following a Rietveld approach. Part II: Sampling
depth implication and experimental data. Journal of Raman
Spectroscopy. 2009; 40(5):499-508. http://dx.doi.org/10.1002/ jrs.2154.
46. Gucsik A, Zhang M, Koeberl C, Salje EKH, Redfern SAT and Pruneda JM. Infrared and Raman spectra of ZrSiO4 experimentally shocked at high pressures. Mining Magazine. 2004; 68(5):801-811. http://dx.doi.org/10.1180/0026461046850220.
47. Ocaña M, Fórnes V and Serna CJ. The variability of the infrared powder spectrum of amorphous SiO2. Journal of Non-Crystalline Solids. 1989; 107(2-3):187-192. http://dx.doi.org/10.1016/0022-3093(89)90461-4.
48. Ocaña M, Fórnes V and Serna CJ. A simple procedure for the preparation of spherical oxide particles by hydrolysis of aerosols. Ceramics International. 1992; 18(2):99-106. http:// dx.doi.org/10.1016/0272-8842(92)90038-F.
49. Rodriguez-Carvajal J. Recent advances in magnetic structure
determination by neutron powder diffraction. Physica B,
Condensed Matter. 1993; 192(1-2):55-69. http://dx.doi. org/10.1016/0921-4526(93)90108-I.
50. Shannon RD. Revised effective ionic radii and systematic studies of interatomie distances in halides and chaleogenides.
Acta Crystallographica. Section A, Crystal Physics, Diffraction, Theoretical and General Crystallography. 1976; 32(5):751-767. http://dx.doi.org/10.1107/S0567739476001551.
51. Carreto E, Piña C, Arriola H, Barahona A C, Nava N and Castaño V. Mössbauer study of the structure of Fe – zircon system.
Journal of Radioanalytical and Nuclear Chemistry. 2001; 250(3):453-458. http://dx.doi.org/10.1023/A:1017988720055.
52. Cortés EC, Fuente JAM, Moreno JM, Pérez CP, Cordoncillo EC and Castelló JBC. Solid-solution formation in the synthesis of Fe–zircon. Journal of the American Ceramic Society. 2004; 87(4):612-616. http://dx.doi.org/10.1111/j.1551-2916.2004.00612.x. 53. Miller SA, Caspers HH and Rast HE. Lattice vibrations of
Yttrium Vanadate. Physical Review. 1968; 168(3):964-969.
http://dx.doi.org/10.1103/PhysRev.168.964.
54. Nicola JH and Rutt HN. A comparative study of zircon (ZrSiO4) and hafnon (HfSiO4) Raman spectra. Journal of Physics. C.
Solid State Physics. 1974; 7(7):1381-1386. http://dx.doi. org/10.1088/0022-3719/7/7/029.
55. Dawson P, Hargreave MM and Wilkinson GR. The vibrational spectrum of zircon (ZrSiO4). Journal of Physics. C. Solid State
Physics. 1971; 4(2):240-256. http://dx.doi.org/10.1088/0022-3719/4/2/014.
56. Gazzoli D, Mattei G and Valigi M. Raman and X-ray investigations of the incorporation of Ca2+ and Cd2+ in the ZrO
2 structure.
Journal of Raman Spectroscopy. 2007; 38(7):824-831. http:// dx.doi.org/10.1002/jrs.1708.
57. Porto SPS and Krishnan RS. Raman effect of corundum. The
Journal of Chemical Physics. 1967; 47(3):1009-1012. http:// dx.doi.org/10.1063/1.1711980.
58. Bhagavantam S and Venkatarayudu T. Raman effect in relation to crystal structure. Proceedings of the Indian Academy of Sciences - Section A. 1939; 10:224-258.
59. Faria DLA, Silva SV and Oliveira MT. Raman microspectroscopy
of some iron oxides and oxyhydroxides. Journal of Raman
Spectroscopy. 1997; 28(11):873-878. http://dx.doi.org/10.1002/ (SICI)1097-4555(199711)28:11<873::AID-JRS177>3.0.CO;2-B.
60. Jubb AM and Allen HC. Vibrational spectroscopic characterization of hematite, maghemite, and magnetite thin ilms produced by vapor deposition. ACS Applied Materials & Interfaces. 2010; 2(10):2804-2812. http://dx.doi.org/10.1021/am1004943.
62. Legodi MA and de Waal D. The preparation of magnetite, goethite, hematite and maghemite of pigment quality from mill scale iron waste. Dyes and Pigments. 2007; 74(1):161-168. http://dx.doi.org/10.1016/j.dyepig.2006.01.038.
63. Shim S-H and Duffy TS. Raman spectroscopy of Fe2O3 to
62 GPa. The American Mineralogist. 2001; 87(2-3):318-326. http://dx.doi.org/10.2138/am-2002-2-314.
64. Nasdala L, Lengauer CL, Hanchar JM, Kronz A, Wirth R, Blanc P, et al. Annealing radiation damage and the recovery of cathodoluminescence. Chemical Geology. 2002; 191(1-3):121-140. http://dx.doi.org/10.1016/S0009-2541(02)00152-3.
65. Balkanski M, Wallis RF and Haro E. Anharmonic effects in light scattering due to optical phonons in silicon. Physical Review B: Condensed Matter and Materials Physics. 1983; 28(4):1928-1934. http://dx.doi.org/10.1103/PhysRevB.28.1928.
66. Verma P, Abbi SC and Jain KP. Raman-scattering probe of
anharmonic effects in GaAs. Physical Review B: Condensed
Matter and Materials Physics. 1995; 51(23):16660-16667. http://dx.doi.org/10.1103/PhysRevB.51.16660. PMid:9978670. 67. Gouadec G and Colomban P. Raman Spectroscopy of nanomaterials: