Vibrational spectroscopic characterization of the phosphate mineral
phosphophyllite – Zn
2
Fe(PO
4
)
2
4H
2
O, from Hagendorf Süd, Germany
and in comparison with other zinc phosphates
Ricardo Scholz
a, Ray L. Frost
b,⇑, Yunfei Xi
b, Leonardo M. Graça
a, Leonardo Lagoeiro
a, Andrés López
baSchool of Chemistry, Physics and Mechanical Engineering, Science and Engineering Faculty, Queensland University of Technology, GPO Box 2434, Brisbane, Queensland 4001,
Australia
bGeology Department, School of Mines, Federal University of Ouro Preto, Campus Morro do Cruzeiro, Ouro Preto, MG 35,400-00, Brazil
h i g h l i g h t s
"Chemical analysis of phosphophyllite was carried out by Scanning Electron Microscope in the EDS mode.
"The chemical formula was determined to be: Zn2(Fe0.65, Mn0.35)P1.00(PO4)24(H2O).
"The mineral was characterized by both Raman and infrared spectroscopy. "An assessment of the molecular structure was made.
"A comparison is made with the spectra of other zinc phosphate minerals.
a r t i c l e
i n f o
Article history:
Received 18 December 2012
Received in revised form 30 January 2013 Accepted 30 January 2013
Available online 8 February 2013
Keywords:
Phosphophyllite Phosphate Pegmatite Raman spectroscopy Infrared spectroscopy
a b s t r a c t
This research was undertaken on phosphophyllite sample from the Hagendorf Süd pegmatite, Bavaria, Germany. Chemical analysis was carried out by Scanning Electron Microscope in the EDS mode and indi-cates a zinc and iron phosphate with partial substitution of manganese, which partially replaced iron. The calculated chemical formula of the studied sample was determined to be: Zn2(Fe0.65, Mn0.35)P1.00(PO4)
4(H2O). The intense Raman peak at 995 cm1is assigned to them1PO34symmetric stretching mode and
the two Raman bands at 1073 and 1135 cm1to them
3PO34antisymmetric stretching modes. Them4
PO3
4 bending modes are observed at 505, 571, 592 and 653 cm1and them2PO34bending mode at
415 cm1. The sharp Raman band at 3567 cm1attributed to the stretching vibration of OH units brings
into question the actual formula of phosphophyllite. Vibrational spectroscopy enables an assessment of the molecular structure of phosphophyllite to be assessed.
Ó2013 Elsevier B.V. All rights reserved.
1. Introduction
Phosphophyllite is a rare Zn and Fe hydrous phosphate with general chemical formula expressed by Zn2Fe(PO4)24H2O[1,2]. It
was first described in pegmatites in Hagendorf, Bavaria, by Laub-mann and Steinmetz[3]. The mineral crystallizes in the monoclinic crystal system,P2/cspace group with unit cell parameters given as: a= 10.378 Å, b= 5.084 Å, c= 10.553 Å, b= 121.14° and Z= 2
[2,4,5]. Several studies have suggested similarity between the crys-tal structure of phosphophyllite and that of hopeite[6–8]and para-hopeite[2,9–11]. The framework consists of [Zn2P2O7] tetrahedral
sheets identical to those in hopeite, interleaved with [FeO4H2O]
octahedral sheets similar to those in parahopeite. The
phospho-phyllite is a secondary mineral derivative from primary iron-man-ganese phosphates and sphalerite[3,12]. At the type locality, the phosphophyllite occurs associated with natrolite, triplite, triphy-lite, triploide and apatite[3]. The mineral occurs in granitic pegma-tites and in hydrothermal deposits. Despites the type locality, other occurrences were reported from Reaphook Hill, Australia[13]; Cer-ro de Potossi, Bolivia[14]and from East Kemptville Tin Mine Can-ada[15], among others.
Farmer [16] divided the vibrational spectra of phosphates according to the presence, or absence of water and hydroxyl units in the minerals. In aqueous systems, Raman spectra of phosphate oxyanions show a symmetric stretching mode (
m
1) at 938 cm1,the antisymmetric stretching mode (
m
3) at 1017 cm1, thesym-metric bending mode (
m
2) at 420 cm1 and them
4 mode at567 cm1. The value for the
m
1symmetric stretching vibration of
PO4 units as determined by infrared spectroscopy was also
0022-2860/$ - see front matterÓ2013 Elsevier B.V. All rights reserved. http://dx.doi.org/10.1016/j.molstruc.2013.01.075
⇑Corresponding author. Tel.: +61 7 3138 2407; fax: +61 7 3138 1804.
E-mail address:[email protected](R.L. Frost).
Contents lists available atSciVerse ScienceDirect
Journal of Molecular Structure
described. The position of the symmetric stretching vibration is mineral dependent and a function of the cation and crystal struc-ture. The fact that the symmetric stretching mode is observed in the infrared spectrum affirms a reduction in symmetry of the PO4units.
The value for the
m
2symmetric bending vibration of PO4units asdetermined by infrared spectroscopy was given as 438 cm1
(aug-elite), 452 cm1 (wavellite), 440 and 415 cm1 (rockbridgeite),
455, 435 and 415 cm1(dufrenite) and 470 and 450 cm1
(bera-unite). The observation of multiple bending modes provides an indication of symmetry reduction of the PO4units. This symmetry
reduction is also observed through the
m
3antisymmetric stretchingvibrations was also described by Frost and Weier[17].
To the best knowledge of the authors, data about vibrational spectroscopic characterization of phosphophyllite are restricted to the database of the University of Arizona (rruff.info) and no interpretation is given, however, in recent years, the application of spectroscopic techniques to understand the structure of phos-phates has been increasing. In this work, a sample of the rare min-eral phosphophyllite from the type locality was studied. Characterization includes chemistry via scanning electron micros-copy (SEM) in the EDS mode and spectroscopic characterization of the structure with infrared and Raman.
2. Experimental
2.1. Occurrence, samples description and preparation
The phosphophyllite sample studied in this work was obtained from the collection of the Geology Department of the Federal Uni-versity of Ouro Preto, Minas Gerais, Brazil, with sample code SAA-098. The sample is from the Hagendorf pegmatite, Germany, and can be considered a reference material. The Hagendorf pegmatite was an important feldspar–quartz deposit in Europe. It is located in the NE Bavarian basement[18]and despites the industrial min-erals it is an important source of rare phosphates such as hagen-dorfite[19], scholzite [20]and keckite [21]. The studied sample occurs in association with siderite and vivianite. The sample was gently crushed and prepared to be analyzed by different methods. Scanning electron microscopy (SEM) was applied to support the mineral characterization.
2.2. Scanning electron microscopy (SEM)
Experiments and analyses involving electron microscopy were performed in the Center of Microscopy of the Universidade Federal de Minas Gerais, Belo Horizonte, Minas Gerais, Brazil (http:// www.microscopia.ufmg.br). A fragment of a phosphophyllite sin-gle crystal was prepared in a carbon tape. Due to the low vacuum conditions the sample does not was metalized. Secondary Electron and Backscattering Electron images were obtained using a JEOL JSM-6360LV equipment. Qualitative and semi-quantitative chemi-cal analysis in the EDS mode were performed with a ThermoNO-RAN spectrometer model Quest and was applied to support the mineral characterization.
2.3. Raman microprobe spectroscopy
A phosphophyllite crystal was placed on a polished metal sur-face on the stage of an Olympus BHSM microscope, which is equipped with 10, 20, and 50 objectives. The microscope is part of a Renishaw 1000 Raman microscope system, which also in-cludes a monochromator, a filter system and a CCD detector (1024 pixels). The Raman spectra were excited by a Spectra-Phys-ics model 127 He–Ne laser producing highly polarized light at
633 nm and collected at a nominal resolution of 2 cm1and a
pre-cision of ±1 cm1in the range between 200 and 4000 cm1.
Re-peated acquisitions on the crystals using the highest magnification (50) were accumulated to improve the signal to noise ratio of the spectra. Raman Spectra were calibrated using the 520.5 cm1line of a silicon wafer. The Raman spectrum of at
least 10 crystals was collected to ensure the consistency of the spectra.
2.4. Infrared spectroscopy
Infrared spectra were obtained using a Nicolet Nexus 870 FTIR spectrometer with a smart endurance single bounce diamond ATR cell. Spectra over the 4000–525 cm1 range were obtained
by the co-addition of 128 scans with a resolution of 4 cm1and a
mirror velocity of 0.6329 cm/s. Spectra were co-added to improve the signal to noise ratio.
Spectral manipulation such as baseline correction/adjustment and smoothing were performed using the Spectracalc software package GRAMS (Galactic Industries Corporation, NH, USA). Band component analysis was undertaken using the Jandel ‘Peakfit’ soft-ware package that enabled the type of fitting function to be se-lected and allows specific parameters to be fixed or varied accordingly. Band fitting was done using a Lorentzian–Gaussian cross-product function with the minimum number of component bands used for the fitting process. The Gaussian–Lorentzian ratio was maintained at values greater than 0.7 and fitting was under-taken until reproducible results were obtained with squared corre-lations ofr2greater than 0.995.
3. Results and discussion
3.1. Chemical characterization
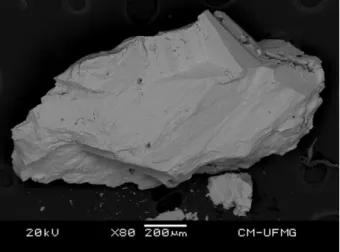
The BSE image of the phosphophyllite sample studied in this work is shown inFig. 1. Qualitative and semi-quantitative chemical composition shows a Zn, Fe and Mn phosphate. The semi-quantita-tive chemical data was recalculated considering 16.07% of H2O in
the structure, as expected for stoichiometric phosphophyllite. According to the crystal structure, 100% of Fe was considered as Fe2+. The chemical analysis is shown inFig. 2. The chemical
for-mula was calculated on the basis of 12 O atoms and can be ex-pressed as:
Zn2ðFe0:65;Mn0:35Þ
X
1:00
ðPO4Þ24ðH2OÞ
3.2. Vibrational spectroscopy
The Raman spectrum of phosphophyllite in the 4000–100 cm1
spectral region is displayed inFig. 3a. This spectrum shows the po-sition of the Raman bands and their relative intensities. Observed, there are large parts of the spectrum where no intensity is
observed and therefore, the spectrum is subdivided into sections according to the types of vibration being examined. The infrared spectrum over the 4000–500 cm1 spectral range is reported in
Fig. 3b. This spectrum shows the position and relative intensities of the infrared bands. There are large parts of the spectrum where no intensity is observed, and therefore, the spectrum is subdivided into sections depending upon the type of vibration being studied. The Raman spectrum in the 1400–800 cm1 spectral range is
illustrated inFig. 4a. The Raman spectrum appears to be quite sim-ple in this spectral region when compared to the Raman spectra of many pegmatitic phosphates. The intense Raman peak at 995 cm1
is assigned to the
m
1PO34symmetric stretching mode. The twoRa-man bands at 1073 and 1135 cm1are ascribed to the
m
3PO34anti-symmetric stretching modes. The Raman band at 939 cm1 is
thought to be due to a PO stretching vibration of hydrogen phos-phate units. This band appears at 938 cm1in the infrared
spec-trum and is of great intensity with shoulder bands at 919 and 950 cm1. The infrared band at 1002 cm1 is defined as the
m
1
PO3
4 symmetric stretching mode. The infrared bands at 1032,
1078, 1123 and 1141 cm1are attributed to the
m
3PO34
antisym-metric stretching modes.
A comparison may be made with the vibrational spectroscopy of other zinc phosphate minerals. For hopeite, a Raman band is ob-served at 940 cm1and is assigned to the
m
1symmetric stretching
vibration. This band was previously reported at 941 cm1in
excel-lent agreement with the results reported in this work[22]. In the infrared spectrum of hopeite, an intense band is observed at 995 cm1 with other low intensity bands at 1150, 1059 and
1000 cm1, all of which are ascribed to the
m
3 antisymmetric
stretching modes. Pawlig et al. reported bands at 1150, 1055 and 997 cm1[22]. In the infrared spectrum of hopeite, bands at 948
and 922 cm1 are observed and are attributed to the ‘forbidden’
symmetric stretching modes. A previous study reported a band at 943 cm1 [22]; however the band was strongly asymmetric on
the low wavenumber side. Other infrared bands are observed at 1137, 1096, 1059, 1019 and 995 cm1. A previous study reported
bands at 1127, 1104, 1069, 1011 and 994 cm1with the last band
observed after partial deuteration[22].
The Raman spectrum of parahopeite shows a band centered upon 959 cm1 which is assigned to the symmetric stretching
mode. Three antisymmetric stretching bands are observed at Fig. 2.EDS spectra of phosphophyllite.
Fig. 3.(a) Raman spectrum of phosphophyllite over the 100–4000 cm1spectral
range. (b) Infrared spectrum of phosphophyllite over the 500–4000 cm1spectral
1053, 1033 and 1003 cm1. Parahopeite is triclinic as compared
with hopeite which is orthorhombic. The infrared spectrum of parahopeite shows two bands at 951 and 919 cm1. Three bands
are observed at 1106, 1045 and 1002 cm1. It should be noted that
the spectra both Raman and infrared of parahopeite is different from that of hopeite, which is not unexpected since the two min-erals have different crystal structures. To our knowledge no vibra-tional spectra of parahopeite have been reported; Castagnola and Dutta [23] showed some Raman spectra of ion exchanged zinc phosphates and some resemblance of the spectra of the films cor-responds to the spectrum of parahopeite[23]. The Raman spec-trum of spencerite displays a low intensity band as a shoulder on the main peak at 999 cm1 at 952 cm1. This band is attributed
to the symmetric stretching mode. Other Raman bands are ob-served at 1095, 1019, 999 and 989 cm1. These bands are
attrib-uted to the
m
3 antisymmetric stretching modes. Infrared bandsare observed at 940 and 842 cm1; and also at 1048, 1010 and
987 cm1. The Raman spectrum of tarbuttite shows an intense
band centered at 965 cm1assigned to the
m
1symmetric stretching
mode and at 1069, 1051 and 1011 cm1assigned to the
m
3anti-symmetric stretching modes. The infrared spectrum of tarbuttite shows two bands at 954 and 902 cm1 and also at 1088, 1056
and 990 cm1. In comparison the Raman spectrum of scholzite
shows an intense band at 923 cm1 with an even more intense
band at 1000 cm1. Other Raman bands are observed at 1171,
1115, 1088, 1053, and 1026 cm1. The infrared spectrum of
scholz-ite is complex with multiple overlapping bands. IR bands are ob-served at 1107, 1047, 999, 956 and 929 cm1. The Raman
spectrum of parascholzite is similar to but not the same as that
of scholzite. The
m
1 band is observed at 925 cm1andm
3modesat 1170, 1115, 1086 and 999 cm1.
The Raman spectrum in the 800–300 cm1spectral range is
re-ported inFig. 5a. The most prominent band is the intense band at 322 cm1. This band is assigned to metal-oxygen vibrations (ZnO,
FeO, MnO). The Raman band at 415 cm1 is assigned to the
m
2PO3
4 bending modes. The series of Raman bands at 505, 571, 592
and 653 cm1are attributed to the
m
4 PO34 bending modes. The
broad Raman band at 744 cm1is likely to be due to the water
librational mode. The Raman spectrum in the far low wavenumber region over the 300–100 cm1spectral range is reported inFig. 5b.
The Two bands at 269 and 297 cm1may be due to MO stretching
vibrations. The other Raman bands at 119, 142, 181 and 199 cm1
are simply described as lattice vibrations and are due to external vibrations.
A comparison may be made with the vibrational spectra of the other zinc phosphate minerals in this spectral region. The Raman spectrum of hopeite shows a broad band centered upon 372 cm1. This band is assigned to the PO
4
m
2symmetric bendingmode. A second intense band is observed at 313 cm1. Both bands
are assigned to the
m
2bending modes. A previous study of theRa-man spectrum of hopeite gave bands at 366 and 310 cm1[22]. A
set of three bands are observed at 634, 596 and 569 cm1and are
attributed to the
m
4bending modes. Pawlig et al. reported bands at637, 598 and 565 cm1[22]. Just as with the PO3
4 stretching
re-gion, the low wavenumber region of parahopeite is very different from that of hopeite. An intense band is observed at 326 cm1with
a second band at 362 cm1. These bands are assigned to the
m
2bending modes. Raman bands are also observed at 645, 568, 563 and 504 cm1and are ascribed to the
m
4bending modes of
para-Fig. 4.(a) Raman spectrum of phosphophyllite over the 800–1400 cm1spectral
range. (b) Infrared spectrum of phosphophyllite over the 500–1300 cm1spectral
range.
Fig. 5.(a) Raman spectrum of phosphophyllite over the 300–800 cm1spectral
range. (b) Raman spectrum of phosphophyllite over the 100–300 cm1spectral
hopeite. Infrared bands of parahopeite are observed at 567 and 543 cm1. The Raman spectrum of the low wavenumber region
of spencerite shows more complexity. A set of bands assigned to the
m
2bending modes are observed at 396, 376 and 350 cm1. Asecond set of bands are observed at 596, 588, 510 and 488 cm1
and are assigned to the
m
4bending modes. There is a strongresem-blance between the low wavenumber spectra of spencerite and tarbuttite. A set of bands are observed at 382, 339 and 302 cm1
and are assigned to the
m
2bending modes. An intense band isob-served in the Raman spectrum at 410 cm1 (scholzite) and
409 cm1(parascholzite). This band is assigned to the
m
2bending
mode. Other bands are observed at 340, 309, 287 and 273 cm1
for scholzite and at 302, 286, 271 and 236 cm1for parascholzite.
A set of low intensity bands are observed at 664, 634, 600, 551 and 510 cm1for scholzite and are attributed to the
m
4bending modes.
For parascholzite an intense band was found at 553 cm1and is
as-signed to the
m
4bending mode. Other low intensity bands areob-served at 662, 637, 599 and 511 cm1. It is likely these bands are
also due to the
m
4bending modes.The Raman spectrum in the 3800–2600 cm1spectral range is
illustrated inFig. 6a. Two spectral features are observed. The sharp Raman band at 3567 cm1which is attributed to the stretching
vibration of OH units. The observation of this peak brings into question the actual formula of the mineral Zn2Fe(PO4)24H2O. The
second feature is the broad spectral profile over the 3400 to 2600 cm1 spectral range. Raman bands may be resolved at
3034, 3146, 3258 and 3362 cm1. These bands are assigned to
water stretching vibrations. The intensity of these bands are signif-icantly higher in the infrared spectrum (Fig. 6b). The infrared bands at 3073, 3132, 3246, 3381 and 3537 cm1are assigned to water
stretching vibrations.
The unit cells of the zinc phosphate minerals all contain multi-ple units of water except for tarbuttite which has no water but has a hydroxyl unit. Thus multiple OH stretching vibrations would be expected in both the Raman and infrared spectra. For hopeite two Raman bands in the hydroxyl stretching region are observed at 3456 and 3247 cm1. Pawlig et al. reported the infrared
spec-trum of hopeite and its deuteron-analogs[22]. They reported infra-red bands at 3537, 3410, 3263 and 3181 cm1[22]. The structure
of hopeite consists of ZnO2(H2O)4 octahedra, ZnO4 tetrahedra,
and PO4tetrahedra, none of which are regular; these polyhedra
share corners and edges[24]. It is likely that the two water mole-cules are non-equivalent, thus giving rise to in-phase and out-of-phase behavior. Hence two Raman bands and two infrared bands would be expected.
In contrast the crystal; structure of parahopeite is subtly differ-ent from that of hopeite[11]. The crystal structure of parahopeite, Zn3(PO4)24H2O, is similar to those of phosphophyllite and hopeite
in that one of the 2 Zn atoms is 6-coordinated and the other is 4-coordinated. Parahopeite differs from the other 2 minerals because one of the P–O tetrahedral O atoms is bonded to both the 6- and coordinated cations. All 4 tetrahedral O atoms are bonded to the 4-coordinated Zn in parahopeite. In phosphophyllite and hopeite, only 3 of the O atoms are so bonded. Consequently the vibrational spectra of parahopeite would be predicted to be different from that of hopeite.
The Raman spectra of parahopeite in the hydroxyl stretching re-gion shows four bands centered at 3439, 3293, 3163 and 3027 cm1. Four bands are observed in the infrared spectrum at
3451, 3311, 3143 and 3043 cm1. It is predicted that there are
two non-equivalent water molecules in the unit cell of parahope-ite. These water OH stretching vibrations will show in-phase and out-of-phase behavior resulting in the prediction of four bands in the Raman and infrared spectrum. A similar structure exists for spencerite as for parahopeite [25]. The atomic arrangement in spencerite consists of complex sheets of coordination octahedra and tetrahedra around Zn and P atoms connected by layers of water molecules. Four Raman bands are observed at 3548, 3516, 3469 and 3146 cm1.
Spencerite has one hydroxyl unit and consequently the higher wavenumber band (at 3548 cm1in the Raman spectrum and at
3520 cm1in the infrared spectrum) is assigned to the symmetric
stretching vibration. The other three lower wavenumber bands are assigned to water stretching bands. The mineral tarbuttite is tri-clinic witha5.499,b5.654,c6.465 Å.,a102 Deg510,b102 Deg460, anda, 86 Deg500[26]. The space group is P1. The unit cell contains 2Zn2(OH)PO4. The atoms around Zn ions form a regular trigonal
bipyramid with a Zn–O distance of 2.04 Å. The P–O bond length in the PO4tetrahedron varies from 1.52 to 1.55 Å[27]. The Raman
spectrum of the hydroxyl stretching region of tarbuttite consists of a single sharp band centered at 3446 cm1. Scholzite is
orthorhom-bic with space group D2h5 – Pbmm (or D2h16 – Pbnm) and
a= 17.14, b= 22.19, c= 6.61 Å, a:b:c= 0.772:1:0.298, Z= 12,
d= 3.11 [28]. Scholzites have apparent stacking disorders. Thus several polytypes can exist and one of these is parascholzite[29]. It is no doubt caused by variation in the moles of water of crystal-lization[30]. The Raman spectrum of scholzite in the hydroxyl stretching region shows four bands at 3437, 3343, 3283 and 3185 cm1. Three bands were observed in the infrared spectrum
of the hydroxyl stretching region at 3425, 3310 and 3204 cm1.
Bands are observed in similar positions in the Raman and infrared spectrum of parascholzite.
The Raman spectrum over the 1800–1400 cm1spectral range
is provided in Fig. 7a. The spectrum displays a single band at 1603 cm1. This band is attributed a water bending mode. Greater
complexity is shown in this spectral region in the infrared spec-trum (Fig. 7b). The infrared bands at 1603, 1641 and 1678 cm1
Fig. 6.(a) Raman spectrum of phosphophyllite over the 2600–4000 cm1spectral
range. (b) Infrared spectrum of phosphophyllite over the 2600–4000 cm1spectral
are attributed to water bending modes. The observation of water bending modes supports the concept of water in different molecu-lar environments with different hydrogen bond strengths.
4. Conclusions
A phosphophyllite sample was studied by Electron Microscope in the EDS mode, Raman and infrared spectroscopy. The chemical anal-ysis shows chemical formula expressed by Zn2(Fe0.65, Mn0.35)P1.00
-(PO4)24(H2O), that indicate predominance of phosphophyllite end
member in a series with an unknown Zn and Mn phosphate. Aspects of the structure of phosphophyllite using vibrational spectroscopy were assessed. The intense Raman peak at 995 cm1 is assigned to the
m
1PO34 symmetric stretching mode
and the two Raman bands at 1073 and 1135 cm1to the
m
3PO34antisymmetric stretching modes. The
m
4PO34 bending modes areobserved at 505, 571, 592 and 653 cm1and the
m
2PO34bendingmode at 415 cm1. The sharp Raman band at 3567 cm1attributed
to the stretching vibration of OH units brings into question the ac-tual formula of phosphophyllite. A comparison is made with the vibrational spectra of other zinc containing phosphate minerals.
Acknowledgements
The financial and infra-structure support of the Discipline of Nanotechnology and Molecular Science, Science and Engineering Faculty of the Queensland University of Technology, is gratefully acknowledged. The Australian Research Council (ARC) is thanked for funding the instrumentation. The authors would like to acknowledge the Center of Microscopy at the Universidade Federal de Minas Gerais (http://www.microscopia.ufmg.br) for providing the equipment and technical support for experiments involving electron microscopy. R. Scholz thanks to FAPEMIG – Fundação de Amparo à Pesquisa do Estado de Minas Gerais, (Grant No. CRA – APQ-03998-10).
References
[1] R.J. Hill, J. Appl. Crystallogr. 9 (Pt. 6) (1976) 503–504. [2] R.J. Hill, Am. Mineral. 62 (1977) 812–817.
[3] H. Laubmann, H. Steinmetz, Zeitschrift fuer Kristallographie und Mineralogie 55 (1920) 523–586.
[4] P.B. Moore, Am. Mineral. 51 (1966) 168–176.
[5] I.M. Thomas, M.T. Weller, J. Mater. Chem. 2 (1992) 1123–1126. [6] C.W. Wolfe, Am. Mineral., 25 (1940) 738–754, 787–809.
[7] A. Kawahara, Y. Takano, M. Takahashi, Mineral. J. 7 (1973) 289–297. [8] F. Liebau, Acta Crystallogr. A 18 (1965) 352–354.
[9] G.Y. Chao, Refinement of the crystal structure of parahopeite, Z. Kristallogr., Kristallgeometrie, Kristallphys., Kristallchem., 130 (1969) 261–266. [10] R.J. Hill, J.B. Jones, Am. Mineral. 61 (1976) 987–995.
[11] I. Kumbasar, J.J. Finney, Mineral. Mag. J. Mineral. Soc. 36 (1968) 621–624 (1876–1968).
[12] Steinmetz, Zeitschrift für Kristallographie, Mineralogie und Petrographie 64 (1926) 405.
[13] C.W. Johnston, R.J. Hill, Mineral. Rec. 9 (1978) 20–24. [14] A. Petrov, B. Smith, C. Smith, Mineral. Rec. 32 (2001) 457–482.
[15] J.M. Richardson, A.C. Roberts, J.D. Grice, R.A. Ramik, Can. Mineral. 26 (1988) 917–921.
[16] V.C. Farmer, Mineralogical Society Monograph 4: The Infrared Spectra of Minerals, 1974.
[17] R.L. Frost, M.L. Weier, J. Mol. Struct. 697 (2004) 207–211. [18] H.G. Dill, Estudos Geológicos 19 (2009) 117.
[19] M. Arthanareeswari, T.S.N.S. Narayanan, P. Kamaraj, M. Tamilselvi, Indian J. Chem. Technol. 17 (2010) 167–175.
[20] H. Strunz, Fortschr. Mineral. 27 (1948) 313–331.
[21] R. Hochleitner, K.T. Fehr, Can. Mineral. 49 (2010) 1445–1453.
[22] O. Pawlig, V. Schellenschlager, H.D. Lutz, R. Trettin, Spectrochim. Acta Part A Mol. Biomol. Spectrosc. 57A (2001) 581–590.
[23] M.J. Castagnola, P.K. Dutta, Microporous Mesoporous Mater. 42 (2001) 235– 243.
[24] A. Whitaker, Acta Crystallogr. B: Struct. Crystallogr. Crystal Chem. B31 (1975) 2026–2035.
[25] L. Fanfani, A. Nunzi, P.F. Zanazzi, Mineral. Mag. 38 (1972) 687–692. [26] L. Fanfani, P.F. Zanazzi, Periodico di Mineralogia 34 (1965) 539–545. [27] E.A. Genkina, B.A. Maksimov, O.K. Mel’nikov, Doklady Akademii Nauk SSSR,
282 (1985) 314–317 [Crystallogr.].
[28] H. Strunz, C. Tennyson, Z. Krist. 107 (1956) 318–324. [29] K. Taxer, Zeitschrift fuer Kristallographie 198 (1992) 239–255. [30] K. Taxer, H. Bartl, Zeitschrift fuer Kristallographie 212 (1997) 197–202.
Fig. 7.(a) Raman spectrum of phosphophyllite over the 1300–1800 cm1spectral
range. (b) Infrared spectrum of phosphophyllite over the 1300–1800 cm1spectral