©Revista Brasileira de Fisioterapia
LOCALIZED MUSCLE FATIGUE: REVIEW OF THREE EXPERIMENTS
K
UMARS
Ergonomics Research Laboratory, Department of Physical Therapy, University of Alberta, Edmonton, Canada
Corresponding author: Shrawan Kumar, Ergonomics Research Laboratory, Department of Physical Therapy, University of Alberta, Edmonton, Canada T6G 2G4, e-mail: [email protected]
Received: 16/11/2005 – Accepted: 23/01/2006
ABSTRACT
Background: Fatigue considerably affects rehabilitation and ergonomics. Many approaches to this complex phenomenon, ranging from physiological to psychological, have been used to obtain meaningful fatigue measurements. However, none of the methods in the literature measure fatigue directly. It is therefore of considerable interest to determine which indirect methods best represent the state. Method: Fatiguing contraction was measured at maximum voluntary contraction (MVC) and 40% MVC in the biceps brachii, quadriceps and erector spinae muscles (three separate experiments). The most-reported objective measurements (con-traction force, median electromyographic frequency, heart rate, muscle bed oxygenation and muscle blood volume) and subjective measurements (visual analog score, body part discomfort rating and perceived exertion rate) were simultaneously recorded. The data from the three experiments underwent separate statistical analysis. Descriptive statistics, linear mixed effects (to examine force fatigue predictability) and trend analysis (with between and within-subject correlations) were calculated. Results: Univariate ANOVA on all objective variables showed that gender was a significant factor (p<0.001). All subjective and objective variables were significant (p<0.05–0.001) in predicting force fatigue. However, the percentage variability explained remained small. By combining variables, the variability explained increase to between 60.2% and 71.9%. Correlations between variables were small but significant (p<0.05–0.001). Among single variables, median electromyographic frequency was a slightly better predictor of MVC fatigue (p<0.001) and visual analog score for sub-MVC (p<0.001). Conclusion: It is desirable not to measure or predict fatigue based on one variable alone. Combining variables improves measurement and prediction. Single-variable indexing of localized muscle fatigue is problematic.
Key words: fatigue, force, electromyography, visual analog score.
RESUMO
Fadiga Muscular Localizada: Revisão de Três Estudos
Contexto: A fadiga afeta consideravelmente a reabilitação e ergonomia. Muitas abordagens a este fenômeno complexo, incluindo fisiológicas e psicológicas, têm sido utilizadas para obter medidas significativas da fadiga. No entanto, nenhum dos métodos descritos na literatura mede diretamente a fadiga. É, portanto de interesse a determinação de quais dos métodos indiretos melhor representa a condição de fadiga. Método: A fadiga por contração foi medida na contração voluntária máxima (CVM) e 40% da CVM em músculos bíceps braquial, quadríceps e músculos eretores da coluna (três avaliações independentes). As medidas objetivas mais relatadas (força de contração, freqüência mediana na eletromiografia, freqüência cardíaca, oxigenação do leito muscular e volume sangüíneo muscular) e as medidas subjetivas (escala visual analógica, avaliação de desconforto em partes do corpo e avaliação percebida do esforço) foram anotadas simultaneamente. Dados dos três estudos foram submetidos a análises estatísticas separadamente. Dados estatísticos descritivos, efeitos lineares mistos (para avaliar a previsibilidade da força de fadiga) e análise de tendências (correlação comparativa intra e extra indivíduos) foram calculadas. Resultados: ANOVA univariada em todas as variáveis objetivas mostraram que o sexo foi um fator importante (p<0,001). Todas as variáveis subjetivas e objetivas foram significantes (p<0,05–0,001) para predizer a força de fadiga. No entanto, as variações explicáveis de porcentagem permaneceram pequenas. Através da combinação de variáveis, a variabilidade explicável aumentou entre 60,2% e 71,9%. As correlações entre as variáveis foram pequenas, porém significativas (p<0,05–0,001). Entre as variáveis simples, a medida da freqüência da eletromiografia foi o fator preditivo um pouco melhor para fadiga CVM (p<0,001), assim como a escala visual analógica para sub-CVM. Conclusão: É desejável que não se meça ou prediga a fadiga com base em apenas uma variável. A combinação de variáveis melhora as medidas e predição da fadiga. Indexar uma variável simples na fadiga muscular localizada é portanto problemático.
INTRODUCTION
While the connotation of fatigue, in context, is easy to comprehend, its complexity in scientific domain is considerable. Fatigue, as it relates to human performance, is important from both physical and cognitive perspectives. Even in the physical domain, the nature of fatigue for the entire organism or a specific muscle is different. While the fatigue of organism may be described by the progressive reduction of reserve energy or the rate of its expenditures, a similar description for individual tissues is obscure. The organism fatigue can also be expressed by subjective measures, such as rate of perceived exertion¹. Individual tissues, such as connective tissues, can undergo mechanical fatigue as a result of prolonged or repetitive exertion. Muscles, on the other hand, generally undergo physiological and contractile fatigue. Whereas the experience of muscle fatigue has been wide spread, a universally valid method to determine it has not emerged.
A variety of methods have been used for measuring localized muscle fatigue. These fall under categories of objective and subjective methods. Objectively the most clear indication of fatigue is the duration for which a load can be held or decay in the force over time. The magnitude of force (strength) and duration it can be held (endurance) was initially demonstrated by Rohmert2. However, the ability to sustain a load or increase the level of strength is subjectively modifiable. Also despite the discomfort, people can maintain their contraction for a period longer than the endurance time, if motivated to do so. Thus the strength and endurance curve is obscured making it difficult to measure even force fatigue quantitatively.
Electromyography has been considered a reliable tool for an indication of localized muscle fatigue3,4. In recent years other authors have stated that the median frequency (MF) of the EMG power spectrum is sensitive to the physiological manifestation of fatigue5,6,7,8. The rate of decline of the MF during a sustained contraction was used by them as an index of muscle fatigue. An accompanying increase in EMG amplitude has also been considered a quantitative measure of fatigue5,6,9,10. Other spectral parameters of the EMG signal such as mean power frequency11, the ratio of low frequency to high frequency12 and the number of zero crossings13 have also been used in some studies as indices of muscle fatigue but were found to be more affected by noise than the measure of median frequency14. Though among EMG variables the slope of decline of the median frequency in sustained contractions has been considered as an index of fatigue, when it is compared against the standard of inability to hold or maintain a force the slope of MF decline does not mirror it5,6. On the other hand, the EMG amplitude increases with the decrease in force and this inverse relationship is variable.
Therefore, the EMG variables though helpful indicators are far from being a gold standard measure of muscle fatigue. Among other local factors which affect muscle fatigue is blood perfusion of the muscle and level of its oxygenation15. Until recently these measurements could not be made except invasively, hence largely ignored. With the advent of the Near-Infrared Spectroscopy such measurements can now be made noninvasively16,17. This is a noninvasive technique which depends on detecting continuous stream of reflected light from the light source of the device through muscle tissue. The light source of the device emits 700-900 nm wavelength light into the muscle. The heme and the myoglobin are the primary absorbing compounds of these frequencies, and the absorption of light by the heme group is detected as change in optical density. This again is a semi quantitative measure and expressed in percent change in optical density allowing us to infer the oxygenation/deoxygenation of the blood in the muscle and its blood volume. Using this device several authors have presented their data. These variables have been studied in the fore arm muscles18,19,20,21. De Blasi et al.17 studied oxygen consumption of the brachio-radialis muscle and its recovery time. They did not find any difference in the oxygen uptake of the muscle in isometric maximal voluntary contraction (MVC) with and without vascular occlusion. However, vascular occlusion resulted in complete desaturation of the haemoglobin and myoglobin in 15 to 20 seconds. A separate study reported that the oxygen desaturation rate occurring during incremental levels of isometric exercise without vascular occlusion was not proportional to the strength of the contraction19. It was reported that the tissue oxygenation at low levels of isometric contraction (5, 10, 15 and 50% MVC) of the extensor carpi radialis brevis muscle resulted in deoxygenation to 89%, 81%, 78% and 48% of the resting value, which was assigned 100%21. They stated that this oxygen depletion may be directly linked to the muscle fatigue. After a comparative study of submaximal isometric contractions (10% and 30% MVC) measured by NIRS and direct venous blood sampling suggested a caution in application of NIRS technology20. However, a host of other studies have reported oxygenation and blood volume in mainly quadriceps and erector spinae. Nonetheless, a direct comparison between the force fatigue and deoxygenation and blood perfusion has not been reported.
force fatigue and their inter-relationship in isometric MVC and 40% of MVC of the erectores spinae in sustained contractions. The study was then repeated for quadriceps and biceps brachii in different subjects.
MATERIALS AND METHODS
Equipments and Tools
EMG Devices
The EMG electrodes were active surface electrodes (Model DE-2.3, Delsys Inc., Wellesley, MA). They were made of 2 silver – silver chloride bands (10 mm long and 1 mm wide) mounted in parallel 1 cm apart in a mounded block. The block also housed a miniature preamplifier with a gain of 10 (to amplify the signal on site) and a high pass filter at 20 Hz. These electrodes were connected to amplifiers worn around waist by means of a short cable which had multiple gain. The amplifiers had a time constant of 20 ms, a low nonlinearity, and 92 dB signal to noise ratio.
Polar Vantage XL Heart Rate Monitor
The device consisted of a transmitter incorporated in a chest band worn by subjects. The transmitter relayed the heart rate to a wristwatch receiver which could collect and hold data for up to 33 hours. This heart rate data was subsequently downloaded into a data logger.
Near Infrared Spectrascope
The model MRM-96 and the accompanying software NIRCOM from NIM, Inc., Philadelphia was used in this study. This was a noninvasive blood oxygen and blood volume trend monitor designed to measure data from the muscle bed. It was a continuous wave spectrometer that operated by transmitting light into the skin below the probe, collecting reflected light, and processing the signals by computing optical density from the measurements. The light that was not absorbed or scattered away from the detector, was collected by the photo-diode detectors in the probe and converted to digital data. The MRM-96 emitted lights of wave lengths 760 and 850 nm which were indicators of the relative quantities of oxy- and deoxy-haemoglobin. With the relative change in quantities of these compounds the light absorbed by them changed as well. The oxygenation level was indicated by the difference between two lights and the blood volume in the muscle bed was indicated by the sum of the two lights.
Load Cell and Force Monitor
A load cell (LCCB-IK) from Omega, Laval, PQ, was connected to the Force Monitor (Prototype Design, Ann Arbor, MI). The tension load cell fed to the Force Monitor which conditioned and amplified the signal and displayed the reading
through a LED display. The output of the Force Monitor was fed to the Data Translation A to D card (DT2801A) of the computer for continuous sampling of the signals.
Subjective Measures
Visual Analog Scale
The subjects were provided a 10 cm long horizontal line with anchors at the two ends reading “not fatigued at all” and “worst imaginable fatigue”. The subjects crossed the horizontal line according to their feeling at the time of measurement. For MVC the subjects were given this test before the start and after the end of the contraction. However, for 40% the subjects were given this test at the start and every minute thereafter till the end of the contraction.
Body Part Discomfort Rating (BPDR)
The subjects were provided with a blank line diagram of the entire body and asked to place a “x” on the part of the body where they felt discomfort due to fatigue. Subsequent to placing an “x” they were asked to rate their fatigue on a scale of 1 to 10, 1 being no fatigue and 10 being the maximal fatigue. Like the VAS scoring, this test was also given twice for MVC and one minute interval for 40% MVC.
Rate of Perceived Exertion
The rate of perceived exertion (RPE) was filled out by the subjects. The RPE was scored on a 20 point scale. Like other subjective measures, the subjects determined their RPE only twice. RPE was administered at the same times as the other subjective measures.
Common Procedures
MVC for trunk extension without changing the postural preset angle. The subjects were instructed to build their strength to a maximum gradually within the first two seconds and maintain the maximal level of contraction for another three seconds at which time the contraction was terminated. Subsequent to this contraction the subjects were given a five-minute rest. This strength value was taken at the subjects 100% effort.
The subjects, after a five-minute rest, acquired the task position described above. In front of the subject a visual feedback mechanism was adjusted to show their 40% of isometric MVC. The subjects were instructed to build their strength to a maximum gradually within the first two seconds and maintain the maximal level of contraction for another three seconds at which time the contraction was terminated. Subsequent to this contraction the subjects were given a five-minute rest. This strength value was taken at the subjects 100% effort.
The subjects, after a five-minute rest, acquired the appropriate task position. In front of the subject a visual feedback mechanism was adjusted to show their 40% of isometric MVC. The subjects were instructed to exert in isometric mode such that their contraction indicator reached one displayed on the screen and they maintained it as long as they could without the force level dropping below 35% MVC. After this exertion the subjects were provided a rest of 30 minutes at which time they were asked to exert their MVC and hold it in maximal effort as long as they could.
Subjects
Erector Spinae
Six healthy male and six healthy female subjects volunteered with a mean (standard deviation) age, weight and height of 32.5 (4.7) years, 82.7 (9.0) kg and 170 (5.2) cm form males and 35.6 (15) years, 61.1 (8.8) kg, and 166.88 (7.4) cm for females.
Quadriceps
Ten healthy male and ten healthy female subjects with mean (standard deviation) age, weight and height of 28.5 (4.4) years, 76.3 (8.7) kg and 178.3 (5.5) cm; and 29.0 (8.7) years, 58.1 (6.8) kg, and 164 (8.0) cm for male and female samples respectively.
Biceps Brachii
Nine healthy male subjects with a mean (standard deviation) age, weight and height of the experimental sample was 25.7 (2.1) years, 78.9 (9.5) kg and 180.1 (4.3) cm respectively.
Task
Trunk Extension
The subjects stood in front of an iron chain anchored to the floor with an intervening load cell at one end and an industrial size handle at the other. The subjects flexed their trunks by 45° in stooping posture. The level of the handle was adjusted individually to the height of the subject’s hands. In this position, the subjects provided their erector spinae contractions according to the protocol described above.
Knee extension
The subjects were required to give their isometric contractions of knee extension without changing the postural preset angle (knee and hip angles 90°) while seated on a Quadriceps Strengthening Table.
Elbow Flexion
The subjects stood upright in front of an iron chain anchored to the floor with an intervening load cell and a round handle at the upper end. The subjects flexed their right (dominant) arms by 90° at the elbow while the upper arms hung vertically down from the shoulders. The level of the handle was adjusted individually to the height of the subject’s hand. In this position, the subjects were required to give their isometric contractions of elbow flexion without changing the preset angle at the wrist, elbow or shoulder according to the protocol described above.
Specific Procedures: Trunk extension
Their erector spinae were palpated and the pre-calibrated NIRS probe was applied on the right erector spinae muscle at L3 level. Adjacent to the NIRS probe, bipolar surface electrodes were applied to skin over the muscle after abrading it with alcohol-acetone soaked paper towel at T10 and L1 levels on the right side and T10 and L3 levels on left erector spinae. After application of the probe and the electrodes, the subjects were grounded and it was ensured that the two pre-calibrated measuring devices were working as desired.
Specific Procedure: Knee extension
Subjects’ vastus lateralis and vastus medialis were palpated and the pre-calibrated NIRS probe was applied on the right vastus lateralis. Adjacent to the NIRS probe, bipolar surface electrodes were applied to the skin over the vastus lateralis and vastus medialis 2 cm and 4 cm proximal to the myotendinous junction after abrading it with alcohol-acetone soaked paper towel. After application of the probe and the electrodes, the subjects were grounded and it was ensured that the two pre-calibrated measuring devices were working as desired.
Specific Procedures: Elbow Flexion
probe, a single bipolar surface electrode was applied to skin over bicep brachii after abrading it with alcohol-acetone soaked paper towel. After application of the probe and the electrode, the subjects were grounded and it was ensured that the two pre-calibrated measuring devices were working as desired. Data Acquisition
The suitably conditioned and amplified data from the load cell, NIR Spectroscope and EMG amplifier were sampled at 1 kHz for the entire duration of isometric MVC, 40% MVC fatiguing contraction and maximal fatiguing contraction continuously. These data were fed to Data Translation (DT 2801A) A to D board for conversion into digital values. These were then stored in the computer memory. A Pentium computer was used as the controller and storage device. The data acquisition was carried out using a specially written software for data collection and controlling the experiment. Data Analysis
The data of the three experiments were analyzed separately. The force trace was smoothed using 7-point smoothing routine repeated once. From this trace the peak value was read and the average value calculated. Task duration for each individual was divided into 10 equal parts and values corresponding to each decile of the task durations were extracted. The decile values of all subjects were pooled within each experiment separately and descriptive statistics calculated for further statistical analysis. A similar processing was done for heart rate, muscle blood oxygenation, muscle-bed blood volume, and EMG amplitude. The EMG signals were subjected to Fast Fourier Transform analysis to obtain the median frequency according to methods described in Kumar and Narayan5 and Kumar et al.6. These quantitative values were used to develop magnitude of the signal and the task decile plot.
The statistical analysis consists of four sub – analysis: Descriptive statistics of all characteristics (ii) Analysis based on linear mixed effects to examine the predictability of force through other characteristics such as blood volume, oxygen intake, RPE, VAS and EMG measurements; (iii) Trend analysis to examine progressive change with increasing task duration, and (iv) Between subject and within subject correlation analyses to study interrelationship among measurements.
Linear Mixed Effects Model
A linear mixed effects model with subjects as a random factor and task cycle as the repeated factor were fitted to predict Force under both MVC and 40% MVC contractions. In the model ‘subjects’ was used as a random component to incorporate repeated measure nature of the experiment in the analysis. Further, it should be noted that all measured characteristics, except gender, are not controlled by the design.
Hence, to study force through the remaining characteristics, like blood volume, oxygen intake, RPE, VAS, a conditional linear mixed model was adopted by considering force as the dependent variable. Pearson Product Moment Correlations among all variables based on both within-subjects covariance and between-subjects matrices were calculated between the magnitude of force and the magnitude of each of the measured variables to determine the marginal strength of correlation of each independent variable with force. A matrix of such correlations was developed for MVC and 40% MVC variables to glean the interrelationship between all independent variables. After eliminating non-significant predictors in the analysis the final model for predicting force was given for both MVC and 40% MVC contractions.
Force and Time
Trunk Extension
The mean maximal voluntary contraction forces were 899 N (238) N and 431 N (135) N for male and female samples respectively. The mean durations for which the maximal contraction effort could be sustained was 68.1 (39.9) s and 72.3 (37.0) s for males and females respectively though the force kept declining through the hold. Similarly the mean durations for 40% MVC were 150.6 N (85.7) s and 139.0 (104) s respectively for male and female samples. Knee Extension
The mean maximal voluntary contraction forces (standard deviations) for the experimental sample of male and female experimental sample of subjects were 345.7 (125) N and 220.3 (47.4) N respectively. The maximal voluntary isometric contraction of the quadriceps was held for 85.0 (25.1) s and 87.0 (21.5) s by male and female samples respectively. The holding time for 40% MVC contraction for male and female samples were 66.4 (23.9) s and 56.7 (29.0) s, respectively.
Elbow Flexion
The mean maximal voluntary contraction force of the experimental sample for elbow flexion was 197.6 N (S.D. 25.9 N). The mean duration for which the maximal contraction effort could be sustained was 58.1 s (S.D. 17.6 s), though the force exerted kept on declining through the entire duration. Similarly the mean 40% force recorded was 79.0 N (S.D. 10.4 N) and the mean duration for sustaining this load was 275 s (S.D. 35.8 s).
RESULTS
Trunk Extension
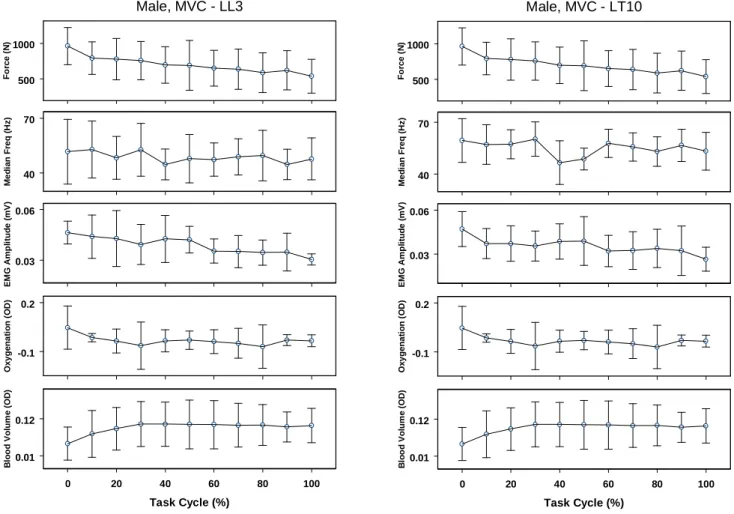
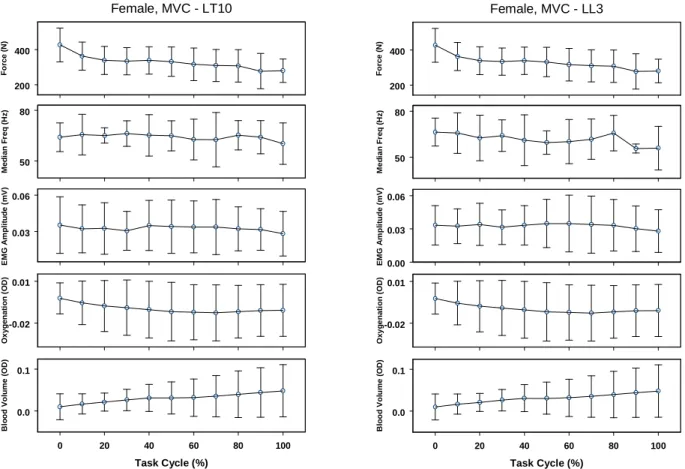
At the maximal voluntary contraction the continuous monitoring at 1 kHz of the force, EMG, blood oxygenation and blood volume provided continuous data of the lumbar and thoracic erector spinae are presented for males and females in Figures 1 and 2. The means and standard deviations were presented at every 10% task intervals. A spectral plot of the male lumbar and thoracic erector spinae in MVC fatiguing contraction is shown in Figure 3.
During the task, the median frequencies declined to 96%, 92%, 82% and 91% respectively. The blood oxygenation and blood volumes declined by 205% and 257%. The EMG amplitude for left lumbar, left thoraic, right lumbar and right thoracic among females declined to 75%, 81%, 76%, and 77% respectively. Their median frequencies declined to 87%, 91% and 98% respectively. Interestingly, the blood oxygenation declined only by 89% and the blood volume increased to 240%.
Figure 1. The objective measures at the lumbar and thoracic regions among males during fatiguing maximal voluntary contraction in trunk extension
( LL3 – left lumbar erector spinae at 3rd lumbar vertebral level, LT10 – left lumbar ES at 10th thoracic vertebral level).
500 1000
Fo
rc
e
(
N
)
Male, MVC - LL3
40 70
Me
d
ian
F
re
q
(H
z
)
0.03 0.06
EM
G
A
m
p
li
tu
d
e
(m
V
)
-0.1 0.2
O
x
yg
e
n
at
io
n
(
O
D)
0 20 40 60 80 100
Task Cycle (%) 0.01
0.12
Bl
o
o
d
V
o
lu
m
e
(
O
D
)
500 1000
Fo
rc
e
(
N
)
Male, MVC - LT10
40 70
Me
d
ian
F
re
q
(H
z
)
0.03 0.06
EM
G
A
m
p
li
tu
d
e
(m
V
)
-0.1 0.2
O
x
yg
e
n
at
io
n
(
O
D)
0 20 40 60 80 100
Task Cycle (%) 0.01
0.12
Bl
o
o
d
V
o
lu
m
e
(
O
D
)
Knee Extension
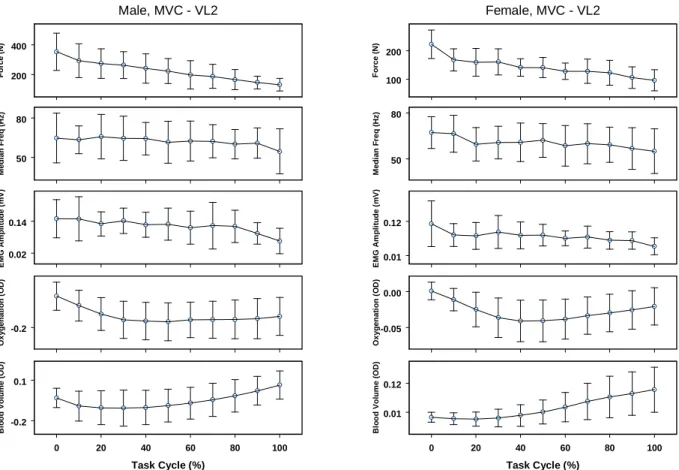
The continuous data of the force, EMG amplitude, EMG
median frequency, blood oxygenation and blood volume sampled at 1 kHZ are presented in Figures 4 and 5. The means and standard deviations are presented at intervals corresponding to 10% of each task. A steady decline in force was mirrored most closely by the EMG amplitude and less closely by the median frequency. Spectral plots of the vastus lateralis and vastus medialis muscle in MVC fatiguing contraction of males are presented in Figure 6. The spectral plots show a narrowing of the frequency band and decrease
200 400
For
c
e
(
N
)
Female, MVC - LT10
50 80
Me
d
ia
n
F
req
(
H
z
)
0.03 0.06
E
M
G
Am
pl
it
ude
(
m
V
)
-0.02 0.01
O
x
yg
en
at
io
n
(
O
D
)
0 20 40 60 80 100
Task Cycle (%)
0.0 0.1
Bl
o
od V
o
lu
m
e
(
O
D)
200 400
For
c
e
(
N
)
Female, MVC - LL3
50 80
Med
ian
F
re
q
(
H
z
)
0.00 0.03 0.06
EM
G A
m
p
li
tu
d
e
(m
V)
-0.02 0.01
O
x
yg
en
a
tio
n
(
O
D
)
0 20 40 60 80 100
Task Cycle (%)
0.0 0.1
Bl
o
od V
o
lu
m
e
(
O
D)
Figure 2. The objective measures at the lumbar and thoracic regions for females during fatiguing maximal voluntary contractions (LL3 – left lumbar
ES at 3rd lumbar vertebral level, LT10 – left lumbar ES at 10th thoracic lumbar vertebral level).
Figure 3. Spectral plots for male lumbar and thoracic regions during fatiguing maximal voluntary contractions.
LT10
LL3
200 400 For c e ( N )
Male, MVC - VL2
50 80 Me d ia n F req ( H z ) 0.02 0.14 E M G Am pl it ude ( m V ) -0.2 O x yg en at io n ( O D )
0 20 40 60 80 100
Task Cycle (%)
-0.2 0.1 Bl o od V o lu m e ( O D) 100 200 For c e ( N )
Female, MVC - VL2
50 80 Me d ia n F req ( H z ) 0.01 0.12 E M G Am pl it ude ( m V ) -0.05 0.00 O x yg en at io n ( O D )
0 20 40 60 80 100
Task Cycle (%)
0.01 0.12 Bl o od V o lu m e ( O D)
Figure 4. The objective variables measured at vastus lateralis (2 cm. from muscle-tendon junction) in males and females during maximal isometric
knee extension fatigue.
200 400 For c e ( N )
Male, MVC - VM2
50 80 Me d ia n F req ( H z ) 0.0 0.1 E M G Am pl it ude ( m V ) -0.2 O x yg en at io n ( O D )
0 20 40 60 80 100
Task Cycle (%)
-0.2 0.1 Bl o od V o lu m e ( O D) 100 200 For c e ( N )
Female, MVC - VM2
50 80 Med ian F re q ( H z ) 0.06 0.14 EM G A m p li tu d e (m V) -0.05 0.00 O x yg en a tio n ( O D )
0 20 40 60 80 100
Task Cycle (%)
0.01 0.12 Bl o od V o lu m e ( O D)
Figure 5. The objective variables measured from vastus lateralis (2 cm. from muscle-tendon junction) in males and females during maximal
VL2
VL4
Male, MVC
VM2
VM4
Elbow Flexion
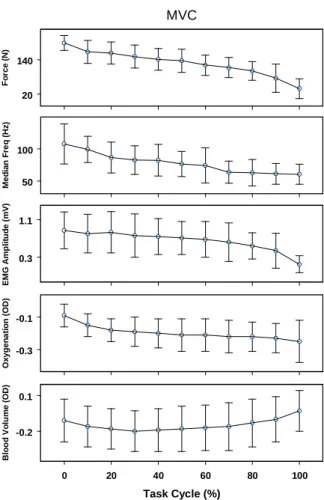
At maximal voluntary contraction the continuous monitoring at 1 kHz of the force, EMG, blood oxygenation and blood volume provided continuous data presented in Figure 7. The means and standard deviations are presented at every 10% task intervals. A steady decline in force was mirrored most closely by the median frequency of the recorded EMG. The EMG amplitude also declined steadily and progressively for up to 80% of the task cycle beyond which it dropped more rapidly.
Figure 6. Spectral plots of vastus lateralis and vastus medialis (2 cm. from the muscle-tendon junction) in males.
Objective Variables at 40% MVC Fatiguing Contraction
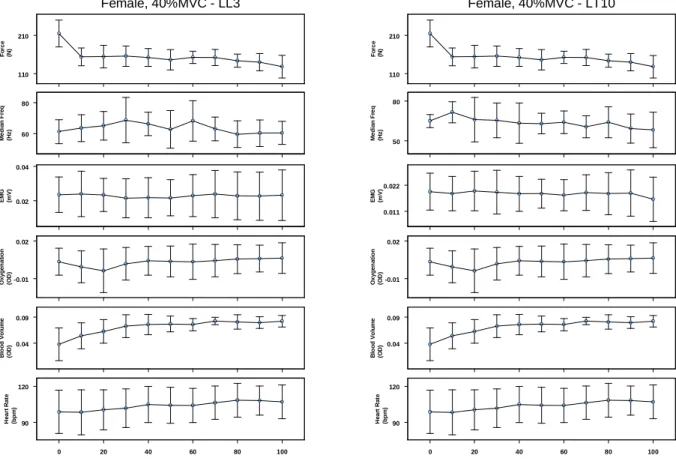
Trunk Extension
In this contraction the patterns in variation of measures are presented in Figures 8 and 9. With a progressive and gradual
Figure 7. The pattern of the objective variable’s response from the biceps brachii in maximal isometric effort of elbow flexion.
Figure 8. The pattern of the objective variable’s response from the lumbar and thoracic erector spinae. in males during 40% MVC fatiguing effort
for trunk extension.
300 600 Fo rc e (N )
Male, 40%MVC - LL3
40 60 M e d ian F req (H z ) 0.012 0.024 EM G (m V ) -0.2 0.1 O x yg en a ti o n (O D) 0.0 0.2 B loo d Vo lum e (O D)
0 20 40 60 80 100 90 130 He a rt R a te (b p m ) 300 600 Fo rc e (N )
Male, 40%MVC - LT10
50 70 Me d ia n F re q (H z ) 0.015 0.030 EM G (m V) -0.2 0.1 O x yg en at io n (O D) 0.0 0.2 B loo d V ol u m e (O D )
0 20 40 60 80 100 90 130 He a rt R a te (b p m ) 20 140 Fo rc e ( N ) MVC 50 100 M e di a n Fr e q ( H z ) 0.3 1.1 EM G A m p lit u d e (m V) -0.3 -0.1 O x yg en a ti o n ( O D )
0 20 40 60 80 100
Task Cycle (%)
Knee Extension
The variable of force, EMG amplitude, median frequency, blood oxygenation, blood volume and heart rate recorded are presented in Figures 10 and 11. Also the subjective variables of visual analog score and the rate of perceived exertion measured at discrete intervals and interpolated in between are plotted in Figures 10 and 11 along with contraction period the force value declined to 23% in males and 24% in females. The EMG score of VL2, VL4, VM2, and VM4, in males dropped to 38%, 31%, 29.4% and 28% respectively. The corresponding median frequency values were 100%, 100%, 94.8% and 99%. In females, the EMG amplitude of VL2, VL4, VM2, and VM4 declined to 49%, 50%, 43.4% and 48%, while the corresponding median frequencies declined to 82%, 88%, 90.7% and 95%. The spectral plots of the vastus lateralis muscle did not show a clear and decisive drop in median frequency in both gender (Figure 12). The blood oxygenation initially dropped rapidly but remaining stable between 20% - 80% of the task cycles and subsequently demonstrated a small rise. The muscle bed blood volume, however, after an initial drop kept on increasing. The heart rate, VAS score and RPE score, after an initial stable
Elbow Flexion
The oxygen uptake, ventilation volume, heart rate, visual analog scale score and the RPE score were obtained at one-minute intervals. Between the intervals the data were interpolated and the values corresponding to appropriate task percentile value extracted from the interpolation. The pattern in variation of measures is presented in Figure 13. With a progressive and gradual decline in force there was a gradual and progressive decline in the MF of the EMG but its amplitude remained relatively stable (Figure 13). The spectral plot of the EMG of the biceps brachii in this contraction did not demonstrate the same progressive shift of MF as in MVC contractions. The optical density of the blood oxygen and the blood volume continued to increase indicating progressive increase in blood volume as well as blood oxygen levels (Figure 13). The oxygen uptake, ventilation volume, heart rate, VAS score and RPE score all progressively increased with a progressive decrease in force (Figure 13).
Figure 9. The pattern of the objective variables from the lumbar and thoracic erector spinae in females during 40% MVC fatiguing effort of trunk
extension.
110 210
Fo
rc
e
(N
)
Female, 40%MVC - LL3
60 80
M
e
d
ian
F
req
(H
z
)
0.02 0.04
EM
G
(m
V)
-0.01 0.02
O
xyg
en
a
ti
o
n
(O
D)
0.04 0.09
B
loo
d V
ol
u
m
e
(O
D
)
0 20 40 60 80 100 90
120
He
a
rt
R
a
te
(b
p
m
)
110 210
Fo
rc
e
(N
)
Female, 40%MVC - LT10
50 80
Me
d
ia
n
F
re
q
(H
z
)
0.011 0.022
EM
G
(m
V)
-0.01 0.02
O
x
yg
en
at
io
n
(O
D)
0.04 0.09
B
loo
d V
ol
u
m
e
(O
D
)
0 20 40 60 80 100 90
120
He
a
rt R
a
te
(b
p
m
)
100 200 Fo rc e (N )
Male, 40%MVC - VM2
50 80 Me d ia n F re q (H z ) 0.04 0.10 EM G (m V) -0.2 O x yg en at io n (O D ) -0.1 0.2 B loo d V o lu m e (O D ) 80 110 He a rt R a te (b p m ) 4 9
VAS (cm
)
T k C l (%)
10 20
RPE
0 20 40 60 80 100
60 120 Fo rc e (N )
Female, 40%MVC - VM2
60 80 Me d ia n F re q (H z ) 0.04 0.09 EM G (m V) -0.05 0.00 O xyg en a ti o n (O D ) 0.0 0.1 B loo d V o lum e (O D ) 80 110 He a rt R a te (b p m ) 1 7
VAS (cm
)
T k C l (%)
10 20
RPE
0 20 40 60 80 100
Figure 10. The pattern of objective variable from the VL2 muscle of males and females in 40% MVC fatiguing effort of knee extension (VL2
– vastus lateralis at 2 cm. above the musculotendinous junction).
100 200 Fo rc e (N )
Male, 40%MVC - VL2
50 80 M e d ian F req (H z ) 0.04 0.10 EM G (m V ) -0.2 O xyg en a ti o n (O D ) -0.1 0.2 B loo d Volu m e (O D ) 80 110 He a rt R a te (b p m ) 4 9 VA S (c m )
T k C l (%)
10 20
RPE
0 20 40 60 80 100
60 120 Fo rc e (N )
Female, 40%MVC - VL2
50 80 Me d ia n F re q (H z ) 0.04 0.10 EM G (m V ) -0.05 0.00 O x yg en at io n (O D ) 0.0 0.1 B loo d Volum e (O D ) 80 110 He a rt R a te (b p m ) 1 7 VA S (c m )
T k C l (%)
10 20
RPE
0 20 40 60 80 100
Figure 11. The pattern of the objective variables from VM2 muscle for male and female subjects in 40% MVC fatiguing effort of knee extension
VL2
Male, 40%MVC
VL2
Female, 40%MVC
Figure 12. Spectral plots of VL2 muscle in 40% MVC fatiguing
contraction of males and females (VL2-vastusw lateralis at 2 cm. above the musculoskeletal junction).
50 100
Fo
rc
e
(N
)
40% MVC
50 100
M
e
di
an
Fr
eq
(H
z
)
0.2 0.4
EM
G
(m
V
)
-0.2 0.1
Oxygen
a
ti
o
n
(OD
)
-0.1 0.3
B
lo
od V
ol
um
e
(O
D
)
90 130
H
e
a
rt R
a
te
(bp
m
)
1 7
VA
S
(cm
)
0 20 40 60 80 100
Task Cycle (%)
10 20
RP
E
Figure 13. The pattern of the objective variables in 40% MVC fatiguing
contraction of elbow flexion.
Subjective Variables
The scores of visual analog scale and rate of perceived exertion is presented in Table 1. In both genders the scores for both visual analog scale and rate of perceived exertion were higher in 40% maximal voluntary contraction. The body part discomfort rating showed that the maximum discomfort was felt in low back with scores between 6.75 to 7.83 on a 10 point scale with the exception of females in MVC fatiguing contraction for females where the score was a mere 3.5. The behaviour of subjective variables for knee extension and elbow flexion is similar to those of the trunk extension.
Statistical Analyses
Trunk Extension
The summary tables of analyses of variance with repeated
Table 1. Subjective variable scores due to the fatiguing isometric Spinal extensor efforts.
Table 2. ANOVA Summary Table for main effects in MVC trunk extension contraction.
Table 3. ANOVA Summary Table for main effects in 40% MVC effort for trunk extension.
VAS (cm) RPE
Mean Std
Deviation Mean Std Deviation Male MVC 5.32 2.21 15.33 1.63
40%
MVC 6.67 2.87 16.17 2.64 Female MVC 4.2 2.36 14 2.45
40%
MVC 6.95 1.33 14.67 1.63
Variable Source dF F-value Significance
EMG-MF Gender 1 6.829 0.009
Task Percentile 10 3.045 0.001
EMG-mV Gender 1 110.833 0.001
Task Percentile 10 6.702 0.001
Muscle 3 7.421 0.0001
Change in Force Gender 1 183.127 0.001
Task Percentile 10 15.634 0.001
Change in Gender 1 60.646 0.001
Blood Volume Task Percentile 10 5.909 0.001
Blood Oxygen Gender 1 40.007 0.001
Heart Rate Gender 1 26.553 0.001
Task Percentile 10 7.679 0.001
Variable Source dF F-value Significance
Median Frequency Task Percentile 10 2.096 0.024
Muscle 3 4.288 0.005
EMG-Amp Gender 1 34.031 0.001
Task Percentile 10 4.407 0.001
Channel 3 4.194 0.006
Force Gender 1 267.465 0.001
Task Percentile 10 25.009 0.001
Blood Volume Gender 1 6.601 0.010
Blood Oxygen Gender 1 46.799 0.001
Heart Rate Gender 1 88.053 0.001
Percent 10 10.085 0.001
For MVC contractions, there was a significant interaction between EMG amplitudes and gender. Hence separate models were fitted for males and females. For males the significant predictors are (in the order of significance) EMG LL3, interaction between MFRL1 and MFRT10, BV and EMGRL1, while for females similar predictors are BV, EMG LL3, EMG RL1 and the interaction between EMG RL1 and EMG RT10. For the fitted models the readers are directed to Kumar et al.22 which explain 98% and 97% of variance among males and females respectively for MVC. The regression models
for 40% MVC trunk extension explain 96% and 97% of variance for males and females respectively.
Table 4. Univariate ANOVA (with repeated measures). Summary table for MVC fatiguing contraction.
Table 5. Univariate ANOVA (with repeated measures). Summary table for 40% MVC fatiguing contraction. Univariate for subjects
indicates significant and progressive change with increasing task duration despite the effort of the subjects to maintain at a constant level. Identical results were obtained in 40% MVC fatiguing trials where in addition to the dependent variable of force the independent variables blood oxygenation, blood volume, EMG amplitude, MF, heart rate, RPE score and VAS score showed significantly different magnitude of these variables at different task cycles within the subject (p<0.001) and between the subjects (p<0.001).Thus clearly in both contractions as the time progressed the fatigue progressed. The set of independent variable for this case consists of blood volume, blood oxygenation, heart rate, EMG amplitude, EMG median frequency, visual analog scale, rate
of perceived exertion and body part discomfort rating. The final frequency model is given below.
Force = 140.92 + 53.17 EMG amplitude - 41.9 blood volume + 0.045 blood oxygenation - 21.15 VO2 - 0.64 heart rate + 0.68 rate of perceived exertion + 1.39 discomfort rating of the upper arm.
The order of importance of significant predictors was determined based on absolute values of t-statistics. The goodness-of-fit of the final model was evaluated using reduction in mean squared error. An 80% reduction in mean squared error with significant predictors was observed compared to the model without any significant predictors.
S F Hypo dF Sig
Force
2133.0 6 .001 Within sub
O2 759222.1 6 .001 Within sub
BV 1871.1 6 .001 Within sub
MF 5093.4 6 .001 Within sub
Ampl. 22266.2 6 .001 Within sub
F H y p o -d F S ig
F o rc e
3 6 1 8 7 .2 6 .0 0 1 W it h in
O 2 7 4 6 7 .7 6 .0 0 1 W it h in
B l. V o lu m e 8 5 8 7 6 .0 0 1 W it h in
E M G A m p l. 1 3 0 1 9 .9 6 .0 0 1 W it h in
M F 4 0 5 4 .4 6 .0 0 1 W it h in
V O 2 1 5 1 1 .9 6 .0 0 1 W it h in
H R 3 1 8 5 1 .9 6 .0 0 1 W it h in
V e n t. 2 2 9 8 3 .2 6 .0 0 1 W it h in
R P E 3 0 2 5 5 .0 6 .0 0 1 W it h in
Correlation Analysis
Trunk Extension
The within subject correlation coefficients between force and other independent variables for maximal voluntary contraction, and 40% maximal voluntary contractions for trunk extension were similar to those of knee extension and elbow flexion.
Knee Extension
The correlation coefficients (based on between - subject covariance matrix) between the force and other measured variables at MVC and 40% MVC fatiguing contractions in knee extension are presented in Tables 6 and 7. In the MVC fatiguing contraction there was a significant negative correlation between force and muscle bed blood volume (r = -0.833; p<0.01) and muscle bed oxygenation (r =-0.772; p<0.01). The correlation coefficient between the force and EMG amplitudes of vastus lateralis and vastus medialis recorded at two different sites ranged between r = 0.583 to 0.892 (p<0.01); this correlation between the force and median frequencies (MF) measured at the same sites ranged between r = 0.035 to 0.423. This clearly demonstrates that the force is more strongly correlated with EMG amplitude than the MF, which traditionally has been considered a measure of fatigue. It is also evident that most of the independent variables are generally significantly intercorrelated.; in particular, muscle bed oxygenation and muscle bed blood volume (r=0.775;p<0.01), and mutual correlations among EMG amplitude measured at four sites ranged from 0.475 to 0.793,p<0.01).
The correlation matrix for the 40% MVC fatiguing contraction presents a similar picture with significant negative correlation between force and blood volume (r = -0.380; p<0.05) and blood oxygenation level (r = -0.724; p<0.01). However, a slightly stronger correlation was observed with the EMG amplitude measured at four sites varying from r
Table 6. Correlation between force and other measured variables in maximal voluntary contraction.
Oxygen Blood Vol
Force (optical (optical EMG EMG EMG EMG MF MF MV MF Gender Variables Statistics (N) density) density) VL2 VL4 VM2 VM4 VL2 VL4 VM2 VM4 Male Force (N) Pearson Corr 1 -.221** -.637** .452** .790** .617** .654** .445** .213** .155** .170**
Oxygen Pearson Corr 1 .625**
-.317**
-.394**
-.425**
-.387** -.170** -.328** -.082**
-.325**
Blood Vol Pearson Corr 1
-.449**
-.525**
-.482**
-.620** -.210** -.213** -.082**
-.182** EMG-VL2 Pearson Corr 1 .297** .440** .375** -.187** .460** NS NS EMG-VL4 Pearson Corr 1 .623** .742** .451*** .081** NS .124**
EMG-VM2 Pearson Corr 1 .690** .440** .254** .277** .428**
EMG-VM4 Pearson Corr 1 .344 NS .139** .233**
MF-VL2 Pearson Corr 1 .177 .563** .471**
MF-VL4 Pearson Corr 1 .355** .471**
MF-VM2 Pearson Corr 1 .536**
MF-VM4 Pearson Corr 1
= 0.703 to 0.915; p<0.01). These were stronger values compared to those obtained for the MF (r = 0.238 to 0.506). The variables of heart rate, VAS, RPE, and thigh discomfort correlated negatively with force but none of them are significant (HR r = -0.242 ; VAS r = -0.119, RPE = -0.205, thigh discomfort r = -0.255).(Tables 6 and 7).
Elbow Flexion
Table 7. Correlation between different variables between subjects at 40%MVC of knee extension
Force (N)
Blood Volume
(od)
Oxygen (od)
Heart Rate (bpm)
Vas (cm) RPE
BPD thigh
MF VL2 (Hz)
MF VL4 (Hz)
MF VM2 (Hz)
MF VM4
(Hz) EMG
VL2 (mV)
EMG VL4 (mV)
EMG VM2 (mV)
EMG VM4 (mV) Force (N) 1.000 -0.380 -0.724 -0.242 0.119 0.205 0.255 0.344 0.444 0.238 0.506 0.703 0.915 0.773 0.705 Blood Volume (od) 1.000 0.816 0.209 -0.115 -0.175 -0.102 -0.271 -0.193 -0.289 -0.547 -0.614 -0.322 -0.683 -0.623 Oxygen (od) 1.000 0.464 -0.059 -0.211 -0.274 -0.452 -0.527 -0.412 -0.789 -0.844 -0.695 -0.860 -0.820 Heart Rate (bpm) 1.000 -0.174 0.100 -0.207 -0.220 -0.654 -0.166 -0.622 -0.248 -0.324 -0.267 -0.159 Vas (cm) 1.000 0.472 0.530 -0.060 -0.051 0.131 0.040 0.141 0.277 0.201 0.219 RPE 1.000 0.638 -0.141 -0.175 0.023 -0.022 0.202 0.407 0.225 0.365 BPD thigh 1.000 0.030 0.287 0.202 0.278 0.406 0.371 0.442 0.487 MF VL2 (Hz) 1.000 0.457 0.638 0.666 0.254 0.356 0.375 0.252 MF VL4 (Hz) 1.000 0.385 0.625 0.520 0.354 0.472 0.269 MF VM2 (Hz) 1.000 0.639 0.298 0.274 0.477 0.258 MF VM4 (Hz) 1.000 0.550 0.548 0.755 0.625 EMG VL2 (mV) 1.000 0.582 0.833 0.836 EMG VL4 (mV) 1.000 0.717 0.735 EMG VM2 (mV) 1.000 0.891
EMG VM4 (mV) 1.000
Table 8. Correlation between force and measured variables for MVC fatiguing contractions in elbow flexion (p<0.001).
Table 9. Correlation between force and measured variables for 40% MVC fatiguing contractions in elbow flexion (p<0.001).
Force
(N)
Oxygenation
(OD)
Blood
Volume
(OD)
Med. Freq
(Hz)
EMG
Amp
(mV)
Heart
Rate
(bpm)
VAS (cm) RPE BPD
Upper
Arm
Force Correlation 1.00 -.41 -.72 .33 .15 -.33 -.57 -.42 -.47
Oxygenation (OD) Correlation 1.00 .41 .266 -.03 -.28 .31 .1 .1
Blood Volume (OD) Correlation 1.00 -.09 -.3 .32 .63 .47 .56
Med. Freq (Hz) Correlation 1.00 -.17 -.56 -.45 -.5 -.51
EMG Amp (mV) Correlation 1.00 .04 -.14 -.14 -.19
Heart Rate (bpm) Correlation 1.00 .60 .65 .67
VAS (cm) Correlation 1.00 .923 .87
RPE Correlation 1.00 .85
BPD Upper Arm Correlation 1.00
Force
(N)
Oxygenation
(OD)
Blood
Volume
(OD)
Med.
Freq.
(Hz)
EMG
Amp
(mV)
Force (N)
Correlation 1.00 .46 .30 .91 .39
Oxygenation (OD) Correlation 1.00 -.35 .45 -.19
Blood Volume (OD) Correlation 1.00 .18 .61
Med. Freq. (Hz) Correlation 1.00 .36
DISCUSSION
Localized muscle fatigue has been considered to be of considerable significance in possible injury mechanisms23. Strenuous exercise, which includes fatiguing contractions causes disturbance of muscle homeostasis. Structural abnormalities in skeletal muscles of humans following stressful exertions have been reported24,25,26,27. Progressive deterioration of muscle performance occurs with fatigue. Fatigue may be modulated through many different mechanisms and at many different sites. Possible sites and mechanisms include neurons, axon, terminal bouton, depletion of neurotransmitter, refractory response of the muscle cell membrane, depletion of ca++ from the sarcoplasmic reticulum, depletion of ATP and its supply to the muscle cells.
With the onset and progression of fatigue, as indexed by the force magnitude and muscle discomfort, there is an initial reduction in EMG amplitude followed by an increment and eventual dissipation associated with cessation of activity. This suggests that the electrophysiological mechanism of muscle contraction remains intact till the end. It is due to a significant decline in force output that the synchronization of motor unit occurs12,28 to maximize the electrical impact on the contractile phenomenon. Univariate ANOVA for all objective variables revealed that the gender was a strong determinant. Thus females generated significantly less force on muscle contraction. Also, the EMG amplitude, MF, blood volume and blood oxygenation were significantly different between males and females (p<0.001), for both MVC and 40% MVC contractions. In 40% MVC, men and women had significant differences in the heart rate as well. Clearly, men are heavier than women with significantly greater body mass. Force generation is dependent on the cross sectional area of the muscles which is greater in men, explaining this difference. Similarly, the larger cross sectional area of the muscle fibres will increase the conduction velocity of the action potential affecting the MF. Larger muscle mass will likely also, require larger amount of blood circulation and ATP for contraction. Where these are proportional to the cross sectional area is not clear, but it appears to be a likely cause of these differences. Interestingly, the subjective measures are not significantly different between genders. Thus information obtained through VAS, RPE, or BPDR do not discriminate between genders making them more universal tools for the assessment of fatigue.
In maximum voluntary contractions the EMG amplitudes at different sites within the experiment demonstrated the highest correlation coefficients with force. Though these were all significant but explained the variances in males only ranging from 20.4% to 62.4%. The variances explained in females ranged from 24% to 47.1%. The positive correlations clearly establish the relationship that, as the force is declining with progressive fatigue so is EMG amplitude, a finding also
supported by the works of Crone et al.29, DiLazzaro et al.30 and Kumar et al.31. Similarly, even in 40% MVC contractions, the EMG amplitudes demonstrate the highest correlation of all variables explaining from 26.1% to 43.0% variance in males and 16.8% to 32.4% variance in female sample. Surprisingly, the MF decline in maximal voluntary contraction and 40% maximal voluntary contraction was poorly correlated with force and explained variances between 2.4% to 19.8% and 5.5% to 10.8% in males and 1.7% to 16% and 1% to 16.4% in females. While correlations and variances explained were significant (p<0.01), the weakness of association is less convincing than what is reported in the literature.
Muscle contraction is a resultant expression of nervous, metabolic, electrophysiological, mechanical and subjective factors. The primary energy source for muscle contraction is ATP. Since there is only a small amount of ATP present in skeletal muscles, it gets depleted quickly and needs to be replenished for sustained contraction through new blood supply. This physiological rationale suggests that the muscle blood volume and level of it oxygenation should faithfully mirror the degree of fatigue and decline in force. These variables, however, have shown only a modest negative correlation in MVC in males and females in quadriceps contraction, for example (blood oxygenation r = .159 to -.221; p<0.01; blood volume r = .477 to -.637; p<0.01). The blood oxygen level during a MVC explained only 2.5% to 4.8% of variance, where as the blood volume explained 22.7% to 40.5% of variance. In 40% MVC fatiguing contraction the blood oxygenation in males and females explained variances of 3.5% and 26.2%; whereas the blood volume explained 21.4% and 8.5% in males and females, respectively. Despite the assertions of McCully17 and Hamaoka, Murthy et al.21 and others that NIR spectroscopy provides valid data of muscle oxygenation and muscle blood volume, a low to moderate correlation coefficient and only low to modest variances explained in the current experiments, remain enigmatic. However, it is also fair to point out that MacDonald et al31, reported unreliable results from NIRS of femoral blood gases with exercise. Extreme care taken in the experiments make it less likely that experimental error may have played a role.
The subjective variables of visual analog score, rate of perceived exertion and body part discomfort ratings, measured in 40% MVC fatiguing contractions, had a modest correlation with force among males (r = -0.413 to -0.493; p<0.001) explaining 17% to 24.2% of variance. Among females, these values were further reduced (r = -0.338 to -.0418; p<0.01) explaining variances between 11.4% to 17.4%.
or their response follows a pattern of small changes, is hard to say. It is possible that if the total response were to be assigned a value of 100%, even the smaller chances will then represent a proportionally higher percentage of force fatigue. In any case, it is also quite likely that none of the variables selected demonstrate total dependence on fatigue. When these variables are considered in batch, they together explain a variance of 64.4% and 60.2% in maximal voluntary contraction in males and females, respectively in the quadriceps experiment. Similarly, at 40% MVC contraction the variances of 71.9% and 68.6% were explained. The experiments with erector spinae and biceps brachii show very similar results in all aspects. From the results obtained, therefore, it is concluded that it will be desirable for us not to predict or measure fatigue based on any one variable. We rather need to consider a combination of variables for reliable information, regarding a given muscle with respect to fatigue.
In summary, with the series of experiments carried out it would appear that for high grade contractions the EMG amplitude and the median frequency follow the fatigue more closely explaining most variance out of all variables. In lower grade contractions however, the visual analog score is the better variable. However, neither of these variable account for most of the variance. Thus, a single variable indexing of localized muscle fatigue leaves a lot to be desired for.
1. Borg G. Physiological bases of perceived exertion. Medicine and Science in Sports and Exercise 1982; 14: 377-81.
2. Rohmert W. Ermittlung von Erholungspausen fur Statistiche Arbeit des Menschen. Int. Z. Angew. Physiol 1960; 18: 123-124.
3. Chaffin D. Localized muscle fatigue definition and measurement. Journal of Occupational Medicine 1973; 15: 346-54.
4. De Luca C. Myoelectric manifestations of localized muscle fatigue in humans. CRC Critical Reviews in Biomedical Engineering 1985; 11: 251-79.
5. Kumar S, Narayan Y. Spectral parameters of trunk muscles during fatiguing isometric axial rotation in neutral posture. Journal of Electromyography & Kinesiology 1998; 8: 257-67
6. Kumar S, Narayan Y, Stein RB, Snyders C. Muscle fatigue in axial rotation of the trunk. International Journal of Industrial Ergonomics 2001; 28: 113-25.
7. Mannion AF, Dolan P. Electromyographic median frequency changes during isometric contraction of the back extension to fatigue. Spine 1994; 19: 1223-29.
8. Roy S, DeLuca C. Surface electromyographic assessment of low back pain. In Kumar S, editor. Electromyoprophy in Ergonomics. London: Taylor & Francis; p. 259-95.
9. Van Dieen JH, Toussaint HM, Thissen C, Van de Ven A. Spectral analysis of the erector spinae EMG during intermittent isometric fatiguing exercise. Ergonomics 1993; 36: 407-14.
REFERENCES
10. Van Dieen J, Boke B, Oosterhuis W, Toussaint, HM. The influence of torque and velocity on erector spinae muscle fatigue and its relationship to changes of electromyogram spectrum density. Eur J Appl Physiol Occup Physiol 1996; 72: 310-15.
11. Kwanty E, Thomas DH, Kwanty HG. An application of signal processing techniques to the study of myoelectric signals. IEEE Transactions of Biomedical Engineering 1970; 17: 303 - 12.
12. Bigland-Ritchie B, Donovan EF, Roussos CS. Conduction velocity and EMG power spectrum changes in fatigue of sustained maximal efforts. Journal of Applied Physiology 1981; 51: 1300-1305.
13. Hagg G. Electromyographic fatigue analysis based on the number of zero crossings. Pflingers Arch 1981; 391: 78-80.
14. Stulen FB, DeLuca CJ. Frequency parameters of the myoelectric signal as a measure of muscle conduction velocity. IEEE Transactions of Biomedical Engineering 1981; 28: 515-23.
15. Grandjean E. Fitting the task to man. London: Taylor & Francis; 1988.
16. Hamaoka T, Iwane H, Shimomitsu T, Katsumura T, Murase N, Nishio S et al. Noninvasive measures of oxidative metabolism on working human muscles by near infrared spectroscopy. Journal of Applied Physiology 1996; 81: 1410-17.
17. McCully KK, Hamaoka T. Near Infrared Spectroscopy: What can it tell us about oxygen saturation in skeletal muscle? Exercise Sports Science Review 2000; 28: 123-27.
18. De Blasi RA, Cope M, Elwell C, Safoue F, Ferrasi, M. Noninvasive measurement of human forearm oxygen consumption by near infrared spectroscopy. European Journal of Applied Physiology 1993; 67: 20-25.
19. De Blasi RA, Sfareni R, Pietranico B, Mega AM, Ferrari M. Noninvasive measurement of brachioradial muscle VO2 - blood flow relationship during graded isometric exercise. Advances in Experimental Medical Biology 1996; 388: 293-98.
20. Hicks A, McGill S, Hughson RL. Tissue oxygenation by near infrared spectroscopy and muscle blood flow during isometric contractions of the forearm. Canadian Journal Applied of Physiology 1999; 24: 216-30.
21. Murthy G, Kahan NJ, Hargens AR, Rempel D. Forearm muscle oxygenation decreases with low levels of voluntary contraction. Journal of Orthopaedic Research 1997; 15: 507-11
22. Kumar S, Fagarasanu M, NarayanY, Prasad N. Measures of localized spinal muscle fatigue. Ergonomics 2006 (in press).
23. Kumar S. Theories of musculoskeletal injury causation. Ergonomics 2001; 44: 17-47.
24. Friden J. Changes in human skeletal muscle induced by long term eccentric exercise. Cell Tissue Research 1984; 236: 365-72.
25. Friden J, Sieger J, Ekblem B. Sublethal muscle fibre injuries after high-tension anaerobic exercise. European Journal of Applied Physiology 1988; 57: 360-8.
27.Friden J, Lieber R. Structural and mechanical basis of exercise induced muscle injury. Medicine and Science in Sports and Exercise 1992; 24: 521-30.
28.Lippold OCJ, Redfearn JWT. (1960). The electromyography of fatigue. Ergonomics 1960; 3: 121-31.
29.Crone C, Johnsen LL, Hultborn H, Orsmes GB. Amplitude of the maximum motor response (Mmax) in human muscles typically decreases during the course of an experiment. Experimental Brain Research 1999; 124: 265-70.
30.Di Lazzaro V, Oliviero A, Tonali PA, Mazzone P, Insola A, Pilato F, Saturno E, Dileone M, Rothwell JC. Direct demonstration of reduction of output of the human motor cortex induced by a fatiguing muscle contraction. Experimental Brain Research 2003; 149: 535-38.
31.Kumar S, Amell T, NarayanY, Prasad N. Measurement of localized muscle fatigue in biceps brachii using objective and subjective measures. In Kumar S, editor. Muscle Strength. Boca Raton, FL: S Publisher CRC Press; 2004. p. 105-21.