Article
J. Braz. Chem. Soc., Vol. 22, No. 8, 1484-1492, 2011. Printed in Brazil - ©2011 Sociedade Brasileira de Química 0103 - 5053 $6.00+0.00
A
*e-mail: [email protected]
Distribution and Availability of Copper, Iron, Manganese and Zinc in the
Archaeological Black Earth Proile from the Amazon Region
Cleide S. T. Mescouto,a Vanda P. Lemos,a Heronides A. Dantas Filho,a
Marcondes L. da Costa,b Dirse C. Kernc and Kelly G. Fernandes*,a
aFaculdade de Química, Instituto de Ciências Exatas e Naturais and bInstituto de Geociências,
Universidade Federal do Pará, 66075-110 Belém-PA, Brazil
cMuseu Paraense Emílio Goeldi, 66077-830 Belém-PA, Brazil
Os solos de terra preta arqueológica são ricos em matéria orgânica, contêm fragmentos cerâmicos e artefatos líticos e apresentam nutrientes em concentrações mais elevadas do que outros tipos de solos. Com o intuito de contribuir com informações sobre concentrações de micronutrientes disponíveis em solos de terra preta, foram avaliadas através de extrações químicas sequenciais, a distribuição e disponibilidade de Cu, Fe, Mn e Zn em um peril de terra preta arqueológica no município de Juruti, estado do Pará. As maiores concentrações de Cu, Fe, Mn e Zn no peril são encontradas na fração residual. Este estudo mostrou que ferro, manganês e zinco são preferencialmente disponíveis a partir das frações, associados aos óxidos de Fe-Mn, variando
de 1265,39 a 1818,12 mg kg-1, 0,83 a 48,51 mg kg-1 e 1,92 a 12,05 mg kg-1, respectivamente, e o
cobre a partir da matéria orgânica, variando de 0,13 a 0,45 mg kg-1.
The archaeological black earth soils are rich in organic matter, contain ceramic fragments and lithics artifacts and feature nutrients in higher concentrations than other types of soils. To contribute information about micronutrient concentrations available in black earth soils, the distribution and availability of Cu, Fe, Mn and Zn in the archaeological black earth proile from the municipal district of Juruti, Pará State, was evaluated through sequential chemical extractions. The largest concentrations of Cu, Fe, Mn and Zn in the proile are found in the residual fraction. This study showed that the iron, manganese and zinc are preferentially available from the fractions associated
with Fe-Mn oxides ranging from 1265.39 to 1818.12 mg kg-1, 0.83 to 48.51 mg kg-1 and 1.92 to
12.05 mg kg-1 respectively, and the copper from organic matter, ranging from 0.13 to 0.45 mg kg-1.
Keywords:archaeological black earth, distribution, metals, availability, FAAS
Introduction
The terra preta anthrosols of Amazonia are mainly
oxisols, ultisols and inceptisols with an anthropic A horizons1 with dark colouration, popularly called idian
black earth (IBE) or archaeological black earth (ABE),2
occur mainly in the Brazilian Amazon, Colombia, and, less frequently, Venezuela, Peru, and Guiana.3 The areas
in which ABE occurs is characterized by well-drained soil, running water and located in a particular geographical setting from which the surrounding areas can be clearly observed.4 Several hypotheses have been suggested
on the process of ABE formation; however, the most widely accepted states that ABE would have been formed
unintentionally by pre-Columbian man.5 Human activity in
the pre-Columbian past has resulted in the accumulation of plant and animal residues, as well as large quantities of ceramic and lithic artifacts, ash, charcoal, and various chemical elements, such as P, Mg, Zn, Cu, Ca, Sr and Ba, representing the geochemical signature of human occupation. These accumulations probably contributed decisively to the formation of fertile soils,6 with high
concentrations of available phosphorus and calcium and low concentrations of Al (III) cause the plants to develop better in black earth7 compared with the adjacent non
anthropogenic soils.
Several chemical elements in soils are physiologically essential for growth and vegetal reproduction.8 Elements
absorbed in high quantities;9 therefore, knowledge on the
availability of these elements in soil is of fundamental importance.
The total content of metals in soil is generally not a suitable index for estimating their availability in soils, because only part of them is mobile in the soil proile and is available for absorption by the roots of plants.10 These
metals can accumulate in the soil in different forms such as water-soluble, exchangeable, bound to oxides, bound to carbonates, and bound to organic and residual matter in the structure of minerals.11 Water-soluble and exchangeable
fractions are considered readily mobile and available; fractions associated to oxides, carbonates, and organic matter may be potentially available,12 depending on the
combination of chemical and physical properties of the soil,10 while the residual fraction is not available to plants
and microorganisms.12 One of the tools used to evaluate the
different chemical forms of metals in soil is the sequential extraction methods.11 These methods are commonly used
for the fractionation of metals in soils, sediments, and other environmental matrices and to evaluate the potential mobility and availability of these metals.13 The principle of
the sequential extraction method consists of sequentially applying appropriate chemical reagents, where each step of the sequence is chemically more aggressive than the previous one.14 Each method has a set of reagents which
speciically attacks the geochemical form by which it is chemically bound to the soil structure.11 The information
obtained allows the phyto-bioavailability, phytotoxicity, dynamics of trace elements, and transformations between the different chemical forms in polluted or tillable soils to be assessed.15
The aim of this study was to evaluate the distribution and availability of copper, iron, manganese, and zinc among different fractions in the soil proile of ABE from Juruti-PA.
Experimental
Study area
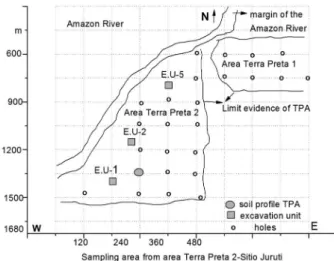
The study was conducted with archaeological black earth (ABE) proile samples obtained in the terra preta
archaeological site 2, in the rainy season, in an area in the municipality of Juruti (PA) on the right bank of the Amazon River. Located in the western State of Pará, Brazil, the municipality has an estimated population of 38,000 inhabitants in an area of 8342 km², 848 km away from the capital Belém. Prospecting site terra preta 2 was based on
the application of systematic sampling distributed in vertical lines, towards the east. Along these lines, towards the south,
were made polls belonging to lines 480E, 360E, 240E, 120E, according to the Figure 1. For a reined understanding of archeological study, three areas were opened called excavation unit 1, 2 and 5. Furthermore, it was opened a soil proile, object of study of this work, which was described and collected following the soil horizons. The location of the soil proile is at the geographical coordinates UTM 21M 599557E and 9759353N.
Soil samples
Morphological description of soil horizons were classiied according to standards recommended by the Brazilian Society of Soil Sciences16 and colors samples
were determined according to Munsell.17 Soil samples
were air dried, lumps were removed, and the samples were passed through a 2 mm sieve. The pH values in water and organic matter were determined according to the methods of Embrapa.18 The pH of samples in water was determined
by the direct potentiometric method using a soil:water ratio of 1:2.5 after 1 h of rest and shaking before reading. The organic matter content was determined by the oxidation-reduction method using potassium dichromate as the oxidant of organic matter.
Reagents and materials
All solutions were prepared using deionized water (resistivity of 18.2 MΩ cm) puriied by an ELGA system
(Elgastat, Bucks, England). For extraction procedures, the following analytical grade reagents were used: magnesium chloride (MgCl2, Nuclear, São Paulo, Brazil), sodium acetate
(NaOAc, Nuclear), hidroxylamine chloride (NH2OH.HCl,
hydrogen peroxide (H2O2, Impex) ammonium acetate
(NH4OAc, Vetec, Rio de Janeiro, Brazil), nitric acid (HNO3 65% v/v, Impex), hydrochloric acid (HCl 37% v/v, Impex) and hydroluoric acid (HF 40% v/v, Quimex, São Paulo, Brazil).
Appropriate buffer solutions (pH 4.0 and pH 7.0) were used for calibrating the pHmeter.
The analytical curves were prepared from standard solutions of 1000 mg L–1 for all elements (J. T. Baker). All
glassware and bottles used in the procedures were immersed in 10% (v/v) HNO3 solution for 24 h and thoroughly rinsed
with deionized water.
The sequential extractions were performed using horizontal mechanical shaker Model 3520 (LAB-Line, USA) and centrifuges Model 80-2B (Centribio, Brazil)
Analytical procedure
Sequential extraction
The sequential extraction procedure of Ma and Rao,19
which is a modiied version of the method described by Tessier et al.,11 was used to separate the metals into six
fractions which were denoted as F1, F2, F3, F4, F5, and F6. Approximately 1 g of each sample from the ABE proile was weighed in triplicate and transferred to centrifuge tubes of 15 mL and then the following sequential extraction was carried out. (i) Water-soluble fraction (F1): the soil
was extracted with 10 mL of deionized water for 2 h in a horizontal shaker at room temperature. (ii) Exchangeable
fraction (F2): the residue obtained in F1 was extracted with 10 mL of MgCl2 solution 1.0 mol L–1 (pH 7.0) for 1 h in a
horizontal shaker at room temperature. (iii) Fraction bound
to carbonates (F3): the residue obtained in F2 was extracted with 10 mL of sodium acetate solution (NaOAc) 1.0 mol L–1
(pH 5) for 5 h in a horizontal shaker at room temperature. (iv) Fraction bound to Fe-Mn oxides (F4): the residue
obtained in F3 was extracted with 10 mL of hydroxylamine chloride solution (NH2OH.HCl) 0.04 mol L–1 in acetic acid
(HOAc) 25% (v/v) for 5 h at 96 °C under slow agitation. (v) Fraction bound to organic compounds (F5): the residue
obtained in F4 was extracted with 10 mL H2O2 30% (m /m)
at pH 2.0 (adjusted with HNO3) for 5.5 h in a water bath at 85 °C under slow agitation. After this time, the samples were cooled, 2.5 mL of ammonium acetate (NH4OAc) 3.2 mol L-1 in HNO
3 20% (v/v) were added, and samples
were then stirred for 30 min. (vi) Residual fraction (F6):
the residue obtained in F5 was placed to dry in oven at 60 °C for 24 h and removed from the centrifuge tubes. The digestion of the residue was performed by adding 16 mL of Lefort water (3HNO3:1HCl), and after 12 h of rest the samples were heated for 8 h at a temperature of 160 °C.
The digested part and the residue (silicate compounds that were not digested) were quantitatively transferred into a centrifuge tube of 50 mL with the addition of 10 mL of deionized water. The separation of the supernatant and residue was carried out by centrifugation at 2000 rpm for 5 min. The residue was dissolved at room temperature by adding 2 mL of concentrated HF, and after dissolution, 1 g of H3BO4 was added for the complexation of the remaining luoride. The resulting mixture was added to the previously collected supernatant (liquid phase of the digested part) and the volume was adjusted to 50 mL with deionized water.
At the end of each extraction process (fractions F1, F2, F3, F4, and F5), the separation of the residue and supernatant was carried out by centrifugation at 3000 rpm for 30 min. The supernatants were removed with a pipette and iltered through Whatman ilter paper no. 42. All solid phases were washed with 5 mL of deionized water before the next extraction. Washes were collected and analysed with the supernatant from the previous fraction. All experiments were performed in triplicate.
Instrumentation
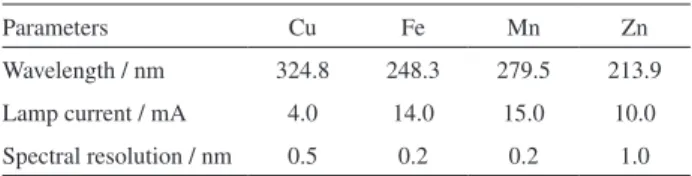
All determinations of metals were performed using a lame atomic absorption spectrometer (FAAS) (Model AA 220, Varian, Australia) equipped with Cu, Fe, Mn and Zn hollow cathode lamps and an air-acetylene lame. The instrumental conditions are shown in Table 1.
Addition of 4.0 mg L–1 Cu, 9.0 mg L–1 Fe, 2.0 mg L–1
Mn, and 1.0 mg L–1 Zn and recovery tests were performed
to all fractions studied.
Results and Discussion
Organic matter content and pH
The ABE proile analysed reaches beyond 150 cm deep and presented an A1 horizon with 12 cm thick, black color, some ceramic fragments and many ine roots. The A2 horizon presented a thickness of 35 cm, dark brown color, some ceramic fragments, coal, and many ine roots. The A3 horizon presented a thickness of 73 cm, very dark grayish brown, some ceramic fragments and coal. While the horizons of transition AB and BA occupy the depth Table 1. Operational condition for FAAS
Parameters Cu Fe Mn Zn
range between 75 and 130 cm and their colors range from yellowish brown to dark brown, respectively. The B horizon extends beyond 150 cm and showed a yellowish brown color. The pH and organic matter content determined in
terra preta soil samples are presented in Table 2. The terra preta soil proile had pH values in the range from 4.97
to 6.07. These soils are classiied as from high acidity to weak acidity, and the values increase with depth. In relation to organic matter content, the values obtained for the soils studied were greater than 76.31 g kg-1. These values are
higher than those obtained by Lemos et al.20 from areas with
ABE in Ilha de Terra site in the Caxiuanã region (PA) and were also higher than values found in the high concentration class, according to Tomé Jr.21
Distribution of metals in the ABE proile
Sequential extraction is useful to indirectly assess the potential mobility and availability of metals in soils. Assuming that availability is related to solubility, it can be inferred that the metal availability decreases in the following order: water-soluble > exchangeable > carbonate > Fe-Mn oxides > organic > residual. This order provides only qualitative information about the metal availability. It can also be inferred that the metal in the non-residual fraction is more available than the metal associated to the residual fraction. The non-residual fraction is the sum of all the fractions less the residual fraction.19
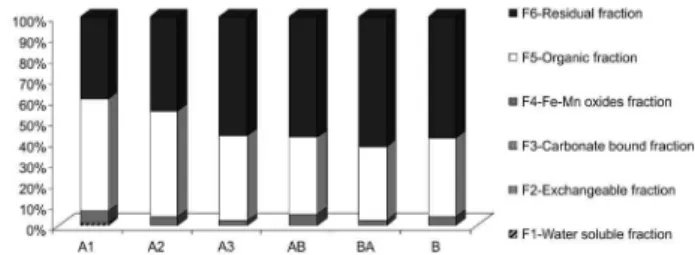
Copper
The result of the percentage distribution among the copper forms held in the ABE profile (Figure 2) indicates that this element was recovered (39.70-62.48%) in the residual fraction (F6) and in the fraction bound to organic compounds (F5) (34.90-53.47%). A low Cu percentage (2.16-5.82%) was found in the fraction bound to Fe-Mn oxides (F4). The Cu contents in the fractions of water-soluble (F1), exchangeable (F2), and associated to carbonates (F3) were below of the limit of detection,
except for the water-soluble fraction of sample A1 (0.98%
of total Cu).
The high Cu content obtained in the residual and organic soil fractions has been reported by other authors.19,22,23 This
association of copper with the organic fraction conirms the ability of this metal to form stable complexes with organic matter through reactions with COOH groups and phenolic OH.24
Table 3 shows the Cu contents that were extracted from fractions of the ABE proile. It can be observed that in the fractions associated to Fe-Mn oxides, the organic matter and residual were obtained higher extractions in the A2 horizon.
In the water-soluble fraction, only a low Cu content was detected in the A1 horizon.
In the A1 and A2 surface horizons, it was noticeable that there is a greater afinity of Cu for the fraction associated with organic compounds, while in the A3, AB, BA, and B subsurface horizons the afinity is for the residual fraction. As the ABE proile deepens, copper becomes more stable, or unavailable to plants. About the level of toxicity to plants, Cu levels obtained in the sum of fractions F1, F2, F3, F4, and F5 showed adequate levels.25
According to Wedepohl,26 in the upper continental
crust, Cu presents a total content of 14.30 mg kg–1 soil.
Taking this value as reference, it can be observed that the levels found in the sum of fractions are in agreement with this value.
Analysis of coeficient of variation for all fractions studied showed variations between 53.39% for fraction bound of Fe-Mn oxides to 26.58% for residual fraction, evidencing the variability of Cu, along the soil proile.
The amount of Cu found in the non-residual fractions ranged from 37.52% in the BA horizon to 60.30% in the A1 horizon. These data are compatible with results
obtained for Cu available from other sites of the ABE.27,28
Among the non-residual fractions, the fraction bound to organic matter had the greatest levels of Cu extracted throughout the ABE proile. It can be inferred that the availability of this element in the soil depends on the organic matter content.
Table 2. Chemical soil attributes
Samples pH ± SDa O.M. ± SDa /
(g kg–1)
A1 4.97 ± 0.01 80.10 ± 5.35
A2 5.57 ± 0.01 81.95 ± 4.22
A3 5.90 ± 0.01 80.15 ± 1.17
AB 6.08 ± 0.01 76.31 ± 0.14
BA 5.67 ± 0.02 81.55 ± 0.84
B 5.52 ± 0.02 81.80 ± 1.17
aSD = standard deviation (n = 3).
Iron
The result of the percentage distribution between the forms of Fe obtained in the ABE proile (Figure 3) shows that the residual form (F6) is dominant, with percentages ranging from 80.18 to 89.34%. A signiicant proportion of Fe in the soil proiles (8.99 to 17.29%) was obtained in the fraction associated with Fe-Mn oxides (F4). This relationship was expected, since this element is found in soil, mainly in the forms of oxides and hydroxides.29
In the water-soluble fraction (F1), a low percentage of total Fe (0.13 to 2.42%) was obtained in the studied proile. However, in the form bound to organic matter (F4), less than 0.40% of the total Fe was found, while in exchangeable fractions (F2) and those associated with carbonate (F3), the percentages were < 0.28%.
Table 4 shows the Fe contents obtained in fractions from the ABE proile. It was observed that in water-soluble, exchangeable, and residual fractions, the highest total Fe contents were obtained in the AB horizon. In the fraction bound to carbonates, a higher Fe extraction was obtained in the A1 horizon, with its amount decreasing with depth in the fraction.
For fractions associated with Fe-Mn oxides and organic matter, major extractions were obtained in the A2 horizon.
About the levels of toxicity to plants, Fe levels obtained in the sum of fractions F1, F2, F3, F4, and F5 showed adequate levels.30
According to the value found in the upper continental crust,26 iron has a total content of 30.890 mg kg–1 soil, and
considering this value as reference, it may be noted that the levels found in the sum of fractions in the studied proile are in accordance with this value.
The coeficient of variation for almost all fractions remained on area high dispersion, ranging from 13.70% to 76.0%, evidencing the variability of Fe among fractions, along the soil proile.
The Fe levels present in the non-residual fractions showed variations between 10.66% in the AB horizon and 19.82% in the B horizon. Among the non-residual fractions, the fraction bound to Fe-Mn oxides showed the highest Fe content throughout the proile. Therefore, this fraction is the immediate reserve for the supply of this element in the ABE proile.
Manganese
The result of the percentage distribution between the forms of Mn found in the ABE proile (Figure 4) shows that this element had the most even distribution among the fractions analysed. Considerable quantities of total Mn were found in residual (F6), bound to Fe-Mn oxides (F4) and to organic matter fractions (F5), with percentages ranging from 18.19 to 60.06%, 8.99 to 56.18%, and 0.92 to 55.71%, respectively.
It may be noted that the lowest distribution of total Mn was obtained in fractions which were bound to carbonates (F3) (4.52-12.65%) and water-soluble (F1) (1.44-3.43%). The contents in the exchangeable fraction (F2) were below the detection limit, with the exception of the sample from the A1 surface horizon, which showed 16.06% of total Mn.
Table 3. Content of copper (mg kg–1 ± SDa) extracted in each fraction of soil samples
Soil proile
Fraction A1 A2 A3 AB BA B
Water soluble 0.07 ± 0.02 < 0.01* < 0.01* < 0.01* < 0.01* < 0.01* Exchangeable < 0.01* < 0.01* < 0.01* < 0.01* < 0.01* < 0.01* Carbonate < 0.01* < 0.01* < 0.01* < 0.01* < 0.01* < 0.01* Fe-Mn oxide 0.45 ± 0.06 0.45 ± 0.04 0.16 ± 0.04 0.29 ± 0.04 0.13 ± 0.07 0.16 ± 0.01 Organic 4.10 ± 0.32 5.38 ± 0.94 3.11 ± 0.92 1.88 ± 0.06 1.98 ± 0.11 1.50 ± 0.15 Residual 3.04 ± 0.03 4.85±0.45 4.35 ± 0.12 2.99 ± 0.40 3.51 ± 0.02 2.34 ± 0.26
Sum of all fractions 7.68 10.68 7.63 5.17 5.63 4.01
Non-residual / (%) 60.30 54.53 42.97 42.04 37.52 41.51
Residual / (%) 39.70 45.47 57.03 57.96 62.48 58.49
aSD = standard deviation (n = 3); *LOD (limit of detection) / (mg L–1).
Soil pH is, in most cases, the main factor controlling the availability of micronutrients for plants,31 and the
availability of these metals is relatively low at pH values around 6 to 7.32 About the levels of toxicity to plants, Mn
levels obtained in the sum of fractions F1, F2, F3, F4, and F5 showed adequate levels.25
It can be observed that in the fraction bound to organic matter, the percentages of total Mn increased with the proile depth, which may be due to pH increases along the ABE proile. Under these pH conditions (around 6) the amount of Mn adsorbed by the organic matter is generally high, and there are usually low contents of exchangeable forms and high contents of organic forms and oxides,33,34
which agrees with the results of this study.
In the A1 and A2 horizons, the sum of total Mn obtained
in F1, F2, and F3 was higher than 16.00%. This suggests that Mn in the surface horizons may be highly available in the ABE proile.
Table 5 presents the Mn contents obtained in fractions from the ABE proile. It was observed that the A1 horizon
showed the highest total Mn content in the fractions which were water-soluble, exchangeable, and bound to carbonates and to Fe-Mn oxides, and its amount decreased with depth in the fractions.
In the fraction bound to organic matter, the highest extraction was for the A3 horizon, while in the residual fraction, a higher extraction was obtained for the A2 horizon.
In the upper continental crust,26 manganese presents a
total content of 527.00 mg kg–1 soil. Taking this value as
reference, it can be observed that the levels found in the sum of fractions are in agreement with this value.
The coeficient of variation for all fractions remained with high dispersion, ranging from 47.71% to 131.0%, showed the great variability of Mn among fractions and along of the soil proile.
The Mn levels in the residual fractions showed variations from 39.94% in the BA horizon to 81.81% in the A1 horizon. These data were lower results obtained for Mn available from other sites of the ABE.27,28 Among
the non-residual fractions, the fraction bound to Fe-Mn oxides showed the highest Mn concentrations in the A1,
A2, and A3 horizons, while in the deeper AB, BA, and B horizons, major extractions occurred in fractions bound to the organic matter.
It can be inferred that in surface horizons, this element is available from Fe-Mn oxides, and with increasing depth in the ABE proile, manganese is most available from the organic matter.
Zinc
The result of the percentage distribution among the forms of zinc obtained in the ABE proile (Figure 5) indicates that this element was predominant in the residual fraction (F6) throughout the soil proile, with percentages ranging from 38.48% to 73.29%. Ma and Rao19 found that
the majority of zinc in the soil was associated with the residual fraction. This high Zn percentage in the residual fraction probably relects the greater tendency of Zn to become unavailable in the soil.19
Table 4. Content of iron (mg kg–1 ± SDa) extracted in each fraction of soil samples
Soil proile
Fraction A1 A2 A3 AB BA B
Water soluble 15.08 ± 0.64 112.37 ± 1.19 170.79 ± 1.42 292.98 ± 69.32 272.37 ± 47.55 192.31 ± 0.93 Exchangeable 2.38 ± 0.15 < 0.12* 0.42 ± 0.10 2.89 ± 0.11 2.68 ± 0.02 2.10 ± 0.07 Carbonate 31.68 ± 0.70 21.65 ± 0.72 18.19 ± 0.46 10.17 ± 0.21 8.02 ± 0.65 4.86 ± 0.39 Fe-Mn oxide 1265.39 ± 227.55 1818.12 ± 345.53 1497.66 ± 131.49 1749.72 ± 8.19 1599.41 ± 32.23 1376.43 ± 57.17 Organic 34.12 ± 2.47 46.03 ± 13.08 21.25 ± 0.64 19.07 ± 1.03 5.79 ± 0.25 2.68 ± 0.06 Residual 9847.76 ± 671.20 9507.49 ± 968.56 9241.05 ± 662.06 17391.25 ± 2444.06 12123.86 ± 1458.76 6384.52 ± 815.11 Sum of all fractions 11196.42 11505.66 10949.37 19466.08 14012.14 7962.89
Non-residual / (%) 12.05 17.37 15.60 10.66 13.48 19.82
Residual / (%) 87.95 82.63 84.40 89.34 86.52 80.18
aSD = standard deviation (n = 3); *LOD (limit of detection) / (mg L–1).
A considerable proportion of Zn in the soil proile (9.93 to 28.31%) was found in the fraction bound to Fe-Mn oxides (F4).
The contribution of organic matter (F5) to the Zn retention in the soil proile ranged from 4.37 to 11.24%, while the participation of forms which were associated with carbonate (F3), exchangeable (F2), and water-soluble (F1) ranged from 5.18 to 8.06%, 3.67 to 14.58%, and 1.46 to 4.69%, respectively. In relation to mobility and availability,
Zn is highly available in the ABE proile, since over 12.00% of the total Zn was found in the sum of F1, F2, and F3. About the level of toxicity to plants, Zn levels obtained in the sum of fractions F1, F2, F3, F4, and F5 showed normal levels with the exception of the samples from the A1 and A2
surface horizons reach toxic levels (> 15 mg kg-1)25 which
can be harmful to plant growth.
Table 6 shows the Zn contents obtained in fractions from the ABE proile. It can be observed that the fractions which were soluble in water, bound to carbonates, bound to Fe-Mn oxides, and bound to organic matter showed a higher extraction in the A2 horizon, while in the exchangeable and residual fractions, higher extractions were obtained in the A1 and A3 surface horizon, respectively. The Zn levels extracted in most fractions decreased with depth. The Zn levels obtained in the sum of the fractions are in agreement with the value of 52.00 mg kg–1 found in the
upper continental crust.26 The coeficient of variation for
almost all fractions remained with high dispersion, ranging Table 5. Content of manganese (mg kg–1 ± SDa) extracted in each fraction of soil samples
Soil proile
Fraction A1 A2 A3 AB BA B
Water soluble 1.33 ± 0.29 1.28 ± 0.14 0.80 ± 0.09 0.40 ± 0.01 0.41 ± 0.03 0.28 ± 0.02 Exchangeable 13.86 ± 0.36 < 0.05* < 0.05* < 0.05* < 0.05* < 0.05* Carbonate 6.15 ± 0.02 3.82 ± 0.07 2.51 ± 0.17 1.05 ± 0.05 0.94 ± 0.07 0.69 ± 0.03 Fe-Mn oxide 48.51 ± 3.45 6.52 ± 0.27 28.94 ± 2.84 3.10 ± 0.17 1.41 ± 0.38 0.83 ± 0.03 Organic 0.79 ± 0.10 1.38 ± 0.14 10.68 ± 0.52 5.29 ± 0.14 3.49 ± 0.29 4.54 ± 0.03 Residual 15.70 ± 1.10 17.18 ± 0.29 12.64 ± 0.97 12.20 ± 1.14 9.40 ± 0.79 1.80 ± 0.14
Sum of all fractions 86.35 30.19 55.58 22.04 15.65 8.15
Non-residual / (%) 81.81 43.07 77.24 44.64 39.94 77.81
Residual / (%) 18.18 56.92 22.75 55.35 60.05 22.18
aSD = standard deviation (n = 3); *LOD (limit of detection) / (mg L–1).
Figure 5. Percentage distribution of zinc in soil chemical fractions.
Table 6. Content of zinc (mg kg–1 ± SDa) extracted in each fraction of soil samples
Soil proile
Fraction A1 A2 A3 AB BA B
Water soluble 0.48 ± 0.06 0.97 ± 0.05 0.84 ± 0.05 0.76 ± 0.05 0.51 ± 0.08 0.39 ± 0.06 Exchangeable 4.86 ± 0.03 4.21 ± 0.10 2.58 ± 0.36 0.93 ± 0.11 0.78 ± 0.09 0.84 ± 0.11 Carbonate 2.38 ± 0.25 2.61 ± 0.19 2.21 ± 0.16 1.31 ± 0.08 1.34 ± 0.04 1.37 ± 0.03 Fe-Mn oxide 9.03 ± 0.36 12.05 ± 0.53 6.97 ± 0.53 4.10 ± 0.23 2.10 ± 0.26 1.92 ± 0.03 Organic 3.75 ± 0.16 3.87 ± 0.14 2.80 ± 0.27 1.48 ± 0.11 0.92 ± 0.06 1.23 ± 0.01 Residual 12.82 ± 5.35 18.86 ± 3.24 27.14 ± 4.95 7.66 ± 2.01 15.50 ± 0.76 11.68 ± 2.92
Sum of all fractions 33.32 42.57 42.57 16.25 21.15 17.43
Non-residual / (%) 61.51 55.68 36.16 52.81 26.71 33.00
Residual / (%) 38.48 44.31 63.83 47.18 73.29 66.99
from 31.80% to 76.92%, evidencing the great variability of Zn between fractions along the soil proile.
The Zn content present in non-residual fractions showed variations between 26.71% in the BA horizon and 61.52% in the A1 horizon. This data showed the highest results for
Zn available from other sites of the ABE.27,28 Among the
non-residual fractions, the fraction bound to Fe-Mn oxides obtained the highest Zn levels throughout the ABE proile. This may be due to the high constant stability of Zn oxides in soils.18 Several studies have reported the dominance of
Fe-Mn oxides bound to Zn .11,12,19,22,23,35 It can be inferred that
this element is preferentially available from Fe-Mn oxides.
Recovery
The recoveries of 4.00 mg L–1 Cu, 9.00 mg L–1 Fe,
2.00 mg L–1 Mn, and 1.00 mg L–1 Zn added in the fractions
ranged from 80.30 to 95.50% for Cu, 90.20 to 96.50% for Fe, 83.70 to 103.70% for Mn, and from 89.20 to 104.20% for Zn.
Conclusions
The sequential extractions showed that the highest Cu, Fe, Mn, and Zn concentrations were found in the residual fraction for most samples and the sums of the non-residual fractions showed in appropriate levels for Cu, Fe and Mn, while Zn toxic levels presented in surface horizons. These data associated with high levels of organic matter show that this ABE soil proile investigated, still preserves its relative high fertility.
This study showed that the fractionation of elements found in the ABE proile has a similar behaviour, because among non-residual fractions, the fraction bound to Fe-Mn oxides was the most signiicant for the elements, except for Cu, which predominated in the fraction bound to organic compounds, and the exchangeable fraction was the least signiicant for the elements, except for Zn, which was less associated with the water-soluble fraction.
Acknowledgments
The authors are grateful to Conselho Nacional de Desenvolvimento Cientíico e Tecnológico (CNPq) for research funds and fellowships. K. G. F. and C. S. T. M. also are thankful to Dr. Dulcidéia da Conceição Palheta (UFRA, Pará, Brazil) by use on the FAAS.
References
1. Lima, H. N.; Schaefer, C. E. R.; Melo, J. W. V.; Gilkes, R. J.; Ker, J. C.; Geoderma 2002, 110, 1.
2. Cunha, T. J. F.; Madari, B. E.; Benites, V. M.; Canellas, L. P.; Novotny, E. H.; Moutta, R. O.; Trompowsky, P. M.; Santos, G. A.; Acta Amaz. 2007, 37, 91.
3. Éden, M. J.; Bray, W.; Herrera, L.; Mcewan, C.; Am. Antiq.
1984, 49, 125.
4. Smith, N. J. H.; Ann. Assoc. Am. Geogr. 1980, 70, 553.
5. Woods, W. I.; Mccann, J. M.; El Origen y Persistencia de las Tierras Negras de la Amazonia; Abya Ayala : Quito, Ecuador,
2001, p. 23.
6. Novotny, E. H.; Hayes, M. H. B.; Madari, B. E.; Bonagamba, T. J.; deAzevedo, E. R.; de Souza, A. A.; Song, G.; Nogueira, C. M.; Mangrich, A. S.; J. Braz. Chem. Soc. 2009, 20, 1003.
7. Falcão, N. P. S.; Comerford, N.; Lehman, J. In Amazonian Dark Earths: Origin, Properties, Management; Lehmann, J.;
Kern, D. C.; Glaser, B.; Woods, W. I., eds., Kluwer Academic Publishers: Netherlands, 2003, p. 255.
8. Gonçalves Junior, A. C.; Luchese, E. B.; Lenzi, E.; Quim. Nova 2000, 23, 173.
9. Tüzen, M.; Microchem. J. 2003, 74, 289.
10. Sposito, G.; Lund, L. J.; Chang, A. C.; Soil Sci. Soc. Am. J.
1982, 46, 260.
11. Tessier, A.; Campbell, P. G. C.; Bisson, M.; Anal. Chem. 1979, 51, 844.
12. Kabala, C.; Sing, B. R.; J. Environ. Qual. 2001, 30, 485.
13. Gleyzes, C.; Tellier. S.; Astruc, M.; Trends Anal. Chem. 2002,
21, 451.
14. Kersten, M.; Forstner, U. In Trace Elements Speciation: Analytical Methods and Problems; Batley, G. E., ed., CRC
Press: Boca Raton, Florida, 1989, p. 245.
15. Costa, A. C. S. da; Almeida, V. de C.; Lenzi, E.; Nozaki, J.;
Quim. Nova 2002, 25, 548.
16. Lemos, A.; Santos, P. B.; Manual de Descrição e Coleta de Solos em Campo, SBCS/SNLCS: Campinas, SP, Brasil, 1996, p. 46.
17. Munsell Colors Company; Munsell Soil Colors Charts, Baltimore, 2000.
18. Embrapa; Análise Química para Avaliação da Fertilidade do Solo. Métodos utilizados na Embrapa Solos, Documento No.
3, 1998. Available: www.esolos-d09bgw.cnps.embrapa.br/ blogs/paqlf/wp-content/uploads/2008/08/analises_quimicas_ fertilidade.pdf accessed in April 2009.
19. Ma, L. Q.; Rao, G. N.; J. Environ. Qual. 1997, 26, 259.
20. Lemos, V. P.; Costa, M. L., Gurjão, R. S.; Kern, D. C.; Mescouto, C. S. T.; Lima, W. T. S.; Rev. Esc. Minas2009, 62, 139. Available: www.rem.com.br/seer_antigo/index.php/ Escola/issue/view/22/showToc accessed in January 2010. 21. Tomé Jr., J. B.; Manual para Interpretação de Análise de Solo,
Agropecuária: Guaíba, Rio Grande do Sul, Brasil, 1997. 22. Iwegbue, C. M. A.; Waste Manage. Res. 2007, 25, 585. 23. Harrison, R. M.; Laxen, D. P. H.; Wilson, S.; Environ. Sci.
24. Gomes, P. C.; Fontes, M. P. F.; Costa, L. M.; Mendonça, E. S.;
Rev. Bras. Cienc. Solo 1997, 21, 543.
25. Kabata-Pendias, A.; Pendias, H.; Trace Elements in Soils and Plants, CRR Press: Boca Raton, 2000, p. 403.
26. Wedepohl, K. H.; Geochim.Cosmochim. Acta 1995, 59, 1217. 27. Costa, M. L.; Kern, D. C.; J. Geochem. Explor. 1999, 66, 369.
28. Carmo, M. S.; Costa, M. L.; Kern, D. C.; Contribuições à Geologia da Amazônia, SBG: Belém, 2007, 5, p.143.
29. Amberger, A.; Planzenernährung, Verlag Eugen Ulmer: Stuttgart, 1988, p. 264.
30. O’Neil, P.; Environmental Chemistry; 2nd ed., Chapmam and
Hall: London, 1994, p. 151.
31. Chlopecka, A.; Adriano, D. C.; Environ. Sci. Technol. 1996,
30, 3294.
32. Kabata-Pendias, A.; Pendias, H.; Trace Elements in Soils and Plants, CRR Press: Boca Raton, 1987, p. 315.
33. Bibak, A.; Commun. Soil Sci. Plant Anal.1994, 25, 3229. 34. Shuman, L. M.; Soil Sci. Soc. Am. J. 1986, 50, 1236.
35. Zaghloul, A. M.; El-Dewinty, C.; Youssef, R. A.; J. Appl. Sci. Res. 2006, 2, 284.
Submitted: January 24, 2011