Article
Printed in Brazil - ©2016 Sociedade Brasileira de Química 0103 - 5053 $6.00+0.00
*e-mail: [email protected]
Assessment of Trace Elements in Tissues of Fish Species:
Multivariate Study and Safety Evaluation
Edevaldo Silva,a,b,c Fernanda N. Costa,a,b Thais L. Souza,a,b Zenira C. V. Viana,d
Anderson S. Souza,e Maria G. A. Korn*,a,b and Sergio L. C. Ferreiraa,b
aInstituto de Química, Universidade Federal da Bahia, Campus de Ondina,
40170-115 Salvador-BA, Brazil
bInstituto Nacional de Ciência e Tecnologia (INCT) de Energia e Ambiente,
Universidade Federal da Bahia, 40170-290 Salvador-BA, Brazil
cUnidade Acadêmica de Ciências Biológicas, Universidade Federal de Campina Grande,
CP 64, 58700-970 Patos-PB, Brazil
dInstituto de Ciências da Saúde, Universidade Federal da Bahia, Vale do Canela,
40110-100 Salvador-BA, Brazil
eInstituto Multidisciplinar em Saúde, Universidade Federal da Bahia, Rua Rio de Contas, 58,
Bairro Candeias, 45029-064 Vitória da Conquista-BA, Brazil
Levels of As, Cd, Cr, Cu, Li, Mn, Mo, Ni, Pb, Sb and Se in muscle, gill, stomach, liver, kidney and gonad tissues of six different fish species (Caranx latus, Bagre marinus, Archosargus rhomboidalis, Lutjanus synagris, Scomberomorus cavalla and Sphyraena guachancho) from the
Todos os Santos Bay (Bahia State, Brazil) were evaluated. The elements were determined by inductively coupled plasma mass spectrometry (ICP-MS) after wet digestion using reflux system with a cold finger. The detected concentration ranges were as follows (mg kg-1 dry weight):
< 0.49-27.31 for As, < 0.013-1.12 for Cd, 0.38-6.05 for Cr, 0.17-28.12 for Cu, < 0.092-1.19 for Li, 0.16-55.9 for Mn, < 0.034-1.24 for Mo, < 0.067-15.57 for Ni, < 0.013-0.60 for Pb, < 0.144 for Sb and 0.57-14.6 for Se. Highest concentrations of trace elements were observed in kidney, liver and gill tissues.
Keywords: ICP-MS, PCA, food analysis, food safety, Todos os Santos Bay
Introduction
Fish consumption is an important dietary source of high-quality proteins, minerals, trace elements and essential fatty acids, including omega-3 acids. So, fish is an important source of food and essential nutrients to population of some regions, being part of the cultural traditions of many people.1 However, fish and seafood may pose risks to human health because they may contain toxic substances, such as trace elements and persistent organic pollutants.2
Fish serves as advantageous bioindicators because (i) they have long lifespans; (ii) they develop and live in
water allowing continuous monitoring of pollutants and simultaneous spatial integration of pollutant data; and (iii) they are relatively easy to sample.
Therefore, many studies have been conducted on the accumulation of trace elements in fish and other
organisms in aqueous environments.3 Fish incorporates
in metabolism, including gill, liver and kidney tissues, are known to accumulate greater amounts of trace elements than muscle.7-10
The pattern of trace elements distribution is usually evaluated using univariate procedures, but the use of multivariate pattern recognition techniques such as principal component analysis (PCA) and hierarchical cluster analysis (HCA) can provide further interpretation of results. PCA and HCA are multivariate analysis techniques commonly employed in the evaluation of food data allowing the establishment of similarities and differences in a data set.11-21
In this study, the contents of eleven trace elements (As, Cd, Cr, Cu, Li, Mn, Mo, Ni, Pb, Sb and Se) were determined in muscle, gills, stomach, liver, kidney and gonads of six selected fish species from Todos os Santos Bay, Bahia State, Brazil. The employed analytical technique was the inductively coupled plasma mass spectrometry
(ICP-MS) and the investigated fish species were Caranx
latus (“guarajuba”), Bagre marinus (“bagre”), Archosargus rhomboidalis (“sambuio”), Lutjanus synagris (“ariacó”), Scomberomorus cavalla (“cavala”) and Sphyraena guachancho (“bicuda”). These species were selected based
on their relevance to the commercial fishing in the Bahia State and to the fish consumption by the local population. Accumulation patterns relating organs and elements were evaluated using PCA and HCA to establish classification, and also to identify the key discriminants that distinguish the samples.
Experimental
Sample collection
Six different fish species (a total of 31 samples, fish species mentioned above) were collected from three suppliers of fresh fish in Salvador city (Bahia State, Brazil) during two subsequent summers (December 2010-January 2011, namely first period (S1), and December 2011-January 2012, namely second period (S2)) to minimize seasonal environmental variations as much as possible. Immediately after collection, the fish samples were stored on ice in an insulated box and promptly transferred to the laboratory.
Instrumentation
A quadrupole ICP-MS Xseries II (Thermo, Germany) equipped with a hexapole collision cell (CC) was used to determine the eleven trace element content in the samples. Internal standards (Ge, Rh, Tl, In, Bi and Sc) were added to compensate for any effects from acid treatment or instrumental drift.
The instrument software control allowed rapid switching between standard mode (no gas, cell vented to mass analyzer chamber) and CC mode, while continuously aspirating the sample. A premixed gas mixture containing H2 (7%) in He (H2O and other impurities at 5 ppm) was admitted into CC under flow control through stainless steel lines. The measurements were made using a nickel sampler, skimmer cones (1.0 and 0.7 mm diameter orifices) and a standard concentric nebulizer. A glass impact bead spray chamber (cooled to 4 °C by a Peltier cooler) and a shielded Fassel torch were used to minimize the plasma potential and thereby to obtain a low and narrow initial ion energy distribution.
Optimal values for instrumental parameters were: radio frequency applied power of 1.3 kW, plasma gas flow rate of 13 L min-1, auxiliary gas flow rate of 0.7 L min-1,
nebulizer gas flow rate of 0.87 L min-1, scanning mode
(peak jump), residence time of 10 ms, number of readings
per replicate equal to 3, conditions (140Ce16O+/140Ce and 137Ba++/137Ba+ < 2%) and CC mode gas flow equal to
6.5 L min-1. The isotopes measured in this study were
7Li, 53Cr, 55Mn, 60Ni, 65Cu, 75As, 82Se, 95Mo, 111Cd, 121Sb
and 208Pb. The external calibration was accomplished with aqueous solutions in the concentrations of 0.1, 0.5, 1.0, 1.5, 2.0, 4.0, 6.0, 8.0 and 10.0 µg L-1 in 1% (v/v) nitric acid. Internal standards (Tl, In, Bi, Ge, Rh and Sc) were added to compensate for any acid effects and instrument drift.
Reagents and solutions
All material, glassware and utensils were washed with water and distilled water. Then, they were all placed in a dilute solution of detergent (0.5% Extran) for 24 h, and after three washes with distilled water, were immersed in 10% HNO3 for an additional 24 h. All of these materials were then washed twice with distilled water, once with ultrapure water and then stored until analysis.
All solvents and reagents were of the highest commercially available purity grade. Deionized water (resistivity 18 MΩ cm) obtained from a Milli-Q Pluswater purification system (Millipore, Molsheim, France) was used to prepare all standard and sample solutions. Distilled nitric
acid and 30% (m/m) H2O2 (Merck, Darmstadt, Germany)
were used for sample digestion.
Monoelemental stock solutions (1 g L-1, high-purity
Sample preparation and digestion procedure
Following morphometric measurements of the total length and width of each fish, they were filleted, and the muscle tissue was separated from the organs on the same day of the collection to avoid sample degradation.
To analyze tissue-specific concentrations of trace elements, fish samples were dissected, and muscle, gills, stomach, liver, kidney and gonads were carefully separated from other tissues. After dissection, the tissue samples were homogenized, lyophilized, homogenized (particles ≤ 149 mol L-1, 100 µm mesh) and stored in labeled glass bottles. The lyophilization process was carried out with a vacuum pressure of 10 mmHg for ca. 36 h in a freezer at –40 °C. The humidity in the tissues was determined by wet and dry mass difference after lyophilization.
Digestion was carried out in a temperature-regulated block digester. Approximately 100 mg of sample were
digested with 6 mL of 14.1 mol L-1 HNO
3 and 3 mL of H2O2 in a block digester for 2 h at 180 ± 10 °C, using cold finger to prevent loss of volatile analytes and excessive evaporation of the acids during the heating.22 After cooling to ambient temperature, the solution was transferred to 35 mL capacity flasks, and the volume was adjusted with ultrapure water. All samples were analyzed in triplicate.
Validation studies
For every batch of digested samples, three blanks were prepared, and the accuracies of the employed methods were assessed using certified reference materials: CRM 1566b Oyster Tissue (National Institute of Standards and Technology) and DOLT-4 Dogfish Liver (National Research Council of Canada). The experimental results were in good agreement with the certified values.
The values obtained (in mg kg-1 dry weight) from the analysis of four replicates of these samples were as follows: (i) for CRM 1566b Oyster Tissue: Cd (certified 2.48 ± 0.08;
found 93%: 2.37 ± 0.1), Pb (certified 0.308 ± 0.009; found 103%: 0.317 ± 0.02), Ni (certified 1.04 ± 0.09; found 103%: 1.07 ± 0.03), Se (certified 1.80 ± 0.15; found 98%: 1.77 ± 0.2), Mn (certified 18.5 ± 0.2; found 91%: 16.7 ± 0.9) and Cu (certified 71.6 ± 1.6; found 101%: 67.45 ± 0.75); (ii) for DOLT-4 Dogfish Liver: Cd (certified 24.3 ± 0.8;
found 94%: 23.8 ± 0.3), Pb (certified 0.16 ± 0.04; found 90%: 0.14 ± 0.02), Ni (certified 0.97 ± 0.11; found 93%: 0.90 ± 0.09), Se (certified 8.3 ± 1.34; found 91%: 7.53 ± 0.46) and Cu (certified 31.2 ± 1.1; found 94%: 28.7 ± 0.2).
The limits of detection (LOD) and of quantification (LOQ) of each analyte were calculated as the analyte
concentration that corresponded to three and ten times, respectively, the standard deviation of ten independent measurements of the blank, divided by the slope of the calibration curve, multiplied by the dilution factor and divided by the sample mass used for sample preparation. The LOQ values obtained for the experimental method were as follows (in mg kg-1): 7Li = 0.092, 53Cr = 0.071, 55Mn = 0.021, 60Ni = 0.067, 65Cu = 0.095, 95Mo = 0.034, 111Cd = 0.013,
208Pb = 0.042 and 121Sb = 0.144, 75As = 0.102 and
82Se = 0.037.
Statistical analysis
Experimental data were evaluated by multivariate statistical techniques: PCA and HCA, using the computer software package 6.0 Statistica (Statsoft).
The chemical descriptors were the contents of each mineral element in the organs. The pattern recognition methods (PCA and HCA) were applied to the data matrix composed of 08 columns (concentrations of the elements) and 396 rows (organ samples) in order to differentiate between groups de organs. The elements Cd, Pb and Sb were not included in this analysis because they presented values below LOQ in most samples. The software package 6.0 Statistica was used for all the chemometric calculations. The data were auto-scaled prior to application of PCA and HCA.
Relationships between the concentrations of trace element in different tissues and between the concentrations of different trace elements within the same tissue were assessed by the Spearman’s non-parametric correlation test.23
Results and Discussion
Trace elements concentrations in tissues
The mean length and weight of all six fish species ranged from 25.7 ± 2.1 to 48.7 ± 0.6 cm and 268 ± 22 to 793 ± 32 g, respectively. The average percentage of humidity of the tissues was 77.4 ± 1.2%. Trace element concentrations in muscle, gill, stomach, liver, kidney and gonad tissues for the two sampling periods are shown in Tables 1 and 2.
The concentrations of different trace elements varied with species and the type of tissue analyzed. The concentrations of Li, Mo and Ni in muscle were below LOQ in all analyzed samples.
Manganese was detected in all of the examined fish samples, and its concentration, dependent on species and
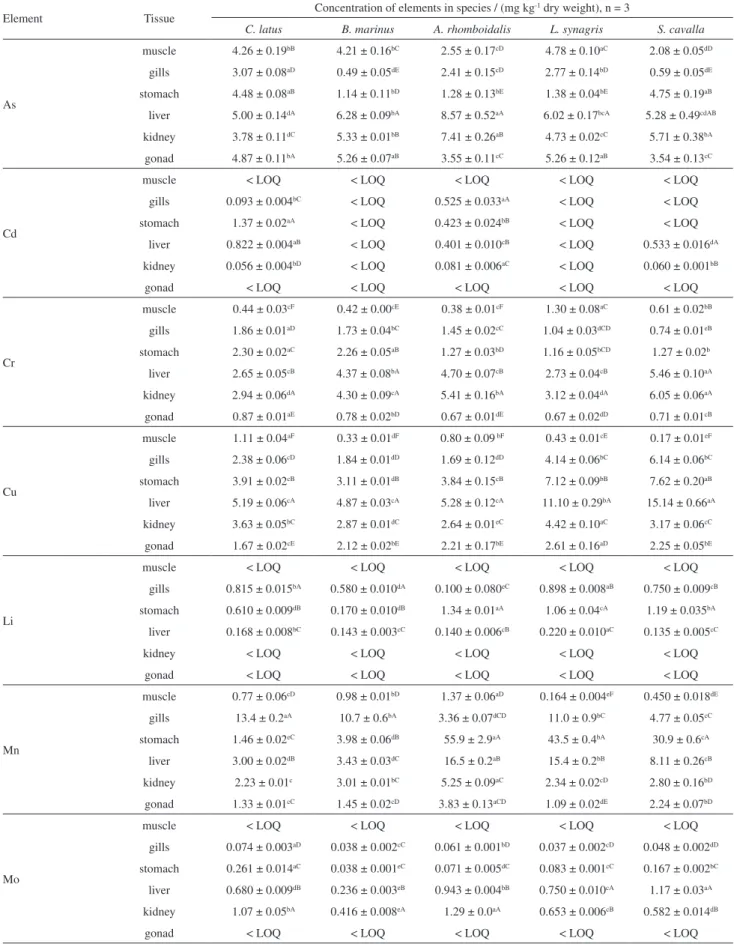
Table 1. Concentrations of trace elements in fish tissues from the Todos os Santos Bay, Bahia, Brazil (period S1: Dec/2010-Jan/2011)
Element Tissue Concentration of elements in species / (mg kg
-1 dry weight), n = 3
C. latus B. marinus A. rhomboidalis L. synagris S. cavalla
As
muscle 4.26 ± 0.19bB 4.21 ± 0.16bC 2.55 ± 0.17cD 4.78 ± 0.10aC 2.08 ± 0.05dD gills 3.07 ± 0.08aD 0.49 ± 0.05dE 2.41 ± 0.15cD 2.77 ± 0.14bD 0.59 ± 0.05dE
stomach 4.48 ± 0.08aB 1.14 ± 0.11bD 1.28 ± 0.13bE 1.38 ± 0.04bE 4.75 ± 0.19aB liver 5.00 ± 0.14dA 6.28 ± 0.09bA 8.57 ± 0.52aA 6.02 ± 0.17bcA 5.28 ± 0.49cdAB
kidney 3.78 ± 0.11dC 5.33 ± 0.01bB 7.41 ± 0.26aB 4.73 ± 0.02cC 5.71 ± 0.38bA gonad 4.87 ± 0.11bA 5.26 ± 0.07aB 3.55 ± 0.11cC 5.26 ± 0.12aB 3.54 ± 0.13cC
Cd
muscle < LOQ < LOQ < LOQ < LOQ < LOQ
gills 0.093 ± 0.004bC < LOQ 0.525 ± 0.033aA < LOQ < LOQ stomach 1.37 ± 0.02aA < LOQ 0.423 ± 0.024bB < LOQ < LOQ
liver 0.822 ± 0.004aB < LOQ 0.401 ± 0.010cB < LOQ 0.533 ± 0.016dA kidney 0.056 ± 0.004bD < LOQ 0.081 ± 0.006aC < LOQ 0.060 ± 0.001bB
gonad < LOQ < LOQ < LOQ < LOQ < LOQ
Cr
muscle 0.44 ± 0.03cF 0.42 ± 0.00cE 0.38 ± 0.01cF 1.30 ± 0.08aC 0.61 ± 0.02bB
gills 1.86 ± 0.01aD 1.73 ± 0.04bC 1.45 ± 0.02cC 1.04 ± 0.03dCD 0.74 ± 0.01eB stomach 2.30 ± 0.02aC 2.26 ± 0.05aB 1.27 ± 0.03bD 1.16 ± 0.05bCD 1.27 ± 0.02b
liver 2.65 ± 0.05cB 4.37 ± 0.08bA 4.70 ± 0.07cB 2.73 ± 0.04cB 5.46 ± 0.10aA kidney 2.94 ± 0.06dA 4.30 ± 0.09cA 5.41 ± 0.16bA 3.12 ± 0.04dA 6.05 ± 0.06aA
gonad 0.87 ± 0.01aE 0.78 ± 0.02bD 0.67 ± 0.01dE 0.67 ± 0.02dD 0.71 ± 0.01cB
Cu
muscle 1.11 ± 0.04aF 0.33 ± 0.01dF 0.80 ± 0.09 bF 0.43 ± 0.01cE 0.17 ± 0.01eF gills 2.38 ± 0.06cD 1.84 ± 0.01dD 1.69 ± 0.12dD 4.14 ± 0.06bC 6.14 ± 0.06bC
stomach 3.91 ± 0.02cB 3.11 ± 0.01dB 3.84 ± 0.15cB 7.12 ± 0.09bB 7.62 ± 0.20aB liver 5.19 ± 0.06cA 4.87 ± 0.03cA 5.28 ± 0.12cA 11.10 ± 0.29bA 15.14 ± 0.66aA
kidney 3.63 ± 0.05bC 2.87 ± 0.01dC 2.64 ± 0.01eC 4.42 ± 0.10aC 3.17 ± 0.06cC gonad 1.67 ± 0.02cE 2.12 ± 0.02bE 2.21 ± 0.17bE 2.61 ± 0.16aD 2.25 ± 0.05bE
Li
muscle < LOQ < LOQ < LOQ < LOQ < LOQ
gills 0.815 ± 0.015bA 0.580 ± 0.010dA 0.100 ± 0.080eC 0.898 ± 0.008aB 0.750 ± 0.009cB
stomach 0.610 ± 0.009dB 0.170 ± 0.010dB 1.34 ± 0.01aA 1.06 ± 0.04cA 1.19 ± 0.035bA liver 0.168 ± 0.008bC 0.143 ± 0.003cC 0.140 ± 0.006cB 0.220 ± 0.010aC 0.135 ± 0.005cC
kidney < LOQ < LOQ < LOQ < LOQ < LOQ
gonad < LOQ < LOQ < LOQ < LOQ < LOQ
Mn
muscle 0.77 ± 0.06cD 0.98 ± 0.01bD 1.37 ± 0.06aD 0.164 ± 0.004eF 0.450 ± 0.018dE
gills 13.4 ± 0.2aA 10.7 ± 0.6bA 3.36 ± 0.07dCD 11.0 ± 0.9bC 4.77 ± 0.05cC stomach 1.46 ± 0.02eC 3.98 ± 0.06dB 55.9 ± 2.9aA 43.5 ± 0.4bA 30.9 ± 0.6cA
liver 3.00 ± 0.02dB 3.43 ± 0.03dC 16.5 ± 0.2aB 15.4 ± 0.2bB 8.11 ± 0.26cB kidney 2.23 ± 0.01c 3.01 ± 0.01bC 5.25 ± 0.09aC 2.34 ± 0.02cD 2.80 ± 0.16bD
gonad 1.33 ± 0.01cC 1.45 ± 0.02cD 3.83 ± 0.13aCD 1.09 ± 0.02dE 2.24 ± 0.07bD
Mo
muscle < LOQ < LOQ < LOQ < LOQ < LOQ
gills 0.074 ± 0.003aD 0.038 ± 0.002cC 0.061 ± 0.001bD 0.037 ± 0.002cD 0.048 ± 0.002dD stomach 0.261 ± 0.014aC 0.038 ± 0.001eC 0.071 ± 0.005dC 0.083 ± 0.001cC 0.167 ± 0.002bC
liver 0.680 ± 0.009dB 0.236 ± 0.003eB 0.943 ± 0.004bB 0.750 ± 0.010cA 1.17 ± 0.03aA
kidney 1.07 ± 0.05bA 0.416 ± 0.008eA 1.29 ± 0.0aA 0.653 ± 0.006cB 0.582 ± 0.014dB
Ni
muscle < LOQ < LOQ < LOQ < LOQ < LOQ
gills 4.76 ± 0.11aC 3.51 ± 0.07bB 1.33 ± 0.03dD 2.12 ± 0.21cB 1.23 ± 0.06eC
stomach 3.76 ± 0.11aD 1.91 ± 0.05cD 2.32 ± 0.11bC 0.88 ± 0.01eD 1.07 ± 0.05dD liver 5.88 ± 0.10aB 2.66 ± 0.03cC 5.17 ± 0.23bB 1.90 ± 0.07eC 2.52 ± 0.03dB
kidney 9.11 ± 0.10aA 6.33 ± 0.14cA 8.46 ± 0.17bA 5.86 ± 0.09dA 4.08 ± 0.05eA gonad 0.21 ± 0.01aE 0.120 ± 0.001cE 0.141 ± 0.002bE 0.070 ± 0.005eE 0.080 ± 0.004dE
Se
muscle 1.80 ± 0.07cE 0.73 ± 0.0eE 2.71 ± 0.08aD 2.19 ± 0.0 bC 1.50 ± 0.04dE
gills 1.03 ± 0.06bF 0.57 ± 0.03eF 2.66 ± 0.11aE 0.88 ± 0.02dF 0.94 ± 0.03cF stomach 10.2 ± 0.1aC 3.24 ± 0.10bC 2.85 ± 0.14cC 1.21 ± 0.02eE 1.60 ± 0.02dD
liver 12.5 ± 0.2aB 5.87 ± 0.015dB 10.0 ± 0.1bB 4.72 ± 0.06eB 8.41 ± 0.35cB kidney 14.6 ± 0.3aA 6.74 ± 0.06dA 11.8 ± 0.5bA 4.92 ± 0.12eA 9.01 ± 0.02cA
gonad 4.34 ± 0.17bD 2.33 ± 0.12dD 4.80 ± 0.17a 2.06 ± 0.06eD 3.37 ± 0.16cC SD: standard deviation; LOQ: limit of quantification. The mean ± SD for elements designated by different lowercase superscript letters are significantly different from other samples in the same column (i.e., between tissues for one species); (Mann-Whitney U test, p < 0.05). The mean ± SD for elements
designated by different uppercase superscript letters are significantly different from other samples in the same row (i.e., between species); (Mann-Whitney U test, p < 0.05). LOQ (mg kg-1): Cd (0.013), Li (0.092), Mo (0.034) and Ni (0.067).
Table 1. Concentrations of trace elements in fish tissues from the Todos os Santos Bay, Bahia, Brazil (period S1: Dec/2010-Jan/2011) (cont.)
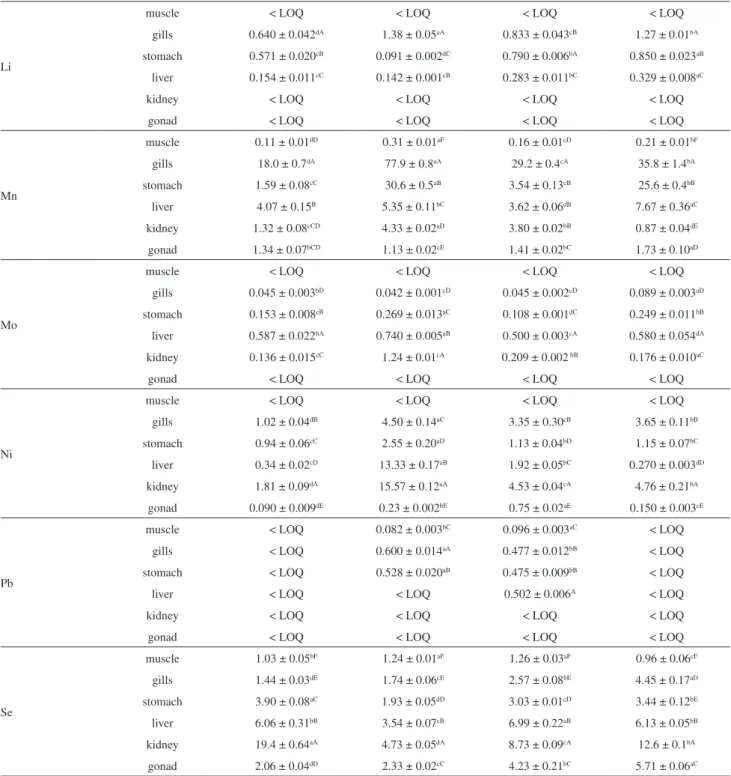
Table 2. Concentrations of trace elements in fish tissues from the Todos os Santos Bay, Bahia, Brazil (period S2: Dec/2011-Jan/2012)
Element Tissue Concentration of elements in species / (mg kg
-1 dry weight), n = 3
C. latus A. rhomboidalis L. synagris S. guachancho
As
muscle 2.38 ± 0.08cD 1.28 ± 0.04dD 2.73 ± 0.21bE 5.17 ± 0.03aD
gills 3.69 ± 0.20cA 2.83 ± 0.09cC 18.57 ± 0.59aB 13.01 ± 0.59bA stomach 3.53 ± 0.12cC 7.62 ± 0.05cA 27.31 ± 1.50aA 12.37 ± 0.24bA
liver 7.43 ± 0.46cE 9.08 ± 0.06dA 16.42 ± 0.42aC 13.7 ± 0.21bA kidney 4.69 ± 0.18cB 4.24 ± 0.12cA 9.79 ± 0.02bD 11.33 ± 0.38aB
gonad 5.00 ± 0.18cB 7.78 ± 0.16dB 14.02 ± 0.52aB 8.38 ± 0.11bC
Cd
muscle < LOQ < LOQ < LOQ < LOQ
gills 0.127 ± 0.007bC < LOQ 0.248 ± 0.01aB < LOQ
stomach 1.12 ± 0.01bA < LOQ 0.159 ± 0.007aC 0.171 ± 0.008aA liver 0.961 ± 0.024cB < LOQ 0.481 ± 0.003aA 0.540 ± 0.020bB
kidney 0.072 ± 0.003bD < LOQ 0.047 ± 0.001bD < LOQ
gonad < LOQ < LOQ < LOQ < 0.014
Cr
muscle 0.43 ± 0.01cC 0.61 ± 0.01bF 0.58 ± 0.01bE 1.06 ± 0.06aE gills 0.55 ± 0.01dA 1.63 ± 0.03bC 1.43 ± 0.09cD 1.98 ± 0.11aC
stomach 0.44 ± 0.0 dBC 1.54 ± 0.07cD 1.67 ± 0.00bC 1.81 ± 0.04aC liver 0.45 ± 0.02dB 1.89 ± 0.03bB 1.64 ± 0.02cC 2.29 ± 0.11aB
kidney 0.35 ± 0.02cD 2.21 ± 0.01bA 2.22 ± 0.03bA 3.22 ± 0.08aA
gonad 0.26 ± 0.01dE 1.10 ± 0.01cE 1.80 ± 0.06aB 1.44 ± 0.07bD
Cu
muscle 1.30 ± 0.10aF 0.45 ± 0.02bE 0.33 ± 0.01bcD 0.18 ± 0.01cC
gills 3.41 ± 0.21aD 2.58 ± 0.10bC 3.12 ± 0.20aC 1.14 ± 0.05cC stomach 4.74 ± 0.18bA 2.44 ± 0.10dCD 6.44 ± 0.21bB 15.85 ± 0.26aB
liver 6.82 ± 0.09bA 8.14 ± 0.18bA 9.01± 0.30bA 28.12 ± 1.65aA kidney 3.92 ± 0.04cC 4.11 ± 0.02bB 3.16 ± 0.08dC 13.47 ± 0.07aB
Li
muscle < LOQ < LOQ < LOQ < LOQ
gills 0.640 ± 0.042dA 1.38 ± 0.05aA 0.833 ± 0.043cB 1.27 ± 0.01bA
stomach 0.571 ± 0.020cB 0.091 ± 0.002dC 0.790 ± 0.006bA 0.850 ± 0.023aB liver 0.154 ± 0.011cC 0.142 ± 0.001cB 0.283 ± 0.011bC 0.329 ± 0.008aC
kidney < LOQ < LOQ < LOQ < LOQ
gonad < LOQ < LOQ < LOQ < LOQ
Mn
muscle 0.11 ± 0.01dD 0.31 ± 0.01aF 0.16 ± 0.01cD 0.21 ± 0.01bF
gills 18.0 ± 0.7dA 77.9 ± 0.8aA 29.2 ± 0.4cA 35.8 ± 1.4bA stomach 1.59 ± 0.08cC 30.6 ± 0.5aB 3.54 ± 0.13cB 25.6 ± 0.4bB
liver 4.07 ± 0.15B 5.35 ± 0.11bC 3.62 ± 0.06dB 7.67 ± 0.36aC kidney 1.32 ± 0.08cCD 4.33 ± 0.02aD 3.80 ± 0.02bB 0.87 ± 0.04dE
gonad 1.34 ± 0.07bCD 1.13 ± 0.02cE 1.41 ± 0.02bC 1.73 ± 0.10aD
Mo
muscle < LOQ < LOQ < LOQ < LOQ
gills 0.045 ± 0.003bD 0.042 ± 0.001cD 0.045 ± 0.002cD 0.089 ± 0.003aD stomach 0.153 ± 0.008cB 0.269 ± 0.013aC 0.108 ± 0.001dC 0.249 ± 0.011bB
liver 0.587 ± 0.022bA 0.740 ± 0.005aB 0.500 ± 0.003cA 0.580 ± 0.054dA kidney 0.136 ± 0.015cC 1.24 ± 0.01cA 0.209 ± 0.002 bB 0.176 ± 0.010aC
gonad < LOQ < LOQ < LOQ < LOQ
Ni
muscle < LOQ < LOQ < LOQ < LOQ
gills 1.02 ± 0.04dB 4.50 ± 0.14aC 3.35 ± 0.30cB 3.65 ± 0.11bB
stomach 0.94 ± 0.06cC 2.55 ± 0.20aD 1.13 ± 0.04bD 1.15 ± 0.07bC liver 0.34 ± 0.02cD 13.33 ± 0.17aB 1.92 ± 0.05bC 0.270 ± 0.003dD
kidney 1.81 ± 0.09dA 15.57 ± 0.12aA 4.53 ± 0.04cA 4.76 ± 0.21bA gonad 0.090 ± 0.009dE 0.23 ± 0.002bE 0.75 ± 0.02aE 0.150 ± 0.003cE
Pb
muscle < LOQ 0.082 ± 0.003bC 0.096 ± 0.003aC < LOQ gills < LOQ 0.600 ± 0.014aA 0.477 ± 0.012bB < LOQ
stomach < LOQ 0.528 ± 0.020aB 0.475 ± 0.009bB < LOQ
liver < LOQ < LOQ 0.502 ± 0.006A < LOQ
kidney < LOQ < LOQ < LOQ < LOQ
gonad < LOQ < LOQ < LOQ < LOQ
Se
muscle 1.03 ± 0.05bF 1.24 ± 0.01aF 1.26 ± 0.03aF 0.96 ± 0.06cF
gills 1.44 ± 0.03dE 1.74 ± 0.06cE 2.57 ± 0.08bE 4.45 ± 0.17aD stomach 3.90 ± 0.08aC 1.93 ± 0.05dD 3.03 ± 0.01cD 3.44 ± 0.12bE
liver 6.06 ± 0.31bB 3.54 ± 0.07cB 6.99 ± 0.22aB 6.13 ± 0.05bB kidney 19.4 ± 0.64aA 4.73 ± 0.05dA 8.73 ± 0.09cA 12.6 ± 0.1bA
gonad 2.06 ± 0.04dD 2.33 ± 0.02cC 4.23 ± 0.21bC 5.71 ± 0.06aC SD: standard deviation; LOQ: limit of quantification. The mean ± SD for elements designated by different lowercase superscript letters are significantly different from other samples in the same column (i.e., between tissues for one species). (Mann-Whitney U test, p < 0.05). The mean ± SD for elements
designated by different uppercase superscript letters are significantly different from other samples in the same row (i.e., between species). (Mann-Whitney U test, p < 0.05). LOQ (mg kg-1): Cd (0.013), Li (0.092), Mo (0.034), Ni (0.067) and Pb (0.042).
Table 2. Concentrations of trace elements in fish tissues from the Todos os Santos Bay, Bahia, Brazil (period S2: Dec/2011-Jan/2012) (cont.)
1.46-55.9 mg kg-1 in stomach, 3.36-77.9 mg kg-1 in gills, 3.00-16.5 mg kg-1 in liver, 0.87-5.25 mg kg-1 in kidney and 1.09-3.83 mg kg-1 in gonads. The highest concentrations
of Mn were found in the gill (77.9 ± 0.8 mg kg-1) and
stomach (55.9 ± 2.9 mg kg-1) tissues of A. rhomboidalis.
The maximum Mn level in fish permitted for human
consumption is 1 µg g-1 according to the World Health
Organization (WHO) guideline.24 For the samples analyzed
in this study, only the Mn levels (1.37 mg kg-1) in the
permissible limits. Manganese concentrations reported by previous research ranged from 0.07 to 7.3 mg kg-1 in the muscle of fish captured along the Rio de Janeiro State coast, Brazil.3
Copper is vital for the biological transfer of electrons, for the synthesis of red blood cells and for the preservation of nervous system structure and function. However, high Cu intake is known to result in adverse health effects. The provisional tolerable daily intake (PTDI) for copper, sets as a limit for metal intake based on body weight for an average adult (60 kg body weight), is 3 mg.25 The observed
Cu concentrations varied from 0.17 to 1.30 mg kg-1 in
muscle, 1.14 to 6.14 mg kg-1 in gills, 2.44 to 15.85 mg kg-1
in stomach, 4.87 to 28.12 mg kg-1 in liver, 2.64 to
13.47 mg kg-1 in kidney and 1.67 to 2.87 mg kg-1 in gonads. The highest Cu concentration (28.12 mg kg-1) was found in liver tissues of S. guachancho sampled during the S2
period. A similar trend was found in a recent work for fish species collected from the aquatic ecosystems of Moldova, Ukraine.10 Previous analyses of muscle tissue from other Brazilian fish species demonstrated Cu values that ranged from 0.03 to 23.5 mg kg-1.3
Nickel is also essential for normal growth and reproduction in mammals but is carcinogenic when
consumed in exceedingly high amounts.26 The minimum
and maximum concentrations were found to range from 1.02-4.76 mg kg-1 in gills, 0.88-3.76 mg kg-1 in stomach, 0.34-13.33 mg kg-1 in liver, 1.81-15.57 mg kg-1 in kidney and 0.070 to 0.75 mg kg-1 in gonads. The highest values
of Ni were in the kidney (15.57 mg kg-1) and liver
(13.33 mg kg-1) of A. rhomboidalis sampled during S2. The concentrations of Ni in muscle were below the LOQ values in all analyzed samples. A comparison of the mean Ni values with previous reports suggests that the results in the present study26,27 are generally lower than those in other studies.
Chromium is an essential mineral and has been implicated in carbohydrate, lipid, and protein metabolism.28 The Cr concentrations for the two sampling periods ranged from 0.38-1.30 mg kg-1 in muscle, 0.44-2.30 mg kg-1 in stomach, 0.55-1.98 mg kg-1 in gills, 0.45-5.46 mg kg-1 in liver, 0.35-6.05 mg kg-1 in kidney and 0.26-1.44 mg kg-1 in gonads. The highest Cr concentrations were found in kidney tissue followed by liver for S. cavalla. Muscle samples from
two fish species, L. synagris and S. guachancho, exceeded
the Brazilian standard for consumption, 0.1 mg kg-1.29 Selenium is an essential micronutrient that is vital to biological systems in small amounts, but there is a narrow exposure range between the essential dose and toxicity in fish.30 The measured levels of Se ranged from 0.73-2.19 mg kg-1 in muscle, 1.21-10.2 mg kg-1 in stomach,
0.57-4.45 mg kg-1 in gills, 3.54-12.5 mg kg-1 in liver, 4.73-19.4 mg kg-1 in kidney and 2.06-5.71 mg kg-1 in gonads.
The highest concentrations of Se were found in kidney and liver, which are known target organs for Se because they function in Se metabolism. Mean selenium concentrations reported by previous research in the kidney and liver tissues of Capoeta trutta collected from four sites
of Keban Dam Lake, Turkey,30 were lower than our own
results for fish samples from Todos os Santos Bay. The Se concentration range in muscle tissue has been reported as 0.002-0.3 mg kg-1 and 2.046-5.167 mg kg-1 for different fish species and tissues.3,31
M o l y b d e n u m t i s s u e c o n t e n t r a n g e d f r o m 0.038-0.269 mg kg-1 in stomach, 0.037-0.089 mg kg-1 in gills, 0.236-1.17 mg kg-1 in liver and 0.136-1.29 mg kg-1 in kidney. The Mo concentrations in muscle and gonad tissues
were below the LOQ (0.034 mg kg-1). Liver and kidney
tissues demonstrated a high capacity to bioaccumulate Mo. In general, organs involved in metabolism, i.e., gills, liver, and kidney, often accumulate greater amounts of trace elements than muscle. No previous reports of Mo concentrations in fish samples could be found to compare with the results of the present study.
Lithium content in the analyzed fish samples ranged from 0.17-1.19 mg kg-1 in stomach, 0.10-0.89 mg kg-1 in gills and 0.13-0.22 mg kg-1 in liver. The Li concentrations in muscle, kidney and gonad tissues were below the LOQ (0.092 mg kg-1). Detectable Li concentrations were found in the stomach and gills, which suggests that the main Li exposure route in fish is via food intake. Few studies have reported Li concentrations in fish tissues. Comparison with the mean Li values in previous reports suggests that the results of the present study are generally lower than those reported in other studies.32 Guérin et al.32 measured a range of Li concentrations (mg kg-1 wet weight) in liver and gill tissues: liver (0.15 to 0.57), gill (0.22 to 0.30).2 In the
present study, the measured concentrations were (mg kg-1
wet weight) 0.030 to 0.073 in liver and 0.023 to 0.317 in gill tissue.
Cadmium is a non-essential element found in foods and natural waters with potential toxicity to fishes even at low levels. The Cd concentrations in the fish tissues analyzed in this study were 0.159-1.366 mg kg-1 in stomach, 0.093-0.525 mg kg-1 in gills, 0.401-0.961 mg kg-1 in liver, and 0.047-0.081 mg kg-1 in kidney. Cd concentrations in muscle and gonad tissues were below the LOQ. The highest Cd concentrations were found in the stomach and liver tissues of C. latus. Several studies have reported Cd levels
studies of Brazilian fish, the Cd concentrations in muscle tissue ranged from < 0.003 to 0.047 mg kg-1 and 0.014 to 0.123 mg kg-1.3,6
Lead is also a non-essential element, and it is well documented that Pb can cause neurotoxicity,
nephrotoxicity, and many other adverse health effects.34
The lead concentration for all samples collected in the first summer period was below the limit of quantification for the method (< 0.042 mg kg-1). The concentrations of Pb in the analyzed samples from the second sampling
period ranged from 0.475-0.528 mg kg-1 in stomach,
0.477-0.600 mg kg-1 in gills and < 0.042-0.502 mg kg-1 in liver. Lead was detected only in tissues of two species (A. rhomboidalis and L. synagris). Researchers reported
higher Pb concentrations in liver tissues than those
measured in the present study.33 Previous analyses of
different fish species from Brazil demonstrated mean concentrations of Pb in muscle tissue that ranged from 0.01 to 0.5 mg kg-1,3 and 0.10 to 5.4 mg kg-1.6
The measured concentrations of trace elements varied significantly depending on the analyzed tissue (p < 0.05). The muscle and gonad tissues contained lower
concentrations of trace elements, with levels below LOQ for Mo, Li, Cd, Pb and Sb. The highest concentrations of trace elements were found in kidney, liver and gill tissues.
The liver demonstrated an increased potential to accumulate various trace elements, contributing significantly to the storage of metals in fish. This potential to preferentially concentrate trace elements in liver over muscle may result from an increased reaction rate with metallothioneins present in liver.28,31,35
Although gill tissue does not maintain high metabolic activity, it still showed a relevant accumulation of most
of the studied analytes, including Mn, Li and Cd. This can be explained by adsorption of trace elements onto the gill surface, resulting in increased concentrations of trace elements. Thus, analyte concentrations in gill may be an indicative of the exposure route for trace elements, i.e., exposure to polluted aquatic environments.
The muscle does not actively accumulate trace elements because of its metabolic rate.36 However, high trace element concentrations in soft tissues (muscles and skin) have been reported for fish in polluted regions and, in several cases, these concentrations have exceeded acceptable levels. Therefore, the evaluation of trace element concentrations in muscle and regulation of these concentrations is important for generating estimates of the quantities of metals that
humans may consume.37
For all the tissues analyzed, the contaminant element concentrations were significantly different between the two sampling periods (Tables 1 and 2), except for the concentration of arsenic in the gonads of C. latus (Table 2).
Relationships between the concentrations of trace elements in all tissues revealed that As, Se and Li concentrations were not significantly associated with other elements. A significant correlation was observed mainly involving pairs of elements with Ni, Mn or Cd. Significant correlations were found as follows: Cu-Ni (0.70), Mn-Cr (−0.82), Mn-Ni (0.70), Cr-Ni (−0.64), Ni-Cd (0.86), Ni-Pb (−0.69), Mo-Cd (0.76) and Cd-Pb (−0.69).
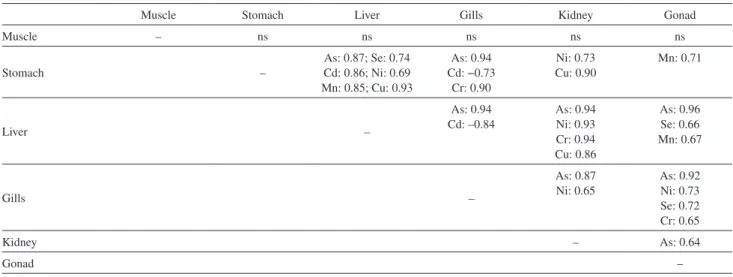
Relationships between trace element concentrations in tissues revealed a high correlation involving liver and kidney tissues (Table 3), mainly for the potential of contaminating chemical elements (As, Cd, Cr and Ni). This high correlation may be related to the function of these organs in the body’s detoxification process.
Table 3. Relationships between trace element concentrations in tissues
Muscle Stomach Liver Gills Kidney Gonad
Muscle – ns ns ns ns ns
Stomach –
As: 0.87; Se: 0.74 Cd: 0.86; Ni: 0.69 Mn: 0.85; Cu: 0.93
As: 0.94 Cd: −0.73
Cr: 0.90
Ni: 0.73 Cu: 0.90
Mn: 0.71
Liver –
As: 0.94 Cd: –0.84
As: 0.94 Ni: 0.93 Cr: 0.94 Cu: 0.86
As: 0.96 Se: 0.66 Mn: 0.67
Gills –
As: 0.87 Ni: 0.65
As: 0.92 Ni: 0.73 Se: 0.72 Cr: 0.65
Kidney – As: 0.64
Gonad –
Research has suggested that a consistent association between metals indicates a similarity in their biochemical
mechanisms in the tissue.38 However, studies reporting
the relationship between the chemical elements in aquatic organism tissues are still incipient.39
In Brazil, according to the Agência Nacional de Vigilância Sanitária (ANVISA), the permissible limits for Cr and Se in fish designated for human consumption are 0.10 and 0.30 mg kg-1 of wet weight, respectively,40 and for Cd and Pb are 0.05-0.30 and 0.30 mg kg-1 of wet
weight, respectively.29 The European Commission (EC)
has set upper limits of 0.05 and 0.3 mg kg-1 of wet weight for Cd and Pb, respectively.41 The Food and Agriculture Organization (FAO) established limits for Cd and Pb in fish for human consumption of 0.5 and 0.05 mg kg-1 of wet weight, respectively.42 To compare the data obtained in this study with the prescribed limits, all muscle concentrations were standardized on a wet weight basis.
Comparing the trace element concentrations measured in muscle with the maximum values established by ANVISA (Table 4), the concentrations of Cu, Cr, Se, Ni, Pb and Cd were all well below the tolerable limits for food. However, analyzed muscle tissues demonstrated concentrations of Cr and Se that exceeded these limits. Chromium concentrations were 2 to 3 times greater than the limit for L. synagris and S. guachancho. The measured
Se concentrations exceeded the tolerable limits for human
consumption in 45% of the muscle samples for C. latus,
A. rhomboidalis, L. synagris and S. cavalla collected during
the S1 period. Se high levels were also found in muscles and viscera of other organisms from the region of the Todos os Santos Bay.39
In addition, all samples collected during the S2 period demonstrated concentrations that approached the limits. Arsenic concentrations found in muscle exceeded the tolerable limits in 20% of the samples (L. synagris and
S. guachancho). Importantly, the concentrations of Cr
exceeded the legal limits in 20% of the samples, and the Se concentrations exceeded the legal limits in nearly half of the samples (45%). The presence of these elements in the edible tissues of fish is worrisome because it suggests environmental contamination. Additional studies should be conducted to determine the chemical speciation of these elements because the resultant toxicity is chemical species dependent.
Data evaluation using PCA and HCA
The experimental data obtained in the two considered periods were evaluated by PCA. A data matrix involving 8 elements as columns and the samples as rows was constructed, being the data auto-scaled because the element concentrations are of different orders of magnitude.
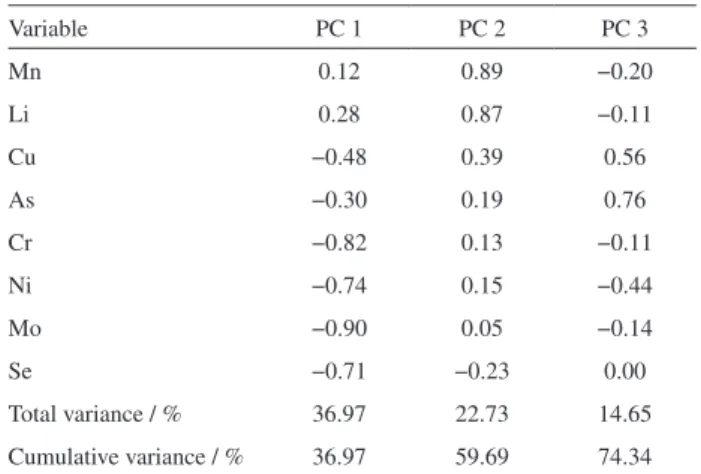
The loadings of the original variables on the first three principal components and the variances explained by each principal component are shown in Table 5.
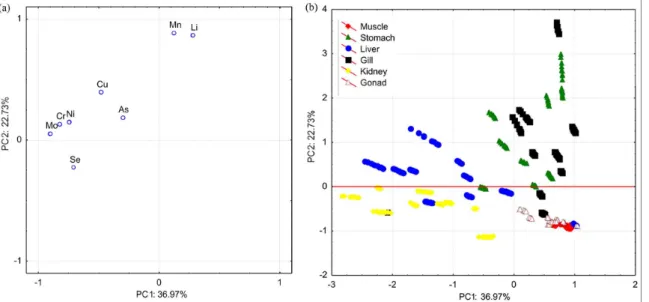
The data were modeled considering the first three components for a total variance of 74.34%, being that the dominant variables for the first principal component (PC1) are: chromium, molybdenum, nickel and selenium. All these four elements contribute to the major variability shown in the samples, and they are positively correlated, although all with negative loadings. An evaluation of Figures 1a and 1b reveals that the samples of kidneys and livers have the highest concentrations for these four elements.
This observation is possible because liver and kidney samples were clustered in the negative axis of the PC1 score graph and similarly the variables (molybdenum, chromium, nickel and selenium) are positioned on the negative axis of Table 4. Comparing the concentrations of the chemical elements
investigated the maximum values allowed by current Brazilian legislation
Element Brazilian legislation / (µg g-¹ wet weight)a Found concentration range / (µg g-¹ wet weight)
Cu 30.0 0.04-0.25
Cr 0.10 0.09-0.30
Se 0.30 0.17-0.50
Ni 5.0 < 0.005
Pbb 0.30 0.019-0.022
Cdb 0.05-0.30 < 0.001
Asb 1.0 0.48-1.19
aANVISA, 1965; bANVISA 2013.
Table 5. Loading matrix from principal component analysis and total
variance explained
Variable PC 1 PC 2 PC 3
Mn 0.12 0.89 −0.20
Li 0.28 0.87 −0.11
Cu −0.48 0.39 0.56
As −0.30 0.19 0.76
Cr −0.82 0.13 −0.11
Ni −0.74 0.15 −0.44
Mo −0.90 0.05 −0.14
Se −0.71 −0.23 0.00
PC1 in the loading graph. For the same reason, it can be affirmed that gill, gonads, muscle and stomach samples, which are positioned on the positive axis of the PC1 score graph, have low concentrations of these four elements.
The second principal component (PC2) accounts for 22.73% of the total variance, including lithium and manganese as the dominant variables. Figures 1a and 1b show that some samples of gills and stomachs have the highest concentrations of these two elements. From Figure 1a, Mn and Li are positioned in the positive axis PC2 loading graph, in this way, samples having high concentrations of these elements also will position in the positive axis PC2 score plot.
Figure 1. (a) Loading graph of PC1 × PC2 and (b) score graph of PC1 × PC2 for fish organ samples.
Figure 2. Dendogram of the fish tissue samples: (A) liver and kidney, (B) gill and stomach and (C) muscle and gonad.
Considering the loadings of the elements as Table 4, an analysis of the Figure 1b shows that the muscle and gonad samples have the lowest concentration of the elements: arsenic, chromium, copper, lithium, manganese, molybdenum, nickel and selenium. These results are compatible with papers published in which fish muscles always exhibited the lower metal concentrations compared with other tissues such as the skin, gills, intestine, liver and kidney.21
group was formed by liver and kidney samples. A second group involved the gill and stomach samples. The gonad and muscle samples formed the third group. The HCA results are compatible with those found by PCA results.
Conclusions
To the best of our knowledge, this is the first detailed report of selected trace elements in tissues of fish species from the Todos os Santos Bay, Bahia State, Brazil; therefore, only limited comparisons of our results with other data can be made.
In general, muscle and gonads accumulated the lowest levels of trace elements, and the highest concentrations were found in kidney, liver and gills. Levels of Cr, Se, Cd and Pb in fish tissues were found to exceed the permissible levels set for food, according to the Brazilian, EC and FAO standards. The levels of Cd and Pb in the edible parts of the fish were below the proposed limits for human consumption. Statistically significant differences were observed in the mean trace element values obtained from different fish species and their tissues.
This study also underscores the extreme importance of performing speciation studies and surveillance programs to provide important data regarding fish population health and human consumption.
Acknowledgments
The authors would like to acknowledge the support of Fundação de Amparo a Pesquisa do Estado da Bahia (FAPESB, Brazil), Conselho Nacional de Desenvolvimento Científico e Tecnológico (CNPq, Brazil), Instituto Nacional de Ciência e Tecnologia (INCT), Energia e Ambiente, Petróleo Brasileiro S. A. (Petrobras, Brazil) and Coordenação de Aperfeiçoamento de Pessoal de Nível Superior (CAPES, Brazil).
References
1. Food and Agriculture Organization of the United Nations/World Health Organization (FAO/WHO); Report of the Joint FAO/ WHO Expert Consultation on the Risks and Benefits of Fish
Consumption; FAO/WHO: Rome, Italy, 2011, p. 50.
2. Guérin, T.; Chekri, R.; Vastel, C.; Sirot, V.; Volatier, J.; Leblanc, J.; Noel, L; Food Chem. 2011, 127, 934.
3. Medeiros, R. J.; Santos, L. M. G.; Freire, A. S.; Santelli, R. E.; Braga, A. M. C. B.; Krauss, T. M.; Jacob, S. C; Food Control
2012, 23, 535.
4. Azevedo, J. S.; Sarkis, J. E. S.; Hortellani, M. A.; Ladle, R. J.;
Water Air Soil Pollut. 2012, 223, 3911.
5. Bilandžić, N.; Sedak, M.; Ðokić, M.; Varenina, I.; Kolanović, B. S.; Ðurđica Božić, D.; Brstilo, M.; Šimić, B.; J. Food Compos. Anal. 2014, 35, 61.
6. Santos, L. F. P.; Trigueiro, I. N. S.; Lemos, V. A.; Furtunato, D. M. N.; Cardoso, R. C. V.; Food Control2013, 33, 193. 7. Fraser, M.; Surette, C.; Vaillancourt, C.; Environ. Sci. Pollut.
Res.; 2013, 20, 761.
8. Fraser, M.; Surette, C.; Vaillanc, C.; Environ. Sci. Pollut. Res.
2013, 20, 761.
9. Subotić, S.; Jeftić, Z. V.; Spasić, S.; Hegediš, A.; Krpo-Ćetković, J.; Lenhardt, M.; Environ. Sci. Pollut. Res. 2007, 20, 5309. 10. Zubcov, E.; Zubcov, N.; Ene, A.; Biletchi, L.; Environ. Sci.
Pollut. Res. 2012, 19, 2238.
11. Bigot, C.; Meile, J.; Kapitan, A.; Montet, D.; Food Control
2015, 48, 123.
12. Di Bella, G.; Lo Turco, V.; Potortì, A. G.; Bua, G. D.; Fede, M. R.; Dugo, G.; J. Food Compos. Anal. 2015, 44, 25. 13. Duedahl-Olesen, L.; Aaslyng, M.; Meinert, L.; Christensen, T.;
Jensen, A. H.; Binderup, M.-L.; Food Control2015, 57, 169. 14. Islam, M. S.; Ahmed, M. K.; Habibullah-Al-Mamun, M.;
Masunaga, S.; J. Food Compos. Anal. 2015, 42, 8. 15. Li, L.; Boyd, C. E.; Odom, J.; Food Control2014, 45, 70.
16. Aquino, F. J. T.; Augusti, R.; Alves, J. O.; Diniz, M. E. R.; Morais, S. A. L.; Alves, B. H. P.; Nascimento, E. A.; Sabino, A. A.; Microchem. J. 2014, 117, 127.
17. Aktas, A. B.; Ozen, B.; Tokatli, F.; Sen, I.; Food Chem. 2014,
161, 104.
18. Calanche, J.; Samayoa, S.; Alonso, V.; Provincial, L.; Roncales, R.; Beltran, J. A.; Food Control2013, 33, 126.
19. Zaragoza, P.; Fuentes, A.; Fernandez-Segovia, I.; Vivancos, J. L.; Rizo, A.; Ros-Lis, J. V.; Barat, J. M.; Martinez-Manez, R.;
Food Chem. 2013, 138, 1374.
20. Liu, X.; Xue, C.; Wang,Y.; Li, Z.; Xue, Y.; Xu, J.; Food Control
2012, 23, 522.
21. Low, K. H.; Zain, S. M.; Abas, M. R.; Food Anal. Methods2011,
4, 276.
22. Ferreira, S. L. C.; Silva, L. O. B.; Santana, F. A.; Junior, M. M. S.; Matos, G. D.; Santos, W. N. L.; Microchem. J. 2013, 106,
307.
23. Cohen, Y.; Cohen, J. Y.; Statistics and Data with R: an Applied Approach through Examples; Wiley & Sons: West Sussex, United Kingdom, 2008.
24. World Health Organization (WHO); Heavy Metals-Environmental Aspects. Environment Health Criteria Series:
Manganese; WHO/IPCS: Geneva, Switzerland, 1981, p. 17. 25. Food and Agriculture Organization of the United Nations/World
Health Organization (FAO/WHO); Summary and Conclusions - Joint Fao/Who Expert Committee on Food Additives Fifty-third
Meeting; FAO/WHO: Rome, Italy, 1999.
27. Malik, R. N.; Hashmi, M. Z.; Huma, Y.; Environ. Sci. Pollut. Res. 2014, 21, 1188.
28. Berg, J. M.; Tymoczko, J. L.; Stryer, L.; Bioquímica; Guanabara Koogan: Rio de Janeiro, Brazil, 2004.
29. Agência Nacional de Vigilância Sanitária (ANVISA); Dispõe sobre o Regulamento Técnico MERCOSUL sobre Limites Máximos de Contaminantes Inorgânicos em
Alimentos, Resolução RDC No. 42, de 29.08.2013, 2013,
http://www.abic.com.br/publique/media/RDC42-2013-ContaminantesInorganicos.pdf, accessed in April 2016. 30. Danabas, D.; Ural, M.; Bull. Environ. Contam. Toxicol. 2012,
89, 455.
31. Fallah, A. A.; Saei-Dehkordi, S.; Nematollahi, A.; Jafari, T.;
Microchem. J. 2011, 98, 275.
32. Guérin, T.; Chekri, R.; Vastel, C.; Sirot, V.; Volatier, J.; Leblanc, J.; Noel, L.; Food Chem.2011, 127, 934.
33. Tepe, Y.; Türkmen, M.; Türkmen, A.; Environ. Monit. Assess.
2008, 146, 277.
34. Garcia-Leston, J.; Mendez, J.; Pasaro, E.; Laffon, B.; Environ. Int. 2010, 36, 623.
35. Agency for Toxic Substances and Disease Registry (ATDSR);
CERCLA Priority List of Hazardous Substances, 2016, www.
atsdr.cdc.gov/SPL/index.html, accessed in April 2016. 36. Amado-Filho, G. M.; Salgado, L. T.; Rebelo, M. F.; Rezende,
C. E.; Karez, C. S.; Pfeiffer, W. C.; Braz. J. Biol. 2008, 68, 95.
37. Uysal, K.; Emre, Y.; Köse, E.; Microchem. J.2008, 90, 67. 38. Biney, C. A.; Ameyibor, E.; Water Air Soil Pollut. 1992, 63,
273.
39. Silva, E.; Viana, Z. C. V.; Onofre, C. R. E.; Korn, M. G. A.; Santos, V. L. C. S.; Braz. J. Biol. 2016, 76, 194.
40. Agência Nacional de Vigilância Sanitária (ANVISA); Decreto No. 55871, de 26.03.1965, referente a Normas Reguladoras do Emprêgo de Aditivos para Alimentos, 1965, http://portal.anvisa.gov.
br/wps/wcm/connect/414d248047458a7d93f3d73fbc4c6735/ DECRETO+N%C2%BA+55.871,+DE+26+DE+MAR% C3%87O+DE+1965.pdf?MOD=AJPERES, accessed in April 2016.
41. Commission Regulation (EC); No. 629/2008 of 2 July 2008 amending Regulation (EC) No. 1881/2006 Setting Maximum Levels for Certain Contaminants in Foodstuffs; Official Journal of the European Union 51, 6-9, 2008.
42. Nauen, C. E.; Compilation of Legal Limits for Hazardous Substances in Fish and Fishery Products; FAO Fisheries
Circular, 764: Rome, 1983, p. 102.
Submitted: January 26, 2016