Article
Printed in Brazil - ©2017 Sociedade Brasileira de Química0103 - 5053 $6.00+0.00
*e-mail: [email protected]
Determination of Elemental Impurities in Acyclovir Ointment and Raw Materials
Using Microwave Acid Digestion (MW-AD) and ICP-MS
Mario H. Gonzalez,*,a Caroline S. da Silva,b,c Clarice D. B. Amaral,b,c
Silmara R. Bianchi,d Luciano H. B. de Oliveira,a Jéssica S. Coelho,a
Andrea Oliveirae and Ana Rita A. Nogueirab
aDepartamento de Química e Ciências Ambientais, Universidade Estadual Paulista, UNESP,
CP 136, 15054-000 São José do Rio Preto-SP, Brazil
bEmbrapa Pecuária Sudeste, 13560-970 São Carlos-SP, Brazil
cGrupo de Análise Instrumental Aplicada, Departamento de Química, Universidade Federal deSão
Carlos, 13565-905 São Carlos-SP, Brazil
dEmbrapa Solos, 22460-000 Rio de Janeiro-RJ, Brazil
eDepartamento de Química, Universidade Federal do Paraná, 81531-980 Curitiba-PR, Brazil
Inorganic elements present in pharmaceutical products were determined by inductively coupled plasma-mass spectrometer (ICP-MS), employing microwave acid digestion as a sample preparation method. The most abundant isotopes, 75As+, 65Cu+, 52Cr+, 58Ni+, 208Pb+, and 51V+, were
determined in acyclovir ointment and its constituents. Elemental impurities in the pharmaceutical samples were determined using an inductively coupled plasma-universal cell technology-mass spectrometer (ICP-UCT-MS) operated in kinetic energy discrimination (KED) and standard mode. The accuracy of the method was assessed by means of addition and recovery experiments. Except for Cr, spiked recoveries of the elements added to the samples before microwave acid digestion (MW-AD) step were between 95.1 and 126%, and after MW-AD step ranged from 85.6 to 132%. Limits of detection (LOD) obtained by proposed method is in agreement to those required by the U.S. Pharmacopeia Convention (USP), showing that the ICP-MS technique is well suited for quantification of these elements. The LOD’s (ng L-1) for 51V+, 52Cr+, 58Ni+, 65Cu+, 75As+ and 208Pb+
in 1% v v-1 HNO
3 medium were: 2.2, 81.3, 91.9, 6.9, 0.2 and 3.1, respectively. The concentration
of the analytes in these samples presented a wide range, varying from 2.3 ± 0.8 µg kg-1 for As to
3446 ± 47 µg kg-1 for Cr.
Keywords: pharmaceutical product, elemental impurity, acyclovir, microwave acid digestion (MW-AD), ICP-MS
Introduction
Brazil currently ranks sixth in the world pharmaceutical market, and economic growth in this sector indicates that by 2016, Brazil will be ranked fourth.1 Globally, pharmaceuticals constitute a promising market, as evidenced by a survey conducted by Scrip Insights, which showed that total pharmaceutical retail sales in 2011 were approximate US$ 25.8 billion. Accompanying this expansion of the pharmaceutical market is a search for better quality medicines.2,3
In chapter 232, the United States Pharmacopeia5 limits the permissible amounts of elemental impurities in drug products manufactured using catalysts, as well as environmental contaminants that may be present in the drugs themselves, excipients, or pharmaceutical products. In this bulletin, exposure is attributed to three routes of administration, and limits are based on chronic exposure. Analytical methods for determining elemental impurities are described in chapter 233,6 including microwave acid digestion (MW-AD) for sample preparation, and determination using inductively coupled plasma mass spectrometry (ICP-MS).
Inorganic impurities must be monitored and controlled in the raw materials used to manufacture medicinal products, as well as in intermediates, active pharmaceutical ingredients (API), excipients, and the final pharmaceutical products.7 Methods that enable highly accurate and sensitive determination of metals in pharmaceutical substances are therefore needed in order to ensure compliance with the specifications, considering the safety and effectiveness of drugs produced for human consumption.8
Sample preparation is a critical step in any analytical procedure and is particularly important in ICP-MS determinations, because ICP-MS results can be severely affected by matrix and spectral interferences. Microwave irradiation provides an alternative to conventional methods used to heat chemical reactions.9 In order to minimize interferences in ICP-MS determinations and avoid suppression of the analytical signal, digests should have low residual carbon content (RCC) and low acidity. Microwave acid digestion (MW-AD) offers improved accuracy and reproducibility, while minimizing heat loss to the environment.10
Barin et al.11 reported the determination of As, Cd, Hg, and Pb in tricyclic active pharmaceutical ingredients (APIs), using ICP-MS after digestion employing microwave irradiation. The presence of aromatic rings and condensed aromatic structures in the samples meant that they were resistant to attack by nitric acid, even under conditions involving high pressures and temperatures. The recoveries of the elements evaluated were between 94 and 103%, and the RCC and acidity of the digests obtained using the microwave technique was compatible with ICP-MS.
The literature documents the appropriate spectrometer potentials for many applications involving the use of ICP-MS. This technique offers attractive advantages including multi-element detection, low detection limits, the possibility of isotope ratio measurements, analysis by isotope dilution, a wide linear range, high sensitivity and
accuracy, and easy coupling to separation techniques such as liquid chromatography. However, the accuracies which some isotopes are determined may be compromised by spectral and non-spectral interferences.12-14
Different strategies have been employed to reduce such spectral interferences, including the use of a collision and reaction interface (CRI),15 internal standards,16 mathematical correction equations,17 dynamic reaction cells (DRC),18 and kinetic energy discrimination (KED).19
The aim of this study was to optimize a microwave acid digestion (MW-AD) procedure for simultaneous determination of As, Cu, Cr, Ni, Pb and V by ICP-MS employing the standard mode, which allows the ICP-MS to be operated with the cell turned off, and second ICP-MS determination method evaluated was the KED mode, in acyclovir ointment and their manufacturer products disodium edetate, acyclovir API, non-ionic emulsifying wax, and methylparaben.
Experimental
Instrumentation
The pharmaceutical samples were digested using a microwave assisted acid digestion system with perfluoroalkoxy (PFA) closed vessels (Ethos 1600, Milestone, Sorisole, Italy) and equipped with sensors for pressure and temperature control.
Total carbon contents (TCC) were determined by elemental analysis employing the elemental analyzer CHNS/O (2400 Series II, PerkinElmer, USA). An inductively coupled plasma optical emission spectrometer with radial viewing ICP OES (Vista Pro, Varian, Mulgrave, Australia) was employed to residual carbon content (RCC) determination. The instrumental parameters adopted were: 40 MHz generator frequency; 1.3 kW RF power; 15 L min-1 plasma gas-flow rate; 1.5 L min-1 auxiliary gas-flow rate; 0.9 L min-1 nebulizer gas flow rate; cyclonic nebulization chamber; concentric nebulizer; 0.8 mL min-1 sample flow rate; and the analytical emission wavelengths (nm) C(I) 193.025.
Reagents and standards
Deionized water produced with a Milli-Q® System (Bedford, MA, USA) was used to prepare all solutions. All glassware was immersed in 10% (v v-1) HNO
3 for 36 h and rinsed with water. All reagents and solutions were prepared with analytical-grade reagents.
Reagent grade concentrated nitric acid (Carlo Erba, Italy) and 30% (m/m) hydrogen peroxide (Mallinckrodt, Mexico) were employed in the sample preparation.
Anhydrous potassium biphthalate (Synth, Diadema, Brazil) was used to prepare the carbon calibration curve for determinations of RCC. Reference analytical solution for ICP-MS analysis were prepared before use by serial dilutions of stock solutions containing 1000 mg L-1 of As, Cr, Cu, Ni, Pb and V (Fluka, Buchs, Switzerland) in solution containing 1% v v-1 of HNO
3.
Argon (99.999%) and helium (99.999%) gases were provided by White Martins (Sertãozinho, SP, Brazil). Argon was used for plasma generation, nebulization and also as auxiliary gas. Helium was used as collision gas.
Samples
The medicine samples analyzed were acyclovir ointment and its constituents, such as disodium edetate, acyclovir (API), non-ionic emulsifying wax and
methylparaben. Acyclovir is one of the most common antiviral drug that slows the growth and spread of the herpes virus in the body. The acyclovir is used to treat infections caused by herpes viruses, such as genital herpes, cold sores, shingles, and chicken pox.20 All analyzed samples were purchased from commercial pharmacy on the city of São Carlos, São Paulo, Brazil.
Sample preparation by microwave assisted acid digestion
All samples were lyophilized in glass flasks connected to the vacuum system of the freeze-drier, which operated at –195 ºC for 80 h, and further stored at –10 ºC. Approximately 200 mg of each sample was digested using 6.0 mL of HNO3 (7.0 mol L-1) and 2.0 mL of 30% v v-1 H2O2 in PFA closed vessels. The microwave heating was applied as follows: (i) 20 min to reach 160 ºC; (ii) 20 min hold at 160 ºC. Temperature was controlled by an internal temperature sensor. The heating program employed is in agreement with previous results obtained from a statistical experimental design. After digestion, the vessels were allowed to cool down and the samples and blank solutions were transferred to 14.0 mL volumetric flasks, and the volumes were made up with ultrapure water. Further dilution was performed to ensure 1% m v-1 of dissolved solids in each sample, as required in ICP-MS analysis. The procedure was performed in triplicate.
The statistical experimental design
In order to maximize the efficiency of digestion of the medicine samples, full factorial design for three independent variables was applied. The variables were power radiation, temperature and nitric acid concentration. The selection of low and high levels for each variable studied was based on literature concerning sample preparation assisted by microwave radiation.21
However, the total carbon content (TCC) present in the samples was previously determined by the elemental analyzer in order to evaluate the efficiency of the sample treatment proposed for the medicine samples. For this, the RCC of treated samples was determined by ICP OES according to Gouveia et al.22 Then, the TCC and RCC values were compared being possible to assess the efficiency of the proposed sample treatment.
Analytical performance and figures of merit
The limit of detection (LOD) was evaluated considering the standard deviation of 10 measurements of blank solution and the calibration curve slope value,
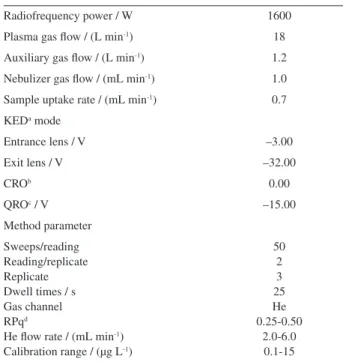
Table 1. Instrumental parameters for ICP-MS
Radiofrequency power / W 1600
Plasma gas flow / (L min-1) 18
Auxiliary gas flow / (L min-1) 1.2
Nebulizer gas flow / (mL min-1) 1.0
Sample uptake rate / (mL min-1) 0.7
KEDa mode
Entrance lens / V –3.00
Exit lens / V –32.00
CROb 0.00
QROc / V –15.00
Method parameter
Sweeps/reading Reading/replicate Replicate Dwell times / s Gas channel RPqd
He flow rate / (mL min-1)
Calibration range / (µg L-1)
50 2 3 25 He 0.25-0.50
2.0-6.0 0.1-15
aKED: kinetic energy discrimination; bCRO: cell rod offset; cQRO: quadrupole rod offset; dRPq: quadrupole dynamic bandpass
according to recommendations of the International Union of Pure and Applied Chemistry (IUPAC),23 that is, LOD = 3 × Sblank/slope. The accuracy of the method was determined using spiked medicine samples in two different concentration levels, 2.5 and 10 µg L-1, before and after microwave-assisted digestion (MW-AD). These experiments were performed in order to evaluate the analyte loss during the sample digestion and also to evaluate the possible spectral interferences that can occur in ICP-MS determinations.
Results and Discussion
The carbon content values obtained for different medicine samples are presented in Table 2. The total carbon contents varied from 32 to 72% for the medicine samples,
and the greatest concentration of carbon was found in non-ionic emulsifying wax.
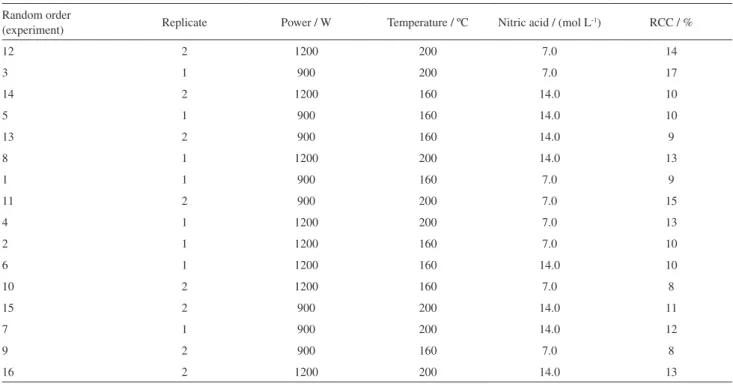
The 23 full factorial design was applied in acyclovir ointment to determine the most adequate sample treatment conditions that should be applied in the sample treatment step for the decomposition of each medicine sample studied. As can be seen in Table 3, the RCC values were obtained for each sample treatment conditions evaluated.
As observed in Table 3, a microwave radiation power of 900 W and the temperature applied of 160 ºC associated with a nitric acid concentration of 7.0 mol L-1 promoted suitable reaction conditions to obtain the decomposition of different medicine matrices studied (RCC about 8%). The evaluation of the RCC parameter provides a good estimate for evaluating the efficiency of the optimized sample treatment. In fact, the decomposition efficiencies afforded by the use of more dilute acid solutions create favorable conditions for the nitric acid regeneration in the presence of water and oxygen,24 which is responsible for improving the decomposition processes.
As can be seen in Figure 1, by Pareto chart, the variables temperature followed by the interactions factors temperature and nitric acid concentration were the most important factor affecting the efficiency digestion.
The RCC value reflects the efficiency of microwave digestion. Furthermore, the effectiveness of the digestion can be related to the chemical structures of organic
Table 3. Full factorial design 23 in two levels evaluated for each variable studied in the sample treatment step for acyclovir ointment sample (n = 2 for
each experimental condition evaluated)
Random order
(experiment) Replicate Power / W Temperature / ºC Nitric acid / (mol L
-1) RCC / %
12 2 1200 200 7.0 14
3 1 900 200 7.0 17
14 2 1200 160 14.0 10
5 1 900 160 14.0 10
13 2 900 160 14.0 9
8 1 1200 200 14.0 13
1 1 900 160 7.0 9
11 2 900 200 7.0 15
4 1 1200 200 7.0 13
2 1 1200 160 7.0 10
6 1 1200 160 14.0 10
10 2 1200 160 7.0 8
15 2 900 200 14.0 11
7 1 900 200 14.0 12
9 2 900 160 7.0 8
16 2 1200 200 14.0 13
RCC: residual carbon content.
Table 2. Carbon, hydrogen and nitrogen total contents in medicine samples determined by elemental analyzer before MW-AD treatment
Medicine sample C / % H / % N / %
Disodium edetate 32.3 ± 0.1 5.1 ± 0.1 7.7 ± 0.02
Acyclovir-APIa 38.3 ± 0.2 5.1 ± 0.5 29.7 ± 0.1
Non-ionic emulsifying wax 72.0 ± 0.9 4.6 ± 0.5 4.9 ± 0.08
Methylparaben 65.5 ± 0.1 5.2 ± 0.1 0.6 ± 0.04
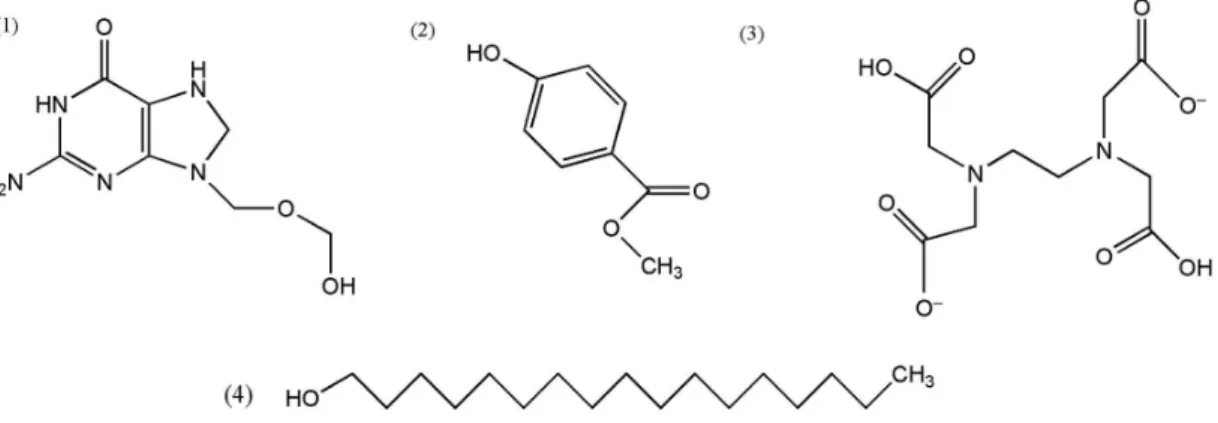
compounds. As reported by Würfels et al.,25 certain groups of substances, such as long-chain alcohols, carbohydrates and long-chain fatty acids, are nearly completely decomposed by nitric acid under pressure.
Although not specified by the manufacturer, the composition of non-ionic wax is likely based on a long-chain alcohol (ethoxylatedstearyl alcohol), as previously reported26 as a non-ionic surfactant used as emulsifier wax. The high total carbon content found in a non-ionic wax, about 72%, indicates the presence of the high carbon quantities, in agreement with the Attwood and Florence26 studies, as observed in Figure 2. However, the lowest RCC value obtained for this sample (Table 4) shows the effectiveness of the sample treatment employed, promoting the suitable reaction medium to decompose these medicine compounds that present complex chemical structures, as observed in Figure 2.
Further, organic compounds, which contain aromatic rings in their structures, can exhibit increased resistances to oxidation promoted by HNO3. It is interesting to observe that the substituent group may facilitate the
electrophilic attack by nitric acid, as suggested by Attwood and Florence26 and Muller et al.27 Condensed aromatic structures are even more resistant to oxidation via concentrated HNO3, such as observed in acyclovir-API sample, which contains condensed heterocyclic aromatic rings, as observed in Figure 2 (1), presenting highest RCC percentage value. It is interesting to mention that the strong activating substituents, such as –OH groups, facilitate the oxidation of aromatic rings, which can explain the RCC value observed for methylparaben be lower than the RCC value obtained for the acyclovir sample. Finally, disodium
edetate (EDTA disodium), (Figure 2, compound 3)
presented the lower RCC value when compared with methylparaben and acyclovir-API. Although the exact mechanism of EDTA degradation in concentrated nitric acid assisted by microwave radiation is not clear, the EDTA molecule becomes unstable in the presence of strong oxidizing agents, such as HNO3, as suggested by Seliverstov et al.28 The residual carbon content values can be observed in Table 4.
To determine the contents of As, Cr, Cu, Ni, Pb, and V elements present in acyclovir and its constituents, an external analytical calibration curve was built up in the range from 0.1 up to 15 µg L-1. Taking into account well-known ICP-MS interferences, two modes of inorganic
Figure 1. Pareto plot obtained from full factorial design (23).
Figure 2. Structures of the medicinal samples used to evaluate the digestion efficiency and possible interferences caused by residual carbon: (1) acyclovir; (2) methylparaben; (3) disodium edetate; (4) non-ionic emulsifying wax.
Table 4. Residual carbon contents of treated acyclovir ointment and raw materials by optimized sample treatment and quantification by ICP OES
Sample Residual carbon content (RCC)
Acyclovir-ointment 8.0 ± 0.6
Acyclovir-APIa 6.0 ± 0.6
Methylparaben 4.4 ± 0.3
Disodiumedetate 3.9 ± 0.3
Non-ionicemulsifying wax 3.3 ± 0.5
element determination were applied, the standard and KED mode. However, in the present work was presented only the isotope and operation mode that provided satisfactory result.
To check the accuracy of the proposed method, isotopes of As, Cr, Cu, Ni, Pb and V were determined in spiked acyclovir ointment samples, before and after microwave-assisted digestion and these constituents were determined by ICP-MS in the standard and KED mode. The USP chapter 2336 defines as acceptance criteria for recoveries, values from 70 to 150% obtained from samples replicates.
The concentration values found for inorganic elements in spiked medicine samples can be seen in Table 5.
These isotopes were accurately quantified using the standard mode, except for 51V+, which required the use of KED technology. As seen, the majority of these results were obtained by standard mode; however, chromium recovery was only satisfactorily obtained for the highest concentration level added (10 µg L-1) before and after sample treatment. In fact, the KED mode was applied for the 52Cr+ determination, in order to reduce possible spectral interferences, however, the KED mode was not effective at improving this poor 52Cr+ recovery in lower concentration value (2.5 µg L-1), indicating that it is not due to spectral interferences. Maybe it constitutes a problem before determination, specifically in the sample treatment. In general, recoveries were not improved when KED mode was employed; indeed, in some cases the recovery values decreased, as in the case of 52Cr+ or 75As+, which can be explained by the fact that helium gas defocuses the ion beams, due to many collisions which compromises the sensitivity and may also compromise the accuracy
of the method.15,29 According to Cotta and Enzweiler,29 the introduction of a mixture of gases containing H2 and He minimize some interferences encountered in the quantification of trace elements in water, however, the analytes net signal were severely affected. Severe polyatomic interferences, in this case, 35Cl16O+ at 51 m/z ratio, likely reduces the accuracy of ICP-MS measurements for 51V+ in standard mode, therefore, only for vanadium was possible to verify the correction of the spectral interferences using KED and He gas, leading to the accurate results. These observations may be explained by the signal overlap from polyatomic species formed in the plasma. In fact, chromium and vanadium isotopes, 52Cr+ and 51V+, suffer severe interferences caused by argon-containing species such as 40Ar12C+, 36Ar15N1H+, 36Ar16O+ and 36Ar15N+, 38Ar13C+, and 36Ar14N1H+, respectively.
Table 6 shows the results obtained for the real medicine samples. It is noticed that higher concentrations of inorganic constituents were found in some raw samples compared to the final product, and in some samples, the concentrations of inorganic constituents analyzed do not even correspond to the respective final product. The variations of the manufacturing process can produce acyclovir ointment (final product) where the raw materials sometimes contain higher concentrations of some inorganic elements than the final products.
The USP 2325 establishes daily concentration limits (µg g-1) for drug substances and excipients, with a maximum daily element dose of ≤ 10 g per day, based on a 50 kg person. In the case of oral drug products and parental drug products, the limits of inorganic elements: As, Pb, V, Ni and Cu are 0.15, 0.5, 10, 50, 100 µg g-1 and 0.15, 0.5, 1, 5,
Table 5. Concentration and recovery values for spiked acyclovir samples quantified by ICP-MS (mean ± standard deviation, n = 3)
Sample Operation mode Isotope Before MW-AD
a After MW-ADa
Concentration / (µg L-1) Recovery / % Concentration / (µg L-1) Recovery / %
Spiked acyclovir (2.5 µg L-1)
KEDb 51V+ 2.50 ± 0.06 100 2.7 ± 0.2 110
standard 52Cr+ 1.5 ± 0.4 59.6 2.1 ± 0.4 85.6
standard 58Ni+ 2.4 ± 0.6 95.1 2.20 ± 0.04 87.3
standard 65Cu+ 2.6 ± 0.1 105 3.0 ± 0.3 121
standard 75As+ 2.6 ± 0.1 104 2.80 ± 0.03 112
standard 208Pb+ 3.1 ± 0.5 126 2.80 ± 0.08 112
Spiked acyclovir (10 µg L-1)
KEDb 51V+ 12.4 ± 0.1 125 13.2 ± 0.3 132
standard 52Cr+ 10.8 ± 0.6 108 9.5 ± 0.6 95.1
standard 60Ni+ 10.1 ± 0.07 101 10.2 ± 0.3 102
standard 65Cu+ 10.7 ± 0.2 108 9.2 ± 0.4 92.6
standard 75As+ 10.5 ± 0.1 106 11.2 ± 0.3 112
standard 208Pb+ 9.8 ± 0.1 98.7 10.5 ± 0.1 105
10 µg g-1, respectively.5 No information regarding safety concerns related to chromium was found.
Limits of detection (LOD) calculated from IUPAC recommendations, LOD (ng L-1) for 51V+, 52Cr+, 58Ni+, 65Cu+, 75As+ and 208Pb+ in 1% v/v HNO3 medium were: 2.2,
81.3, 91.9, 6.9, 0.2 and 3.1, respectively. It is important to emphasize that the LOD’s obtained by proposed method is in agreement to those required by the U.S. Pharmacopeia Convention (USP).5
The chromium content can be a contamination problem during the manufacturing process of the medicine samples, due to the pharmaceutical companies employing machinery manufactured in stainless steel, which contains in its composition of 13-30% chromium. The chromium contamination in processed foods can be extended to the pharmaceutical products. However, the chromium contamination in these samples studied will be evaluated taking into account the polyatomic interferences in ICP-MS and possible contamination from machinery.30
Possible contaminations, besides the environmental ones, may arise from catalysts, reagents, machines or equipment. In addition, drug manufacturers are susceptible to changes in the suppliers of excipients, raw materials and active ingredients, all of which are sources of possible contamination by metals introduced into the manufacturing process of medicament. However, the metal impurities in medicine samples are not well known and, at this point, those from minerals and plants have caused major concerns. Thus, the present study is important to realizing the real compositions of these medicine samples as well as helping to clarify which inorganic elements can be found in these samples.
Conclusions
Inorganic analysis of medicine samples is vital for elucidating the real compositions of these matrices. Knowledge of the inorganic compositions of these samples
is necessary in order to detect and monitor the inorganic contaminants that may be present. The ICP-MS has been shown to be suitable for the determination of inorganic constituents in pharmaceutical products. In the sample treatment step, the chemical conditions employed were very efficient to obtain the digested samples with reduced RCC, enabling to quantify the analytes more accurately. The kinetic energy discrimination (KED) was more suitable for 51V+ determination in order to overcome spectral interferences, while the standard mode was applied for the remaining isotopes. The present work carefully reports the inorganic composition of acyclovir ointment, enabling the knowledge of the inorganic profile of these samples. The sample treatment proposed was very suitable and in agreement with the ICP-MS technique provides the simultaneous inorganic determination in these complex matrix.
Acknowledgments
The authors are grateful of São Paulo Research Foundation (FAPESP) Process 2015/08873-9, Fundação de Apoio à Pesquisa e Extensão de São José do Rio Preto (FAPERP) for research grant 74/2015, and Coordenação de Aperfeiçoamento de Pessoal de Nível Superior (CAPES-15/2104) for fellowship provided to C. D. B. A. and financial support.
References
1. http://brazilianpharmasolutions.com.br/?noticias=mercado-farmaceutico-cresce-mas-ainda-nao-e-competitivo-no-exterior, accessed in May 2016.
2. Pinto, A. C.; Barreiro, E.; Quim. Nova 2013, 36, 1557. 3. https://www.pwc.com.br/pt/publicacoes/setores-atividade/
assets/saude/pharma-13e.pdf, accessed in May 2016. 4. International Conference on Harmonisation of Technical
Requirements for Registration of Pharmaceuticals for Human
Table 6. Determination of As, Cu, Cr, Ni, Pb and V (µg kg-1, mean ± standard deviation, n = 3) in acyclovir and its constituents by ICP-MS operated in
standard and KED modes
Standard mode / (µg kg-1) KED / (µg kg-1)
75As+ 65Cu+ 52Cr+ 58Ni+ 208Pb+ 51V+
Disodiumedetate 2.3 ± 0.8 181 ± 40 1535 ± 25 155 ± 3.6 8.6 ± 2.3 102.6 ± 3.5
Acyclovir-API 285 ± 51 185 ± 17.1 3446 ± 47 442 ± 42 81.9 ± 14 61.0 ± 2.4
Acyclovir ointment 15.7 ± 6.9 166 ± 4.4 1554 ± 98 413 ± 39 25.4 ± 2.6 57.0 ± 3.0
Non-ionicemulsifying wax 11.9 ± 1.8 133 ± 0.5 1362 ± 175 382 ± 11.1 20.1 ± 5.1 63.3 ± 1.82
Methylparaben 8.4 ± 0.9 74.4 ± 8.0 1062 ± 183 220 ± 69 10.9 ± 5.9 56.2 ± 3.0
Use (ICH); Guideline For Elemental Impurities Q3D; ICH: London, 2013.
5. The United States Pharmacopeia, USP 233, Elemental Impurities-Limits, The United States Pharmacopeial Convention, Rockville, 2013.
6. The United States Pharmacopeia, USP 233, Elemental Impurities-Procedures,The United States Pharmacopeial Convention: Rockville, 2013.
7. Rao, R. N.; Talluri, N. V. N. K.; J. Pharm. Biomed. Anal. 2007,
43, 1.
8. Agência de Vigilânica Sanitária (ANVISA); Resolução No. 899/2003, Guia de Validação de Métodos Analíticos e Bionalíticos, de 29 de Maio de 2003, publicação no Diário Oficial da União de 02 de Junho de 2003.
9. Gaba, M.; Dhingra, N.; Ind. J. Pharm. Edu. Res. 2011, 45,175. 10. Solanki, H. K.; Prajapati, V. D.; Jani, G. K.; Indian J. Pharm.
Educ. Res. 2010, 2, 1754.
11. Barin, J. S.; Tischer, B; Picoloto, R. S.; Antes, F. G.; Silva, F. E. B.; Paula, F. R.; Flores, E. M. M.; J. Anal. At. Spectrom.
2014, 29, 352.
12. Montaser, A.; Golightly, D. W.; Inductively Coupled Plasmas in Analytical Atomic Spectrometry; Wiley-VCH: New York, USA, 1998.
13. Cassap, M.; Spectroscopy 2011, 26. Available at http://www. spectroscopyonline.com/using-icp-ms-and-icp-oes-measure- trace-elemental-impurities-pharmaceuticals-compliance-proposed-phar, accessed on May 2016.
14. Evans, E. H.; Giglio, J. J.; J. Anal. At. Spectrom. 1993, 8, 1. 15. Pereira, C. D.; Garcia, E. E.; Silva, F. V.; Nogueira, A. R. A.;
Nóbrega, J. A.; J. Anal. At. Spectrom. 2010, 25, 1763. 16. Bluemlein, K.; Raab, A.; Feldman, J.; Anal. Bioanal. Chem.
2009, 393, 357.
17. Colon, M.; Hidalgo, M.; Iglesias, M.; J. Anal. At. Spectrom.
2009, 24, 518.
18. Wolf, S. A.; Morman, S. A.; Hageman, P. L.; Hoefen, T. M.; Plumlee, G. S.; Anal. Bioanal. Chem. 2011, 401, 2733. 19. Yamada, N.; Spectrochim. Acta, Part B 2015, 110, 31. 20. http://www.drugs.com/acyclovir.html, accessed in May 2016. 21. Souza, G. B.; Menezes, E. A.; Gonzalez, M. H.; Carapelli, R.;
Chaves, F. S.; Matos, W. O.; Nogueira, A. R. A.; Anal. Lett.
2008, 41, 1633.
22. Gouveia, S. T.; Silva, F. V.; Costa, L. M.; Nogueira, A. R. A.; Nóbrega, J. A.; Anal. Chim. Acta 2001, 445,269.
23. http://goldbook.iupac.org/PDF/goldbook.pdf, accessed in May 2016.
24. Gonzalez, M. H.; Menezes, E. A.; Matos, W. O.; Bianchi, S. R.; Nogueira, A. R. A.; Nóbrega, J. A. In Microwaves: Theoretical Aspects and Practical Applications in Chemistry; Marchetti, A., ed.; Transworld Research Network: Kerala, 2011, p. 249. 25. Würfels, M.; Jackwerth, E.; Stoeppler, M.; Anal. Chim. Acta
1989, 226, 1.
26. Florence, A. T.; Attwood, D.; Physicochemical Principles of Pharmacy, 4th ed.; Pharmaceutical Press: Cornwall, 2006.
27. Muller, A. L. H.; Oliveira, J. S. S.; Mello, P. A.; Muller, E. I.; Flores, E. M. M.; Talanta 2015, 136, 161.
28. Seliverstov, A. F.; Ershov, B. G.; Yu, O.; Lagunova; P. A.; Morozov, A. S.; Kamrukov; Shashkovskii, S. G.;
Radiochemistry 2008, 50, 70.
29. Cotta, A. J. B.; Enzweiler, J. J.; J. Anal. At. Spectrom. 2009, 24, 1406.
30. Bratakos, M. S.; Lazos, E. S.; Bratakos, S. M.; Sci. Total Environ. 2002,290, 47.
Submitted: February 12, 2016
Published online: May 12, 2016