The Jitter Spatial Frequency Sweep VEP: A new paradigm
to study spatiotemporal development of pattern- and
motion-processing mechanisms in human infants
Russell D. Hamer
1,2and Anthony M. Norcia
11 Smith-Kettlewell Eye Research Institute, USA
2 Universidade de São Paulo, Brazil
Abstract
We introduce a new VEP paradigm - the Jitter Spatial Frequency (JSF) Sweep VEP - that permits eficient mapping of the spatiotemporal tuning of the developmental motion asymmetry (DMA). Vertical sinewave gratings undergoing 90o horizontal oscillatory displacements (6 or 10 Hz) were presented while their SF was swept over 2 to 5 octaves during each VEP trial. JSF sweep VEPs were recorded from 28 infants (8-43 weeks), and symmetric (second-harmonic, F2) and asymmetric (F1) components of the VEP were measured. JSF sweeps can provide four useful estimates: (1,2) the high-SF cutoff of F1 and F2 responses estimates the spatial resolution of direction-selective (DS) and non-DS mechanisms, respectively; (3) the low-SF cutoff for F1 estimate the SF-boundary between mature (F1 absent) and immature (F1 present) DS mechanisms; and (4) the F1 high-SF cutoff estimates the lower velocity limit of cortical DS cells. For 6 Hz, the low-SF F1 cutoffs increased two times faster than traditional (contrast-reversal) VEP grating acuity (0.5 vs ~0.25 octaves/month), and twice that of the high-SF F1 and F2 cutoffs. This implies that no single mechanism can account for the DMA at both low and high SFs. At 10 Hz, the DMA exhibited no signiicant development, consistent with slower maturation of DS mechanisms at higher ST frequencies. The F2 high-SF cutoffs were higher than F1 at both 6 and 10 Hz, suggesting higher spatial resolution for non-DS (pattern) vs DS (motion) mechanisms. Finally, the lower velocity limit of the DS mechanisms decreased from ~2 deg/sec at 8 weeks, to 0.75 deg/sec at 33 weeks, similar to analogous limits for direction-of-motion identiication in adults (~0.5 - 1 deg/sec), and close to prior VEP estimates in infants (0.6 deg/sec). Keywords: developmental motion asymmetry, visual evoked potential, jitter spatial frequency sweep, directional selectivity, pattern mechanisms, motion mechanisms, velocity limit.
Received 14 December 2009; received in revised form 28 December 2009; accepted 28 December 2009. Available online 29 December 2009
Russell D. Hamer, Smith-Kettlewell Eye Research Institute, San Francisco, CA, USA and Instituto de Psicologia, Universidade de São Paulo. Anthony M. Norcia, Smith-Kettlewell Eye Research Institute, San Francisco, CA, USA. Correspondence regarding this article should be directed to: Russell D. Hamer, Instituto de Psicologia, Universidade de São Paulo, Av. Prof. Mello Moraes, 1721, Cidade Universitaria, São Paulo 05508-900, SP, Brasil. E-mail: [email protected] or [email protected]
Introduction
Developmental studies of motion processing and directional selectivity are of interest for several reasons. First, since directional selectivity is established in primate irst at the level of the visual cortex, directionally selective responses are indices of cortically derived activity. Secondly, we are interested in the relationship between motion and pattern processing during development, since there is a substantial amount of data indicating that, under some conditions, adult motion and pattern processing may utilize distinct neural substrates (e.g., Murray, MacCana, & Kulikowski, 1983; also see Merigan & Maunsell, 1993;
“sustained” visual mechanisms (e.g., Anderson & Burr, 1985; Harwerth, Boltz, & Smith, 1980; Keesey, 1972; Kulikowski & Tolhurst, 1973; Tolhurst, 1973), and are related to the spatiotemporal domains of magnocellular and parvocellular geniculocortical pathways (e.g., Maunsell & Gibson, 1992; Yeh et al., 1995; see reviews by Merigan & Maunsell, 1993, Skottun & Skoyles, 2007a, 2007b, 2008a, 2008b). Thus, mapping of the spatiotemporal development of motion-sensitive and non-motion sensitive mechanisms may help identify the immature counterparts to these mechanisms and elucidate their maturational sequence.
The developmental motion asymmetry (DMA): a window into basic visual mechanisms
The study of developing motion-processing mechanisms can provide unique access to motion mechanisms that are dificult to isolate in the adult visual system. This window into motion mechanisms derives from striking asymmetries that are present in normal infant motion responses and oculomotor behavior, which do not occur in normal adults.
Both human and monkey infants exhibit highly asymmetric monocular optokinetic nystagmus (MOKN), with robust response to nasalward but not temporalward moving targets (Atkinson, 1979; Atkinson & Braddick, 1981; Brown, Norcia, Hamer, Wilson, & Boothe, 1993; Lewis, Maurer, & van Schaik, 1990; Naegele & Held, 1982; Wattam-Bell, 1987; Mohn, 1989;). An analogous asymmetry occurs in the cortically-derived motion VEP responses of normal infants (Birch, Fawcett, & Stager, 2000; Bosworth & Birch, 2007; Brosnahan, Norcia, Schor, & Taylor, 1998; Fawcett & Birch, 2000; Gerth et al., 2008; Hamer & Norcia, 1994; Jampolsky, Norcia, & Hamer, 1994; Mason, Braddick, Wattam-Bell, & Atkinson, 2001; Norcia, 1996; Norcia et al., 1991; Norcia, Hamer, Jampolsky, & Orel-Bixler, 1995). recorded monocular motion VEPs (MVEPs) in response to sinusoidal gratings undergoing oscillatory motion. They found that the steady-state responses in normal infants are dominated by asymmetric components (irst harmonic response or F1), in contrast to normal adults in whom the symmetric component (second harmonic response or F2) is dominant. The phase of the asymmetric component in one eye was 180 degrees out of phase from the F1 responses from the other eye, implying that the monocular responses were associated with opposite directions of motion for the two eyes. This pattern of response is strong evidence for a nasalward-temporalward bias in the responses of a population of directionally selective cortical cells, and has been termed the developmental motion asymmetry (DMA; Hamer & Norcia, 1994; Jampolsky et al., 1994). Birch, Fawcett and Stager (2000) reported that the DMA for 6 Hz, 1 c/deg gratings is not present before about eight weeks, suggesting that cortical directional selectivity undergoes a period of post-natal development.
“Direction-labeled” responses in infant visual evoked potentials: the DMA as an electrophysiological analogy to the “identiication near threshold” psychophysical paradigm
Graham (1989) has identiied ive basic psychophysical paradigms useful in analyses of sensory systems. One of these, the “identiication near threshold” paradigm, is aimed at establishing the presence (or lack) of multiple analyzers along a dimension of interest (displacement of a grating pattern, in this case), and some indication of their relative sensitivity.
The DMA may be seen as an electrophysiological analog for the identiication of motion direction, insofar as the F1 responses derive from the activity of direction-biased cortical cells. The responses themselves imply that the pattern (grating) was “detected” by the cells and - because of the phase relationship between the two eyes - that this detection was directionally selective. The directional bias causing the odd-harmonic VEP components serves as the signature of the cells’ “direction identiication”.
The DMA is also analogous to Watson & Robson’s (1981) “labeled detectors in human vision”. The presence of direction-labeled detectors in the adult human vision has been demonstrated psychophysically in motion direction discrimination experiments at contrast threshold (e.g. Anderson & Burr, 1991; Watson et al., 1980; Watson & Robson, 1981), as well as in experiments involving subthreshold summation (Levinson & Sekuler, 1975; Watson et al., 1980). In addition, strong evidence for direction selective mechanisms in adult human vision comes from direction-speciic adaptation of psychophysical threshold and suprathreshold motion after-effects (e.g., Levinson & Sekuler, 1973; Pantle, 1970; Pantle, 1974; Pantle & Sekuler, 1969; Sekuler & Ganz, 1963; Stromeyer, Madsen, & Klein, 1979), as well as from analogous motion-adaptation of the VEP (e.g., Ales & Norcia, 2009; Chandna, Norcia, & Peterzell, 1993; Clarke, 1974). Such motion detectors are thought to subserve adult contrast thresholds over much of the visible spatiotemporal range (Adelson & Bergen, 1985; Anderson & Burr, 1991; Watson et al., 1980; Watson & Ahumada, 1985; Wilson, 1985).
The key for the psychophysical identiication of a direction-labeled detector is that the labeling persists down to the detection threshold (Watson & Robson, 1981). Previously, we showed that the DMA (including the 180-deg LE-RE phase relationship) is present in infants down to their displacement threshold when the amplitude of the oscillatory displacement is swept (Hamer & Norcia, 1994). In the present article, we present evidence that the DMA is indeed present at or near contrast threshold, at both low spatial frequencies and at the acuity cutoff for age.
A new paradigm for mapping the spatiotemporal development of the DMA
and children, as well as in infants and children with visual disorders. To date, the spatiotemporal tuning of the DMA has not been examined in suficient detail. The existing data have been obtained using ixed spatiotemporal (ST) frequencies to elicit the VEP, and these indicate that the binocular motion subsystem underlying the DMA matures (symmetricizes) earlier for low spatiotemporal frequencies (e.g., Norcia, 2004; Norcia, Hamer, & Orel-Bixler, 1990a). A natural approach to more eficient mapping of the spatiotemporal domain of the DMA would be to take advantage of the swept-parameter VEP, as used extensively to study grating acuity, contrast sensitivity, motion responses, and vernier responses in infants and adults (Almoqbel, Leat, & Irving, 2008; Chen et al., 2005; Hamer et al., 1989; Hamer & Norcia, 1994; Hou et al., 2007; Norcia et al., 1989, 1999; Norcia et al., 1990b; Norcia & Tyler, 1985; Oliveira et al., 2004; Salomão, Ejzenbaum, Berezovsky, Sacai, & Pereira, 2008; Skoczenski & Norcia, 1999; Tyler, Apkarian, Levi, & Nakayama, 1979). The present study introduces a stimulus paradigm in which, for a given temporal frequency, a grating undergoing 90-deg oscillatory displacements is swept in SF. We have termed this the Jitter Spatial Frequency (JSF) Sweep VEP Paradigm.
The F1 component of the VEP in response to a JSF sweep can provide information relevant to more than one aspect of maturation of directionally selective cortical mechanisms. Based on prior work concerning the DMA (Birch et al., 2000; Hamer & Norcia, 1994; Jampolsky et al., 1994; Norcia, 2004; Norcia et al., 1990a, 1991, 1995), we can anticipate several response patterns for the JSF sweep VEP depending on age and the ST parameters of the stimulus. For example, for an appropriate choice of spatiotemporal parameters, the monocular F1 response of a normal infant should have a bandpass form, with the low-SF cutoff of the response representing the spatial boundary between mature (symmetrical, low-SF) responses, and immature (asymmetrical, higher-SF) responses. For younger infants, the response form should be low-pass, since DMA still persists for low spatiotemporal frequencies. Examples of these response forms are illustrated schematically in Figure 1 and with data obtained from individual infants in Figures 2 and 3 in the Results section.
Throughout the maturational sequence of asymmetrical to symmetrical motion responses, we can measure a high-SF spatial cutoff of the F1 response. This cutoff provides an estimate of the spatial resolution limit of DS cells underlying the DMA, and also an estimate of the lower velocity limit of these cells.
Finally, under some conditions (discussed in detail in the Discussion section), the high-SF cutoff of the symmetric response component (F2) can provide a simultaneous, quasi-independent estimate of the spatial
resolution of non-DS cortical mechanisms. Thus, the paradigm can potentially assay simultaneously the spatiotemporal domain of motion- and pattern-sensitive mechanisms over the course of development.
The DMA as a monocular index of binocularity
The monocular asymmetries described above appear to be immature components of what becomes a binocular motion subsystem in visual maturity. Early interruption of binocularity is associated with nasalward/temporalward biases in monocular motion VEP that persist into adulthood (Birch et al., 2000; Bosworth & Birch, 2007; Hamer, Norcia, Orel-Bixler, & Hoyt, 1993; Jampolsky et al., 1994; Norcia et al., 1991, 1995; Tychsen, Hertig, & Scott, 2004). In addition, there is indirect evidence from adults that the monocular VEP asymmetry measured in normal infants relects activity of a binocular motion subsystem. In normal adults, asymmetrical MVEPs (signiicant F1 response components) can be induced in one eye by motion-adaptation of the other eye (interocular transfer of an adaptation-induced asymmetry; Chandna et al., 1993). Thus, spatiotemporal mapping of the DMA has both clinical relevance and relevance to basic theoretical mechanisms of motion-processing and binocularity.
To anticipate our results, in infants as well as in adults the highest spatial frequency (pattern-sensitive) channels are not direction selective. Moreover, multiple DS and non-DS (pattern-sensitive) mechanisms appear to follow distinct developmental time courses, and these can be monitored quasi-independently by the spatial cutoffs of the even and odd harmonic response components of the sweep VEP. Finally, our estimate of the lower velocity limit for cortical DS cells in infants (~0.7 deg/sec) is similar to the estimate for psychophysical direction-of-motion identiication in adults (~0.5 - 1 deg/sec; reviewed in Graham, 1989).
Methods
Participants
Infants (N = 28) were recruited from parent education classes at a local hospital. All infants were healthy and were born within two weeks of expected term. The infants were from 8 to 43 weeks postnatal age (mean age for all 28 infants was 21.8 weeks; for the 13 infants tested at 6 Hz, it was 17.8 weeks; for the 15 infants tested at 10 Hz, the mean age was 25.2 weeks). Recordings were made after informed consent was obtained from the parent(s). All procedures used conformed to the terms of the Declaration of Helsinki. All testing was completed in one or two one-hour sessions within a one-week period.
Apparatus - Stimuli generation
presented at 640X480 resolution at a frame rate of 66.7 Hz. The mean luminance was 160 cd/m2. Gamma-correction was implemented using a look-up table and the gratings were presented at a Michelson contrast of 80%. Screen size was 22.5 X 30 cm, yielding ield sizes of 12.8 X 17 deg at 100 cm.
VEP data acquisition and response analysis
The EEG was recorded from 5 derivations (Cz vs O1, Cz vs Oz, Cz vs O2, Oz vs O1, and Oz vs O2) over an ampliier passband of 1-100 Hz (-6 dB) using Grass gold-cup electrodes. The EEG was digitized with a 16-bit analog-to-digital converter (Spectral Innovations SIAD8-C) connected to a Spectral Innovations MacDSP digital signal processor card placed in the host computer. EEG data acquisition was synchronized to the video display by using the vertical and horizontal synchronization signals from the NuVista+ as timing signals for the data acquisition sub-system. Separate C-language programs ran independently on the 32-bit processors associated with the NuVista+ video generator and the digital signal processor.
The sampled data was adaptively iltered in real-time on the MacDSP card using the method described in Tang & Norcia (1995). A Recursive Least Squares (RLS) adaptation algorithm was used in a modiication of the Adaptive Noise Cancellation technique of Widrow et al. (1975). Sine and cosine ilter weights were updated using the RLS algorithm on each new data sample. Amplitude and phase values for stimulus-related frequencies [the irst (F1) and second (F2) harmonics of the stimulus frequency in the present analyses] were calculated from these weights, as were the amplitudes at frequencies with ±1 Hz from the signal frequency. The latter provided an estimate of local noise near the response frequency for calculation of signal-to-noise ratio (SNR).
Procedure
Infants were seated comfortably on their parent’s lap. For infants under 2 months of age, viewing distance was 70 cm. For all other infants, the viewing distance was 100 cm. All viewing was monocular, and the initial eye to be tested was chosen randomly.
Trials were initiated by the experimenter when the corneal relection of the video monitor was centered in the infant’s pupil. The infants’ ixation was elicited by dangling small, noisy toys in front of the video monitor. Trials were interrupted when the infant lost ixation or made large movements. If the trial was interrupted, the sweep was automatically reset to the previous value and the stimulus was held at that value until the experimenter resumed the data collection. At the beginning of each trial, the stimulus was displayed with the initial sweep parameters for at least 1 sec prior to the beginning of data collection. This approach avoids collection of VEP data that may include large transients in the evoked response that might occur after large changes in the
stimulus. Prior to the initiation of the trial, the RLS ilter was continually adapting to the prevailing EEG.
Throughout each 10-sec VEP trial, the gratings underwent horizontal oscillatory displacements (± 45o spatial phase) at either ~6 Hz (5.5 or 6 Hz) or ~10 Hz (10 or 11 Hz) while their spatial frequency was swept over two to ive octaves in 10 equal logarithmic steps. VEP was collected for each of the 10 spatial frequency bins comprising each trial. A minimum of three 10-sec trials were run for each condition, and a vector average of all responses at each analysis harmonic was calculated.
In each session, we attempted to complete the full test protocol (6 and 10 Hz sweeps from each eye, with at least 3 trials in each condition). For the analyses of the group data (Figures 5, 6), results from one recording channel were used for each infant. This was the channel in which at least one of the monocular responses contained a statistically reliable response in the F1 component, usually the channel with the highest peak signal-to-noise ratio. For presentation of illustrative examples of individual data, the order of eye testing was random, and channels for comparison were chosen according to the criteria above.
The choice of ~6 and ~10 Hz was guided by prior work, with ixed ST parameters, that indicated that development takes longer at 10 Hz than at 6 Hz (e.g., Norcia et al., 1990a; Norcia, 2004). Thus, both spatial and temporal frequency must be varied to completely characterize the developmental status of the underlying motion process at any given age. These two frequencies generate robust responses in infants and are suficiently different to have distinguishable developmental time courses, especially when tested with different spatial frequencies.
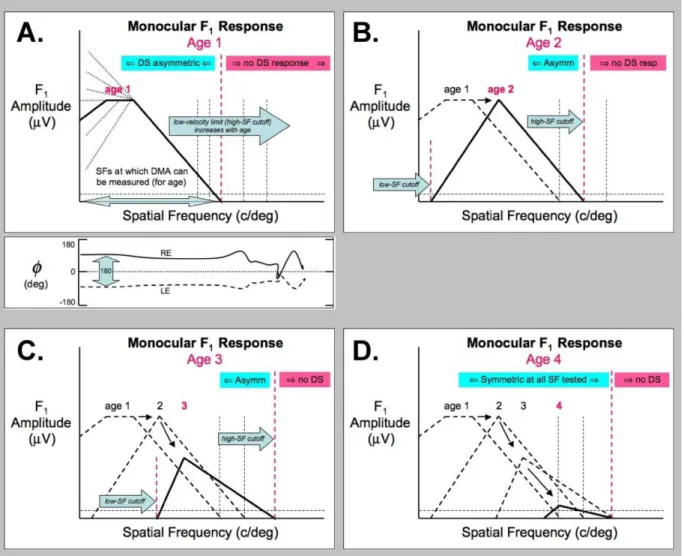
Figure 1. Schematic depiction of the monocular irst-harmonic (F1) response to the JSF Sweep paradigm over the course of
development. Panels A – D illustrate the F1 (asymmetric) response component at four hypothetical ages at one temporal frequency (TF). For the youngest infants (A), the developmental motion asymmetry (DMA) will be present at low SFs. During the JSF sweep, the F1 response will decrease as the SF approaches the spatial cutoff of the DS cortical mechanisms (vertical red dashed line). This cutoff estimates the “motion acuity” of the DS mechanisms, and also the lower velocity limit of these neurons (Velocity limit ≈ TF/SF cutoff). The lower velocity limit is expected to decrease with age, and approach adult levels (red dashed line moves rightward in panels A, B, C, D). Depending on the choice of TF and SF range, the overall response pattern at young ages will be approximately low-pass (A), and will become bandpass at older ages for the same SF range (B, C). During development, the transition to the bandpass form will be accompanied by an overall decrease in F1 amplitude as the DS mechanisms mature and become less asymmetrical (B,C,D). Eventually, the DS mechanisms will be fully symmetrical, and no signiicant F1 response can be recorded (D). The other deining signature of the DMA is the 180-deg relationship between the LE and RE phase responses. It is this phase relationship that shows that the DS mechanisms in the two eyes have a nasalward/temporalward bias. In general, we ind that the 180-deg interocular phase relationship is present throughout the range where the monocular F1 responses are signiicant. The lower sub-panel in A shows the two schematic monocular phase responses (even though the amplitude plot above only depicts the response from one eye, under the assumption that each eye generates an identical amplitude) response.
Results
Monocular F1 Response Patterns In The JSF Sweep VEP Paradigm
Expected developmental changes in directionally selective cortical responses (F1)
Based on prior data relevant to the DMA, we can anticipate some general developmental patterns of monocular F1 responses as a function of S-T frequency. A hypothetical developmental sequence is depicted schematically in Figure 1.
Panel A of Figure 1 depicts a monocular F1 amplitude response from a hypothetical infant at a young age. At this
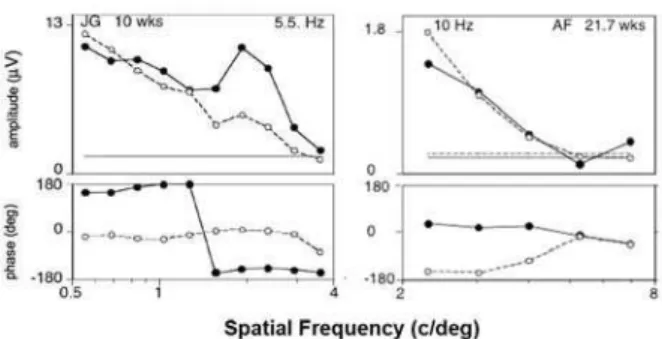
Figure 2. Monocular F1 responses (RE: illed circles; LE:
open circles) from JSF sweeps of two infants. Data from only one recording channel is shown. For infant JG (left panels), tested at 5.5Hz, both eyes have signiicant F1 responses over the entire SF range tested, with an approximate SF cutoff of 4 c/deg. The older infant (AF, 21.7 wks) tested at 10 Hz, has signiicant motion asymmetry out to ~ 6 c/deg, approximately equal to the high-SF cutoff for each eye. For both infants, the F1 responses are in 180 deg phase relationship between the two eyes over the entire SF range out to their respective high-SF cutoffs. For oscillatory grating motion at 5.5 Hz, a 4 c/ deg high-SF cutoff implies a lower velocity limit of ~1.4 deg/s (infant JG). The high-SF cutoff of ~6 c/deg for oscillatory motion at 10 Hz (infant AF) corresponds to a lower velocity limit of ~1.7 deg/sec.
out to the highest SF to which the DS cortical mechanisms can respond (the high-SF cutoff; e.g., see Figure 9 in Hamer & Norcia, 1994). It is the signature of direction-labeled cortical responses having a nasalward/temporalward bias.Panel B in Figure 1 depicts the F1 response for an older subject (solid curve) tested over the same SF range. The F1 response for the younger age is shown as the dashed curve for comparison. At this older age, three signatures of developmental change in the DS cortical mechanisms are expected.
First, the F1 amplitude at low SFs should decrease as DS responses at low S-T frequencies symmetricize, resulting in a
bandpass form. In addition, we expect both the low and high SF cutoffs to shift rightward with development (right-pointing blue arrows). The loss of signiicant F1 response at low SFs permits an estimate of the low SF cutoff, deining the low SF boundary of mature (symmetric) DS responses for the TF and age. The high SF cutoff of the F1 response should shift to higher SFs as the lower velocity limit of the DS cells matures and approaches adult values (vertical dashed lines). The high SF cutoff for the F1 response provides an estimate of this velocity limit, and may also be thought of as an estimate of a “motion acuity” for the DS cortical neurons.
Panels C and D in Figure 1 depict a continuation of the these same developmental changes in low and high SF cutoffs, but also show the F1 amplitude diminishing with the maturation of the DS mechanisms across all SFs tested until the F1 response is no longer recordable (panel D).
Spatial tuning of the DMA: examples of monocular F1 responses from the Jitter Spatial Frequency (JSF) Sweep VEP Paradigm
Figure 2 shows two examples of infants with a robust DMA in each eye at all the low spatial frequencies presented in the JSF sweeps. These data exhibit the low-pass form similar to the pattern depicted schematically in Figure 1A. The left panels show the monocular F1 data of a 10-week-old tested at 5.5 Hz. The right panels show the data of a 22-week-old tested at 10 Hz. For both infants, the RE and LE responses have equal amplitude at all the SFs, and are in ~180-deg phase relationship out to their extrapolated thresholds.
The interpretation of this pattern of results is that these infants’ DS mechanisms were still immature for the S-T frequencies tested, even for the lowest SFs tested. Thus, a pronounced DMA is present (signiicant F1) at the start of the sweep, and diminishes as the SF increases. We can estimate the acuity limit (lower velocity limit) of the infants’ cortical DS mechanisms by extrapolating along the high SF slope to zero microvolts.
For infant JG (10 wks, 5.5Hz), the high SF cutoff was ~4 c/deg, corresponding to a lower velocity limit of ~1.4 deg/s. For infant AF (21.7 wks, 10 Hz), the corresponding limits were ~6 c/deg, or ~1.7 deg/s.
Spatial tuning of the DMA: directional selective responses
One can derive several measures from the F1 component of the response. Figure 3A compares the F1 data from the RE and LE of a 19-week-old infant (CP). Depending on the age of the infant and the developmental state of the DS mechanisms, the F1 responses will tend to have a bandpass form, as in CP’s data (and as illustrated in Figures 1B and C). At low spatial frequencies, the amplitude of the F1 component is relatively low, commensurate with mature (symmetrical) DS mechanisms at these frequencies. At intermediate SFs, F1 amplitude is greater, implying a more robust DMA (less mature response). At higher frequencies, the F1 amplitude decreases again as SF approaches the motion acuity (lower velocity) limit of the DS mechanisms.
In this case, two SF cutoffs may be estimated from each eye by extrapolating to zero microvolts along the low and high spatial frequency lanks of the spatial tuning curve. The arrowheads in Figure 3A mark the extrapolated high and low SF cutoffs for CP’s F1 data.
Note that the RE and LE F1 responses from infant CP are in 180-deg phase relationship up to the highest SF tested (8 c/deg). In addition, although CP’s LE has slightly larger amplitude F1 response than the RE in the mid-SF range, overall the two eyes appear to be in comparable stages of development in terms of motion asymmetry.
boundary of the DMA, identifying the spatiotemporal boundary between mature (symmetric) and immature (asymmetric) direction-selective, binocular responses.
Spatial tuning of symmetric response components
Extrapolation along the high SF limb of the symmetric (F2) component of the VEP yields a second spatial cutoff which we hypothesize to represent the acuity limit of non-DS mechanisms. Figure 3B compares the symmetric (F2, illed squares) and asymmetric (F1, illed triangles) components of the RE data of a 12-week-old infant (EG). For this young infant, the high SF cutoff for the F2 component (6.75 c/deg) is greater than the cutoff for the F1 component (4.2 c/deg). This pattern of results is relected in the group performance also (see Fig. 5).
Since an F2 response is also obtained from the same JSF sweeps, the amplitudes of the F1 and F2 components permit an additional measure of the DMA magnitude. For each bin (or for an average across selected bins), one can calculate an asymmetry index (AI) relating the relative amplitude of the asymmetric (F1) response component to the sum of the F1 and F2 amplitude (Birch et al., 2000; Jampolsky et al., 1994; Norcia et al., 1995). The AI ranges between a maximum of 1.0 (all energy in the F1 component) to 0 (no F1, all F2). The more asymmetric (immature) the response, the larger the AI.
The AI has been shown to provide a useful index of the degree of asymmetry of the motion responses in both normal and abnormal development (Birch et al., 2000; Bosworth & Birch, 2007; Jampolsky et al., 1994; Norcia et al., 1995).
Differential development of DS cortical mechanisms
The results from individual infants also suggest that the JSF Sweep paradigm can reveal the differential development between the two monocular responses in terms of maturation of DS cortical mechanisms. The data shown in Figure 2 illustrates cases where the two eyes of each infant appeared to be at approximately equal stages of maturation (equal amplitude F1 responses in each eye with comparable high SF cutoffs). Each eye had a robust DMA, with equal RE and LE amplitudes at F1 over equal ranges of SF.
By contrast, some infants’ monocular F1 responses suggest that DS mechanisms in each eye’s response are symmetricizing differently depending on the speciic S-T parameters of the stimulus. Two examples are shown in Figure 4.
The F1 data from HL’s RE has a bandpass form over the SF sweep range tested; however, the LE response is low-pass and has a more signiicant F1 response at low SFs than the RE. A low SF cutoff was not measureable from the LE data, but the high SF cutoff for the LE was the same as that for the RE (~5 c/deg). The different pattern obtained from the two eyes at low SFs is consistent with differential rates of maturation of monocular DS mechanisms (DMA) in the two eyes. The similarity of the data at higher SFs suggests similar states of maturation of the DS cells’ lower velocity limit.
MH’s data in Figure 4 present a more extreme example of differential development of the DMA. For the RE, a strong F1 response is present over the whole sweep range, but the LE response is not signiicant at any of the SFs in the sweep. The lack of F1 response in the LE was not due to response recording problems since the LE did generate signiicant F2 in the same sweeps (not shown).
Group Data
Spatiotemporal development of motion & pattern processing
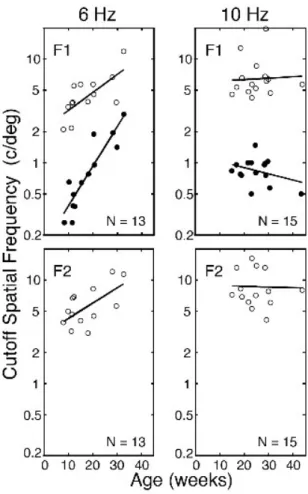
Figure 5 shows the development of all three spatial cutoffs for the group of infants. The data for 6 Hz (n = 13) and 10 Hz (n = 15) are shown separately in the left and right columns of panels, respectively. The two top panels show the high SF (open circles) and low SF (illed circles) cutoffs for the F1 responses. The bottom panels show the high SF cutoffs for F2 measured from the same JSF
sweeps from which the F1 spatial cutoffs were measured. All three cutoffs for 6 Hz indicate signiicant development. The correlations between log-cutoff SF and age are statistically signiicant (p < .005 for F1 data; p < .025 for F2 data). The F1 and F2 high SF cutoffs
Figure 5. Developmental growth curves for the low-SF cutoffs (illed circles) and high-SF cutoffs (open circles) for F1 (upper panels), and for the high-SF cutoffs for F2 (lower panels). Developmental data for 6 Hz and 10 Hz are shown in the left and right columns of panels, respectively, along with corresponding linear regression lines. For the 6 Hz data, correlations are signiicant, with all three regression slopes signiicantly greater than zero (signiicant development). The regression slopes for the high-SF cutoffs are ~1/4 octave/month, nearly identical to the growth rate for conventional (reversal) sweep VEP grating acuity development (Hamer et al., 1989; Norcia, 2004; Norcia & Tyler, 1985). However, the regression slope for the F1 low-SF cutoffs is twice as fast (~1/2 octave/month), and is signiicantly different from the other two regression slopes. For the 10 Hz data, cutoffs did not change signiicantly with age, and the correlations were not signiicant over the age range tested. Over this age range, spatial resolution is likely to be changing less with age (Hamer et al., 1989; Norcia, 2004; Norcia & Tyler, 1985), and maturation of the DMA at 10 Hz is expected to be slower (Norcia et al., 1990a; Norcia, 2004).
increase with age at a rate (F1: 0.23 octaves/month; F2: 0.19 octaves/month) comparable to that found previously for sweep VEP acuity for phase-reversing gratings (F2: 0.25 octaves/month; Norcia, 2004; Norcia & Tyler, 1985). However, the low SF cutoff data for the F1 responses increases at about twice this rate (0.5 octave/month). This slope is signiicantly steeper than the high SF cutoff slopes (p < .02, df = 22, 2-sided test t-test for regression coeficient differences).
The 10 Hz data are relatively independent of age. For the F1 low SF cutoffs, less developmental change is expected, since the DMA persists longer at 10 Hz than at 6 Hz (Norcia et al., 1990a; Norcia, 2004). However, the shallower slope may also relect, in part, the relatively older and restricted age range tested at 10 Hz (15 - 43 weeks, with 13 infants falling between 15 and 31 weeks).
Under the hypothesis that infants’ motion mechanisms have lower acuity than pattern-sensitive mechanisms, and that these are associated with the F1 and F2 response components, respectively, one predicts that the F2 high SF cutoffs will tend to occur at higher SFs than the corresponding F1 cutoffs (as in individual data shown in Figure 2B). This comparison is not readily apparent in Figure 5.
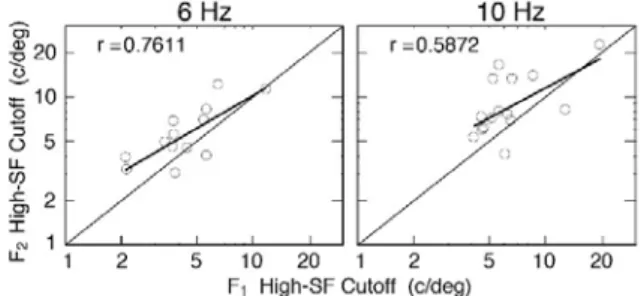
Figure 6 shows a within-subject comparison of the F2 high SF cutoffs plotted against the F1 high SF cutoffs on log-log coordinates.
The left and right panels show, respectively, the data for 6 Hz and 10 Hz. The data show that the two cutoffs are signiicantly correlated (6 Hz: r=0. 761, p<0.005; 10Hz: r = .5872, p < .025, 1-sided tests) - infants who
Note - In this regard it is worth noting that adult, sweep VEP acuities based on extrapolation of F2 amplitude responses are indistinguishable whether measured using conventional phase-reversing gratings or gratings undergoing 90-deg oscillatory motion (Lewin, Chandna & Norcia., 1995). Moreover, adult psychophysical acuities match those estimated via sweep VEP extrapolation of F2 amplitudes (e.g., Allen, Norcia & Tyler, 1986; Norcia, Tyler & Hamer, 1990b).
Figure 6. High-SF cutoffs for F2 responses (ordinate) vs high-SF cutoffs for F1 responses abscissa). 6 Hz data: left panel; 10 Hz data: right panel. The thin solid lines show equality between F2 and F1 cutoffs. The thick lines are linear regression its to the data. The correlations are signiicant, indicating that the two components co-develop to some extent. A paired comparisons t-test showed that for both the 6 Hz and 10 Hz data, the F2 cutoffs are signiicantly higher than the F1 cutoffs. This is commensurate with the hypothesis that the F2 responses relect the spatial cutoff of (symmetric) non-DS, pattern-sensitive cortical cells, and that these have higher inherent resolution limit than the (asymmetric) DS cells underlying the DMA (F1 responses).
have a high spatial cutoff for one component tend to have a high cutoff for the other. This suggests that the neural substrate underlying the two VEP components co-develop to some extent. Figure 6 also shows that at each temporal frequency, the F2 cutoffs occur at signiicantly higher SF than the F1 cutoffs (6 Hz: t = 2.753, df = 12, p < .01; 10Hz: t = 2.8165, df = 14, p < .01, 1-sided paired comparisons t-tests). This result is commensurate with the hypothesis that in normal infants, DS mechanisms have lower spatial resolution than non-DS mechanisms.
Discussion
The developmental motion asymmetry (DMA) in the monocular oscillatory motion VEP derives from the activity of directionally selective (DS) cells in the visual cortex (Hamer & Norcia, 1994; Norcia, 2004; Norcia et al., 1991). The signature of the nasalward/temporalward directional bias in these cortical neurons is a 180-deg phase relationship between the RE and LE monocular F1 responses. As discussed in the Introduction, the DMA may be seen as an electrophysiological analog to the psychophysical identiication of motion direction (Graham, 1989) or direction-labeled detectors (Watson & Robson, 1981).
Asymmetric responses are generally not present in normal adult monocular MVEPs (Norcia, 2004; Norcia et al., 1991, 1995). During the course of normal development, asymmetric response components diminish, approaching the adult state at an age that depends on the spatial and temporal frequencies used (Norcia et al., 1990a; Norcia, 2004). For 6 Hz and 1 c/ deg, for example, it appears that the relative amplitude of the asymmetric response component is close to the adult value by ~20 weeks of age (Birch et al., 2000; Bosworth & Birch, 2007; Norcia et al., 1990a; Norcia, 2004). In
the present study, the signature of direction-labeling - signiicant F1 in the monocular MVEP, with 180-deg LE/ RE phase relationship - was found over a wide range of SFs extending up to near the extrapolated SF cutoff. We know from previous studies that the DMA is undergoing considerable developmental progression at 6 Hz over the irst 8-10 months. It is still measurable over a range of higher spatial frequencies in the oldest infants we tested (Norcia et al., 1990a; Norcia, 2004). Little development was apparent at 10 Hz (Figure 5), although the range of ages tested at this frequency may have been too small to indicate a trend. The relative immaturity at 10 Hz is also consonant with previous evidence indicating that the DMA persists longer at 10 Hz than at 6 Hz (Norcia et al., 1990a; Norcia, 2004).
Spatiotemporal development of motion & pattern processing
The JSF sweep paradigm permits the eficient mapping of the developmental progression of the spatiotemporal domain of the DMA. The paradigm also has the advantage of providing simultaneous, within-subject estimates of resolution acuity for both asymmetric (F1) and symmetric (F2) response components.
The paradigm can thus potentially explore, on a within-subject basis, three important spatial boundaries for a given temporal frequency, as illustrated by the individual data presented in Figures 2-4. The low-frequency cutoff of the F1 response may be seen as marking the lower spatial frequency extent of the DMA. In general, for young infants, this low-frequency cutoff occurs at a spatial frequency far below the infant’s ordinary (reversal) grating resolution acuity.
Ideally, the JSF Sweep VEP approach can provide the most information about the development of both the DS and non-DS mechanisms if the SF range is chosen so that both the F1 low and high SF cutoffs can be estimated, and the F2 high SF can be estimated. Overall, for the 28 infants tested, the dominant spatial tuning function was bandpass.
Differential development of the monocular DS responses
for strabismus, both pre- and post-operatively (Norcia et al., 1995). The JSF Sweep paradigm can provide a more detailed spatiotemporal picture of the DMA during clinical evaluation and management.
In addition, the data shown in Figure 4 (data from infant HL) suggests that the JSF Sweep paradigm may be able to reveal differential development of the DMA as assessed by the F1 response features at low SFs, while the RE and LE high SF responses are similar in amplitude and SF cutoff. Such differences in low and high SF responses at F1 lend further support to the notion that these responses are tapping distinct neural substrates.
Interpretation of the high SF cutoffs from the group data
The data in Figure 5 demonstrate that the symmetric (F2) and asymmetric (F1) response components have signiicantly different high SF cutoffs, with the symmetric component having the higher cutoff. This pattern of results is consistent with the hypothesis that the high SF cutoffs for F2 estimate the spatial resolution of pattern-sensitive, non-directionally selective mechanisms in infants, and that these have a higher spatial resolution than the DS mechanisms generating the F1 responses. This interpretation of the data is based on the following reasoning.
The F1 component of the oscillatory displacement VEP in young infants derives from the activity of cortical direction-selective cells with a strong nasalward/ temporalward population bias (Birch et al., 2000; Norcia, 2004; Hamer et al., 1993; Hamer & Norcia, 1994; Jampolsky et al., 1994; Norcia et al., 1991, 1995;). However, the even harmonic components can derive from three sources. First, the activity of non-directional selective (pattern-sensitive) cells will generate only even harmonic response components. Second, the activity of a cell population with a balance of oppositely tuned direction-selective cells will generate responses indistinguishable from a population of non-DS cells (i.e., only even harmonic components). Finally, a population of direction-selective cells with an imbalance of directional tunings (e.g., even with a complete nasalward/temporalward directional bias) will generate not only a large response at the fundamental frequency (F1), but will also generate all the even harmonic components as well (even a half-wave rectiied sinewave is composed of all the even harmonics, in addition to the F1 component). Hence, the second harmonic response is expected to relect the combined activity of both DS and non-DS cells in some undetermined proportion. The relative contribution of DS and non-DS responses to the overall symmetric VEP components will presumably vary with spatial frequency, possibly non-monotonically, due to the non-monotonic amplitude response observed at F1 (Figure 3). In any case, one would expect that if DS cells’ responses were setting the high SF limit for the F2 responses, they would also do so for the F1 responses. A parsimonious interpretation of the data is that the resolution limit of the DS mechanisms
establishes the high SF cutoff for the F1 responses, and that the “extra” response at higher spatial frequencies (in the F2 component) relects the activity of non-DS cells with inherently higher spatial resolution. Thus, non-DS mechanisms may have higher resolution throughout development and into adulthood, where a substantial body of psychophysical data indicates that they have a higher spatial resolution limit than motion (DS) mechanisms (e.g., Badcock & Derrington, 1985), especially at low temporal frequencies (e.g. Watson et al., 1980).
Relationship between the three SF cutoffs: implications for the co-development of DS and non-DS cortical mechanisms
An important question is the extent to which the spatial development of the DMA is linked to the development of pattern acuity, by which we mean the acuity of non-DS mechanisms. One simple model is that a single, unitary mechanism (e.g., increased photoreceptor packing in the fovea or decreasing cortical receptive ield sizes) governs the spatial development of both the DMA and grating acuity. This would predict that all three spatial cutoffs would follow the same developmental progression.
For the 6 Hz data, the two high SF cutoffs are indeed nearly parallel. However, Figure 5 shows that the low SF cutoffs for F1 increase at twice the rate (0.5 octaves/ month) of either of the two high SF cutoffs, and, also, at twice the rate of ordinary sweep VEP grating acuity (~0.25 octaves/month; Norcia & Tyler, 1985; studies shown in Figure 13.6, Norcia, 2004).
The quicker maturation of the low SF F1 cutoffs implies that the low SF DS mechanisms are maturing (symmetricizing) more rapidly than high SF DS mechanisms. This implies that more than one mechanism must govern the low and high SF F1 cutoffs. The high SF cutoff for F2 presumably represents an additional mechanism distinct from the one that sets the F1 high SF cutoff. The different growth rates for low and high SF cutoffs and the difference between F1 and F2 high SF cutoffs provides independent evidence for the existence of more than one independent spatial channel over the course of development (Banks, Stephen, & Hartmann, 1985; Fiorentini, Pirchio, & Spinelli, 1983; Peterzell, Chang, & Teller, 2000; Peterzell & Kelly, 1997; Peterzell, Werner, & Kaplan, 1993, 1995).
Velocity limits for motion processing in infants
weeks to 8 c/deg at 33 weeks. These cutoffs correspond to a progressive decrease in the lower velocity limit with age, from 2 deg/sec to 0.75 deg/sec. The 10 Hz data, obtained from a somewhat older age range, did not show any signiicant development. The geometric mean high SF F1 cutoff for the group was 6.5 c/deg, corresponding to a lower velocity estimate of 1.53 deg/sec.
These estimates suggest that the direction-labeled detectors underlying the DMA are nearly adult-like by eight months of age for low TFs, and are within a factor of two to three of adult values at higher TFs. A velocity limit estimate of 0.75 deg/sec for older infants tested at 6 Hz is close to that obtained in an earlier study of oscillatory motion thresholds in infants (~1.1 deg/sec, also measured at 6 Hz; Hamer & Norcia, 1994).
We do not know whether the MVEP arises before or after velocity has been encoded. Thus, our estimates provide a lower bound on how good velocity detection could be, based on the capabilities of the DS mechanisms that are available. If velocity is encoded at a second stage, additional immaturities at that stage could set the lower velocity limit.
Behavioral estimates of the lower velocity limit eliciting motion responses in infants cover a broad range (from 1.2 deg/sec to 22.3 deg/sec), depending on the age range tested - 6-8 weeks: 3 deg/sec (Banton & Bertenthal, 1996; Kaufmann, Stucki, & Kaufmann-Hayoz, 1985) to 9 deg/sec (Aslin & Shea, 1990); 12-14 weeks: 2-3 deg/sec (Bertenthal & Bradbury, 1992; Dannemiller & Freedland, 1993) to 22.3 deg/sec (Dobkins & Teller, 1996); 20 weeks: 1.2 deg/sec (Bertenthal & Bradbury, 1992) to 2 deg/sec (Dannemiller & Freedland, 1989).
Relationship between the DMA and binocular vision
One possible explanation for the faster maturation of the DMA at low SFs in the 6 Hz data is that symmetricization of low SF mechanisms is augmented by the onset of binocularity and disparity sensitivity, which is developing rapidly over the irst three to ive months of life (Birch et al., 1985; Fawcett & Birch, 2000; Fox, Aslin, Shea, & Dumais, 1980; Petrig, Julesz, Kropl, Baumgartner, & Anliker, 1981; Shea, Fox, Aslin, & Dumais, 1980). At least three lines of evidence imply that the DMA (and analogous oculomotor asymmetries) represents an immaturity in a binocular
motion-processing subsystem. First, early interruption of binocularity is associated with nasalward/ temporalward biases in monocular motion VEP that persist into adulthood (Birch et al., 2000; Bosworth & Birch, 2007; Hamer, Norcia, Orel-Bixler, & Hoyt, 1993; Jampolsky et al., 1994; Norcia et al., 1991, 1995; Tychsen, Hertig, & Scott, 2004; ). Adults with a history of infantile esotropia generally manifest the full proile of asymmetrical motion responses characteristic of the immature visual system - asymmetric MOKN and smooth pursuit (Lisberger, Morris, & Tychsen, 1987;
Schor & Levi, 1980; Sokol, Peli, Moscowitz, & Reese, 1991; Tychsen et al., 1985; Tychsen & Lisberger, 1986; Walton & Lisberger, 1989), as well as asymmetric MVEPs (Hamer et al., 1993; Jampolsky et al., 1994; Norcia et al., 1991, 1995). In addition, the DMA is negatively correlated with the presence of bifoveal fusion in infants and children with various forms of esotropia (Fawcett & Birch, 2000). In fact, Fawcett and Birch (2000) suggested that measurement of MVEP motion asymmetries can be considered as an objective index of bifoveal fusion.
Second, early surgical eye alignment (before two years of age) is associated with a signiicant reduction in the magnitude of asymmetry in infantile esotropia patients (Bosworth & Birch, 2007; Gerth et al., 2008; Jampolsky et al., 1994; Norcia et al., 1995). Taken together, these studies imply that the motion mechanisms underlying the monocular MOKN and MVEP responses are inherently part of a binocular subsystem.
A third, indirect, line of evidence implies that the asymmetries observed in monocular motion VEPs represent activity of inherently binocular cells. Chandna et al. (1993) showed that following adaptation to a drifting grating, monocular motion VEPs in normal adults became asymmetric, manifesting signiicant F1 components not present prior to adaptation. The motion adaptation effect exhibited interocular transfer, causing the appearance of asymmetric responses (F1) in the unadapted eye (interocular transfer of an adaptation-induced asymmetry).
Due to the link between motion-based oculomotor asymmetries and clinical conditions affecting binocular development, the present work has potential clinical implications, both for understanding the etiology of diseases and for improved management. The monitoring of the status of a binocular motion subsystem, as represented by the DMA, has not been adequately explored as a potential interventional resource. Some studies have been encouraging along these lines. Jampolsky et al. (1994) found signiicant reductions in VEP motion asymmetry in infantile esotropia patients who had undergone full-time alternate occlusion therapy prior to surgery. In addition, the VEP asymmetry seems to maintain some degree of plasticity. Norcia et al. (1995) found that the motion VEP asymmetry is signiicantly lower in infantile esotropia patients who underwent early, successful strabismus surgery when compared with an age-matched group of patients with later or less successful surgical outcomes. These indings have been recently conirmed by Gerth et al. (2008), who found that monocular VEP motion asymmetries were signiicantly lower (same as control infants) in infants submitted to early surgery for infantile esotropia than in infants receiving a standard (later) surgery protocol.
about clinically relevant motion responses. Such information could be helpful in the assessment of clinical interventions and/or in clinical management of patient groups such as those with infantile esotropia, and could thus expand the options for clinical evaluation/treatment beyond current approaches (e.g., Bosworth & Birch, 2007; Gerth et al., 2008; Jampolsky et al., 1994; Norcia et al., 1995).
Relationship with neural magnocellular and parvocellular processing streams
Ideally, we would like to be able to explain the VEP responses with speciic underlying neural substrates, e.g. with transient (phasic) and sustained (tonic) ganglion cell signals, and/or with signals in the magnocellular (M) vs parvocellular (P) geniculocortical processing streams. However, the association between transient and sustained mechanisms as deined psychophysically, and physiological signals emanating from transient (phasic) and sustained (tonic) retinal ganglion cells is not as straightforward as hypothesized earlier (Merigan et al., 1991; Merigan & Maunsell, 1993), nor is their relationship to the M and P geniculocortical projections. Moreover, the linking hypotheses associating responses from phasic (physiology) parasol (retinal anatomy) ganglion cells and M cells (LGN anatomy and physiology) are not clear cut. For example, it has been shown that, under some conditions, P cells in the LGN are, on average, more transient than M cells (Levitt et al., 2001; reviewed in Skottun & Skoyles, 2007b). Moreover, the functional architecture of the cortical projections of the M- and P-mediated signals is highly complex, with varying proportions of cells manifesting motion/direction selectivity in the different cortical layers and areas (Felleman & Van Essen, 1991; Gegenfurtner & Hawken, 1996; Gegenfurtner, Kiper & Levitt, 1997; Nassi & Callaway, 2009). Thus, the assignment of F1 and F2 responses to M or P depends not only on the particular array of parameters of the stimulus being used, but on the locus of the cortical cells generating the responses.
Our data are not, by themselves, adequate to individually identify underlying neural substrates associated with the SF cutoffs and the F1 and F2 response components. The cutoffs for the F1 responses almost certainly relect the responses from DS cortical neurons, and it would be natural to associate these with M signals. However, the attribution of F1 (asymmetrical) responses to M cells cannot yet be made. Varying proportions of cortical cells manifest motion/direction selectivity in the different cortical layers and areas (Felleman & Van Essen, 1991; Gegenfurtner & Hawken, 1996; Gegenfurtner et al., 1997; Nassi & Callaway, 2009).
Our working hypothesis for the high SF cutoffs of the F2 components would be to associate them with non-DS (P-mediated) responses. However, the M and P pathways do not parse out cleanly along spatial and
temporal dimensions, nor is directional selectivity restricted to neural responses in the M stream (e.g., Gegenfurtner & Hawken, 1996; Gegenfurtner et al., 1997; Nassi & Callaway, 2009; Sincich & Horton, 2005). There is substantial overlap in their ST domains (see Skottun & Skoyles, 2007a,b and Nassi & Callaway, 2009). In addition, the relative contribution of M and P signals to what is recorded in the VEP is likely to vary during sweeps of SF since the degree to which the stimulus is suprathreshold varies at the same time (reviewed by Skottun & Skoyles, 2008a, 2008b).
Thus, further research would be needed, with selective manipulation of additional stimulus parameters such as contrast, luminance, and chromatic content, to clarify the links between the JSF Sweep VEP responses we have measured and the known candidate physiological substrates.
Implications of the DMA for models of motion perception
One challenge for any comprehensive model of motion mechanisms in normal adult (primate) vision is that it must be “reducible” - either by changes in parameter values, or by elimination of one or more pathways in the model - to a form that predicts the asymmetries observed in normal development. No current motion model can account for the full range of phenomena observed in normal (and abnormal) development of motion processing. The most popular Reichardt type models are inherently monocular, and cannot account for a link between binocularity and directional selectivity (Adelson & Bergen, 1985; Borst & Egelhaaf, 1993; Poggio & Reichardt, 1973; Reichardt, 1961, 1987; van Santen & Sperling, 1984, 1985; Watson & Ahumada, 1985). Other models may incorporate binocularity (Cynader & Regan, 1978; Shadlen & Carney, 1986), but cannot account for motion asymmetries observed in infancy. Grzywacz & Norcia (1995) proposed a Hebbian mechanism by which simultaneous activation of binocular cells by correlated motion could consolidate a symmetrical response, but they did not propose a convincing mechanism by which the nasalward/temporalward bias is irst established. Thus, a comprehensive model of primate motion processing must include not only a mechanism that accounts for monocular directional selectivity in adult vision, but must include mechanisms by which (1) direction selectivity itself is established early in development, (2) the initial distribution of direction selectivities is biased in opposite directions in the two eyes, and (3) the neonatal biases are resolved through a process of binocular interaction.
Acknowledgements
We would like to thank Sarah Clarke for help in database management and analysis. Kirk Swenson and Takeishi Doi programmed the VEP data acquisition and analysis system. This research was supported by EY06579 and the Smith-Kettlewell Eye Research Foundation.
References
Adelson, E.H., & Bergen, J.R. (1985). Spatiotemporal energy models for the perception of motion. Journal of the Optical Society of America A, 2, 284-299.
Ales, J.M., & Norcia, A.M. (2009). Assessing direction-speciic adaptation using the steady-state visual evoked potential: Results from EEG source imaging. Journal of Vision 9, 1-13.
Allen, D.A., Norcia, A.M., & Tyler, C.W. (1986). Comparative study of electrophysiological and psychophysical measurement of the contrast sensitivity function in humans. American Journal of Optometry & Physiological Optics, 63, 442-449.
Almoqbel, F., Leat, S.J., & Irving, E. (2008). The technique, validity and clinical use of the sweep VEP. Ophthalmic Physiological Optics, 28, 393-403.
Anderson, S.J., & Burr, D.C. (1985). Spatial and temporal selectivity of human motion detection system. Vision Research, 25, 1147-1154. Anderson, S.J., & Burr, D.C. (1991). Spatial summation properties of
directionally selective mechanisms in human vision. Journal of the Optical Society of America A, 8, 1330-1339.
Aslin, R.N., & Shea, S.L. (1990). Velocity thresholds in human infants: Implications for the perception of motion. Developmental Psychology, 26, 589-598.
Atkinson, J. (1979). Development of optokinetic nystagmus in the human infant and Monkey infant. In: Freeman, R.D. (Ed.), Development Neurobiology of Vision (pp. 277-287). New York Plenum.
Atkinson, J., & Braddick, O.J. (1981). Development of optokinetic nystagmus in infants: An indicator of cortical binocularity? In: Fisher, D.F., Monty, R.A., & Senders, J.W. (Ed.), Eye movements: Cognition and Visual Perception. Hillsdale, NJ: Erlbaum. Badcock, D.R., & Derrington, A.M. (1985). Detecting the
displacement of periodic patterns. Vision Research, 25, 1253-1258. Banks, M.S., Stephens, B.R., & Hartmann, E.E. (1985). The development
of basic mechanisms of pattern vision: spatial frequency channels.
Journal of Experimental Child Psychology, 40, 501-527.
Banton, T., & Bertenthal, B.I. (1996). Infants’ sensitivity to uniform motion. Vision Research, 36, 1633-1640.
Bertenthal, B.I., & Bradbury, A. (1992). Infants’ detection of shearing motion in random-dot displays. Developmental Psychology, 28, 1056-1066. Birch, E.E., Fawcett, S., & Stager, D. (2000). Co-development of
VEP motion response and binocular vision in normal infants and infantile esotropes. Investigative Ophthalmology & Visual Science, 41, 1719-1723.
Birch, E.E., Shimojo, S., & Held, R. (1985). Preferential-looking assessment of fusion and stereopsis in infants aged 1-6 months.
Investigative Ophthalmology & Visual Science, 26, 366-370. Borst, A., & Egelhaaf, M. (1993). Detecting visual motion: theory and
models. Reviews of Oculomotor Research, 5, 3-27.
Bosworth, R.G., & Birch, E,E. (2007). Direction-of-motion detection and motion VEP asymmetries in normal children and children with infantile esotropia. Investigative Ophthalmology & Visual Science,
48, 5523-5531.
Brosnahan, D., Norcia, A.M., Schor, C.M., & Taylor, D.G. (1998). OKN, perceptual and VEP direction biases in strabismus. Vision Research, 38, 2833-2840.
Brown, R.J., Norcia, A.M., Hamer, R.D., Wilson, J.R., & Boothe, R.G. (1993). Development of motion processing mechanisms in monkey and human infants. Investigative Ophthalmology and Visual Science (Suppl.), 34, 1356.
Campbell, F.W., & Green, D.G. (1965). Optical and retinal factors affecting visual resolution. Journal of Physiology, 181, 576-593. Campbell, F.W., & Kulikowski, J.J. (1972). The visual evoked
potential as a function of contrast of a grating pattern. Journal of Physiology, 222, 345-356.
Campbell, F.W., & Maffei, L. (1970). Electrophysiological evidence
for the existence of orientation and size detectors in the human visual system. Journal of Physiology, 207, 635-652.
Chandna, A., Norcia, A.M., & Peterzell, D.H. (1993). VEP correlates of direction-speciic binocular mechanisms. Investigative Ophthalmology and Visual Science (Suppl.), 34, 1054.
Clarke, P.G.H. (1974). Are visual evoked potentials to motion-reversal produced by direction-sensitive brain mechanisms? Vision Research, 14, 1281-1284.
Cynader, M., & Regan, D. (1978). Neurones in cat parastriate cortex sensitive to the direction of motion in three-dimensional space.
Journal of Physiology, 274, 549-569.
Dannemiller, J.L., & Freedland, R.L. (1989). The detection of slow stimulus movement in 2- to 5-month-olds. Journal of Experimental Child Psychology, 47, 337-355.
Dannemiller, J.L., & Freedland, R.L. (1993). Motion-based detection by 14-week-olds. Vision Research, 33, 657-664.
Dobkins, K.R., & Teller, D.Y. (1996). Infant contrast detectors are selective for direction of motion. Vision Research, 36, 281-294. Fawcett, S.L., & Birch, E.E. (2000). Motion VEPs, Stereopsis,
and bifoveal fusion in children with strabismus. Investigative Ophthalmology & Visual Sciences, 41, 411-416.
Felleman, D.J., & Van Essen, D.C. (1991). Distributed hierarchical processing in the primate cerebral cortex. Cerebral Cortex, 1, 1-47. Fiorentini, A., Pirchio, M., & Spinelli, D. (1983). Electrophysiological evidence for spatial frequency selective mechanisms in adults and infants. Vision Research, 23, 119-127.
Fox, R., Aslin, R.N., Shea, S.L., & Dumais, S.T. (1980). Stereopsis in human infants. Science, 207, 323-324.Gegenfurtner, K.R. & Hawken, M.J. (1996). Interaction of motion and color in the visual pathways. Trends in Neuroscience, 19, 394-401.
Gegenfurtner, K.R., Kiper, D.C., & Levitt, J.B. (1997). Functional properties of neurons in macaque area V3. Journal of Neurophysiology, 77, 1906-1923.
Gerth, C., Mirabella, G., Li, X., Wright, T., Westall, C.A., Colpa, L. & Wong, A. (2008). Timing of Surgery for Infantile Esotropia in Humans: Effects on Cortical Motion Visual Evoked Responses.
Investigative Ophthalmology and Visual Science, 49:3432-3437. Graham, N.V.S. (1989). Visual Pattern Analyzers. New York: Oxford
University Press.
Grzywacz, N.M., & Norcia, A.M. (1995). Directional Selectivity in the Cortex. In: Arbib, M.A. (Ed.), The Handbook of Brain Theory and Neural Networks (pp. 309-311). Cambridge, MA: MIT Press. Hamer, R. D., Norcia, A. M., Tyler, C. W.,& Hsu-Winges, C. (1989).
The development of monocular and binocular VEP acuity. Vision Research, 29, 397-408.
Hamer, R.D., & Norcia, A.M. (1994). The development of motion sensitivity during the irst year of life. Vision Research, 34, 2387-2402. Hamer, R.D., Norcia, A.M., Orel-Bixler, D., Hoyt, C.S. (1993). Motion
VEPs in late-onset esotropia. Clinical Vision Science, 8, 55-62. Harwerth, R.S., Boltz, R.L., & Smith, E.L. (1980). Psychophysical
evidence for sustained and transient channels in monkey visual system. Vision Research, 20, 15-22.
Jampolsky, A., Norcia, A.M., & Hamer, R.D. (1994). Preoperative alternate occlusion decreases motion processing abnormalities in infantile esotropia. Journal of Pediatric Ophthalmology & Strabismus, 31, 6-17.
Kaufmann, F., Stucki, M., & Kaufmann-Hayoz, R. (1985). Development of infants’ sensitivity for slow and rapid motions.
Infant Behavior & Development, 8, 89-98.
Keesey, V.T. (1972). Flicker and pattern detection: A comparison of thresholds. Journal of the Optical Society of America, 62, 446-448. Kulikowski, J.J., & Tolhurst, D.J. (1973). Psychophysical evidence
for sustained and transient detectors in human vision. Journal of Physiology (Lond.), 232, 149-162.
Legge, G.E. (1978). Sustained and transient mechanisms in human vision: Temporal and spatial properties. Vision Research, 18, 69–81. Levinson, R.S., & Sekuler, R. (1973). Spatio-temporal contrast
sensitivities for moving and lickering stimuli. Paper presented at the meeting of the Optical Society of America, Rochester, NY. Levinson, R.S., & Sekuler, R. (1975). The independence of channels
in human vision selective for direction of movement. Journal of Physiology, 250, 347-366.