In vivo
evaluation of cortical thickness with magnetic
resonance imaging in patients with bipolar disorder
Thomas Martin Doring
1,2, Tadeu Takao Almodovar Kubo
1, Juliana Rodrigues Doring
1, Jiosef
Fainberg
4, Mario Juruena
3, Romeu Cortes Domingues
1,2, Emerson Leandro Gasparetto
1,21 Clínica de Diagnóstico Por Imagem, Rio de Janeiro, Brazil.
2 Universidade Federal do Rio de Janeiro, Brazil.
3 Universidade de São Paulo, Brazil.
4 Centro de Medicina Integrativa do Rio de Janeiro, Brazil.
Abstract
Changes in cortical thickness can be related to neuropsychiatric disorders and neurodegenerative processes. Previous studies have been conducted to characterize the pattern of changes in cortical thickness in several psychiatric diseases. The aim of the present study was to evaluate changes in cortical thickness with magnetic resonance imaging (MRI) in patients with bipolar disorder. Twenty-seven patients with bipolar disorder (14 male, 36.0 ± 16.2 years old; 13 female, 41.6 ± 10.7 years old) and 40 healthy controls (16 male, 36.0 ± 10.5 years old; 24 female, 37.0 ± 4.7 years old) underwent 3T MRI. Sagittal T1-weighted magnetization prepared rapid acquisition gradient echo images were acquired (voxel size, 1.33 mm3; 128 slices; in-plane matrix resolution, 256 × 256; lip angle, 7º; repetition time, 2530 ms; echo time, 3.39 ms; inversion time, 1100 ms). Cortical
segmentation was performed using FreeSurfer 4.0.5. The results indicated both thinning and thickening of the cerebral cortex in
patients with bipolar disorder compared with controls, depending on gender. Signiicant (p < .01) thickening was observed in the
right hemisphere superior-parietal cortex in female patients with bipolar disorder, and signiicant (p < .05) thinning was observed
in the left hemisphere caudal-anterior cingulate in male patients with bipolar disorder. The other regions did not show signiicant
differences. The results suggest that an analysis of cortical thickness with MRI in patients with bipolar disorder may allow
identiication of areas that may be morphologically changed compared with controls. Demonstration of these alterations will
elucidate the pathophysiology of bipolar disorder and may contribute to better therapies for this disorder. Keywords: Magnetic resonance imaging, neuroimaging, bipolar disorder, cortical thickness, morphometry.
Received 3 November 2009; received in revised form 28 December 2009; accepted 28 December 2009. Available on line 29 December 2009.
Thomas Martin Doring, Romeu Cortes Domingues, Emerson Leandro Gasparetto - Clínica de Diagnóstico Por Imagem, Rio de Janeiro, Brazil, and Departamento de Radiologia da Universidade Federal do Rio de Janeiro, Brazil. Tadeu Takao Almodovar Kubo, Juliana Rodrigues Doring - Clínica de Diagnóstico Por Imagem, Rio de Janeiro, Brazil. Mário Jurena – Faculdade de Medicina da Universidade de São Paulo, Ribeirão Preto, Brazil. Correspondence regarding this article should be directed to: Thomas Doring, Av. Prefeito Dulcidio Cardoso 2800, Apt .304. Rio de Janeiro, Brazil, 22631052. Email: [email protected]
Introduction
Bipolar affective disorder is a common, life-long progressive illness that normally begins in adolescence, with a lifetime prevalence of 1.0% (Lewinsohn, Klein, & Seeley, 1995). Several magnetic resonance imaging (MRI) studies have related morphological brain changes in bipolar disorder patients with healthy people, mainly in the frontal
lobe (Soares & Mann, 1997; Strakowski, Adler, & Del Bello, 2002; Drevets et al., 1997), ventricles and white matter (McDonald et al., 2004; Stoll, Renshaw, Yurgelun-Todd, & Cohen, 2000), subcortical regions (amygdala; Altshuler, Bartzokis, Grieder, Curran, & Mintz, 1998; Strakowski et al., 1999; Brambilla et al., 2001), hippocampus (Sax et al., 1999), basal ganglia (Brambilla et al., 2001; Aylward et al., 1994), and cortical regions (Lyoo et al., 2006).
Regarding the subcortical structural changes, inconsistent results have been obtained in the amygdala, hippocampus, and basal ganglia (Geuze, Vermetten, & Bremner, 2005), mainly attributable to differences in the acquisition protocols and volume measurement methods.
are impaired in bipolar disorder. Measurement of cortical thickness may provide important insights into the speciic characterization of neuroanatomical changes in this disease. Thickness changes in multiple prefrontal cortices have been found in patients with bipolar disorder (Lyoo et al., 2006).
The morphometric measurement of the cortex is a difficult procedure because this structure is highly folded, which complicates manual determination of cortical thickness. Automated techniques have been developed to measure cortical thickness using high-resolution MRI and a surface-based reconstruction algorithm of the cortex (Fischl & Dale, 2000).
The aim of the present study was to measure cortical thickness in patients with bipolar disorder using automated surface-based analysis software (FreeSurfer) and to evaluate the structural changes in these patients. Demonstrating signiicant differences between the two groups in the brain areas responsible for emotional regulation using MRI as a noninvasive diagnostic method combined with automated cortical segmentation tools may aid in the diagnosis of bipolar disorder.
Method
Participants
All patients signed informed consent forms, and the study was approved by the clinical Institutional Review Board. Twenty-seven patients with bipolar disorder (14 male, 36.0 ± 16.2 years old; 13 female, 41.6 ± 10.7 years old) and 40 healthy controls (16 male, 36.0 ± 10.5 years old; 24 female, 37.0 ± 4.7 years old) were demographically matched. Patients were diagnosed with bipolar affective disorder by a senior psychiatrist (J.F.) using the Structured Clinical Interview for DSM-IV (First, Spitzer, Gibbon, & Williams, 1997), which was translated and adapted to Portuguese (Del-Ben et al., 2001).
MR image acquisition
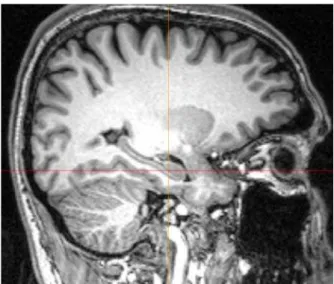
T1-weighted images in the sagittal plane of all subjects were acquired using a 3.0 T imaging system (Verio, Siemens Medical, Erlangen, Germany) with a three-dimensional magnetization prepared rapid acquisition gradient echo (3D-MPRAGE) sequence (repetition time, 2530 ms; echo time, 3.39 ms; lip angle, 7°; inversion time, 1100 ms; bandwidth, 190 Hz/pixel; in-plane matrix resolution, 256 x 256; slice thickness, 1.3 mm; number of slices, 128; voxel size, 1.3 mm³; no parallel imaging technique; number of averages, 1; total acquisition time, 8 min 6 s). The image acquisition protocol was adapted from a protocol proposed by the Athinoula A. Martinos Center for Biomedical Imaging (Boston, MA, USA), which optimizes gray and white matter contrast (Fig. 1).
Image processing and cortical thickness measurements
The T1-weighted images were transferred to a computer workstation (Mac Pro, Apple, Cupertino, CA, USA) with 8 GB of memory and two Quad-Core Intel Xeon processors (2 x 3.2 GHz). Cortical reconstruction and volumetric segmentation were performed with FreeSurfer v. 4.0.5 (Martinos Center, Boston, MA, USA; http://surfer.nmr.mgh.harvard.
edu/; access February 5, 2010). The technical details of these procedures have been described previously (Fischl et al., 2002; Desikan et al., 2006). Briely, this processing includes motion correction, removal of non-brain tissue using a hybrid watershed/ surface deformation procedure, automated Talairach transformation, segmentation of subcortical white matter and deep gray matter volumetric structures (including the hippocampus, amygdala, caudate, putamen, and ventricles), intensity normalization, tessellation of the gray matter/white matter boundary, automated topology correction, and surface deformation and inlation of the cerebrum. Thickness maps are calculated automatically.
After registration of all cortical thickness maps of each subject to a standard space, the mean cortical thickness in a region-of-interest in the bipolar group and control group, differentiated by gender, was calculated and statistically compared.
Statistics
Statistical analysis was performed using the QDEC tool in the FreeSurfer software suite and R-software v. 2.9.0 (Auckland, New Zealand). Patients with bipolar disorder were demographically matched to controls, and differences in cortical thickness were analyzed using Student’s t-test to detect signiicant differences in the
mean cortical thickness in various cortical regions. Figure 1. Three-dimensional T1-weighted images with high
spatial resolution and good white matter/grey matter contrast
Results
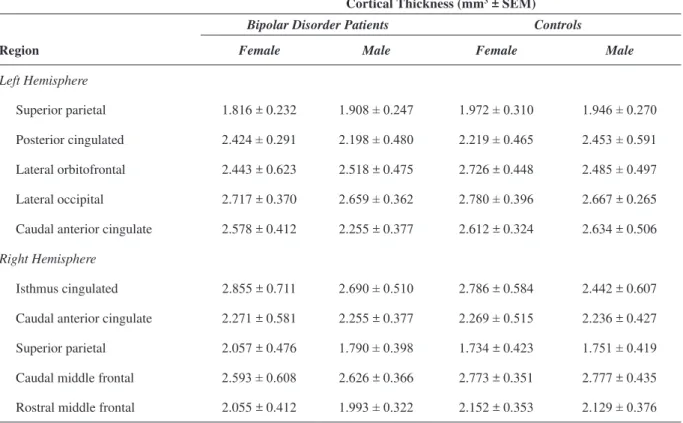
Alterations in cortical thickness in patients with bipolar disorder are listed in Table 1. The regions shown in the table indicate the cortical regions with the greatest statistical differences between groups. Both cortical thinning and thickening can be seen in patients with bipolar disorder compared with controls. Additionally, the thinning and thickening depended on gender. Signiicant (p < .01) thickening was observed in the right hemisphere superior-parietal cortex in females with bipolar disorder, and signiicant (p < .05) thinning was observed in the left hemisphere caudal-anterior cingulate in males with bipolar disorder. The other regions did not exhibit signiicant differences between groups.
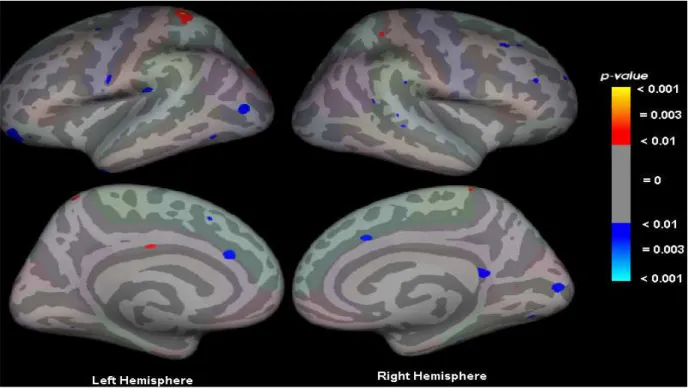
Figure 2 shows the statistical maps of significant differences in cortical thickness between patients with bipolar disorder compared with controls. The maps are overlayed on an inflated cerebrum in standard space (Talairach).
Discussion
In the present study, regions with thinning and thickening of the cortex were observed in patients with bipolar disorder compared with controls. In the male bipolar group, the caudal-anterior cingulate showed a signiicant (p < .01) difference, and in the female group, signiicant (p < .05) thickening was observed. Other regions showed differences in cortical thickness, but these differences were not signiicant (p > .05).
Lyoo et al. (2006) also used a surface-based reconstruction algorithm and found signiicant cortical thinning in bipolar disorder patients. In the left hemisphere, signiicant decreases in cortical thickness were observed in the middle frontal cortex (2.24 mm3
vs. 2.38 mm3), postcentral cortex (2.53 mm3 vs. 2.74
mm3), pregenual anterior cingulate cortex (2.93 mm3
vs. 3.11 mm3), dorsal anterior cingulate cortex (2.50
mm3 vs. 2.68 mm3), posterior cingulate cortex (2.45
mm3 vs. 2.57 mm3), and middle occipital cortex (1.90
mm3 vs. 2.06 mm3) between bipolar subjects and
healthy controls, respectively. In the right hemisphere, signiicant decreases in cortical thickness were observed in the medial frontal cortex (2.49 mm3vs. 2.66 mm3),
postcentral cortex (1.95 mm3 vs. 2.14 mm3), angular
cortex (2.39 mm3 vs. 2.59 mm3), and fusiform cortex
(1.90 mm3 vs. 2.05 mm3) between bipolar subjects
and healthy controls. These authors did not evaluate cortical thickness differences by gender, making comparisons with our results dificult. However, to emphasize the importance of evaluating groups by gender, although Lyoo et al. (2006) found a signiicant reduction in the posterior cingulate in patients with bipolar disorder, including both males and females, we found nonsigniicant cortical thinning in the male group but signiicant thickening in the female group.
One limitation of the present study was the small number of demographically matched subjects, but from a statistical analysis standpoint, the number of subjects had suficient statistical power. Future studies will require a larger number of subjects to further understand the
Figure 2. Statistical maps of regions showing signiicant differences overlayed on an inlated cerebrum that shows the regions where differences existed (either thicker or thinner) in patients with bipolar disorder compared with controls. The sidebar shows
pathophysiology of patients with bipolar disorder. Moreover, the speciic clinical patient characteristics were not assessed in the present study, such as age of onset of bipolar disorder, illness duration, number of episodes, family history, or medications. Future studies should correlate these parameters, which may impact the results.
In conclusion, the in vivo analysis of cortical thickness using MRI combined with a surface-based reconstruction algorithm allowed the identiication of morphologically altered brains areas in patients with bipolar disorder. Demonstration of these alterations will elucidate the pathophysiology of bipolar disorder and may contribute to better therapies for this disorder. Further studies with a greater number of demographically matched subjects will be necessary.
References
Altshuler, L.L., Bartzokis, G., Grieder, T., Curran, J., & Mintz, J.
(1998). Amygdala enlargement in bipolar disorder and hippocampal
reduction in schizophrenia: an MRI study demonstrating neuroanatomic
speciicity. Archives of General Psychiatry, 55, 663-664.
Aylward, E.H., Roberts-Twillie, J.V., Barta, P.E., Kumar, A.J., Harris, G.J., Geer, M., Peyser, C.E., & Pearlson, G.D. (1994). Basal
ganglia volumes and white matter hyperintensities in patients with bipolar disorder. American Journal of Psychiatry, 151, 687-693.
Brambilla, P., Harenski, K., Nicoletti, M.A., Mallinger, A.G.,
Frank, E., Kupfer, D.J., Keshavan, M.S., & Soares, J.C. (2001). Anatomical MRI study of basal ganglia in bipolar disorder patients.
Psychiatry Research, 106, 65-80.
Del-Ben, C.M., Vilela, J.A.A., Crippa, J.A.S., Hallak, J.E.C., Labate, C.M., & Zuardi, A.W. (2001). Coniabilidade da “Entrevista
Clínica Estruturada para o DSM-IV – Versão Clínica” traduzida para o
português. Revista Brasileira de Psiquiatria, 23, 156-159.
Desikan, R.S., Segonne, F., Fischl, B., Quinn, B.T., Dickerson,
B.C., Blacker, D., Buckner, R.L., Dale, A.M., Maguire, R.P., Hyman,
B.T., Albert, M.S., & Killiany, R.J. (2006). An automated labeling system for subdividing the human cerebral cortex on MRI scans into gyral based regions of interest. Neuroimage, 31, 968-980.
Drevets, W.C., Price, J.L., Simpson, J.R. Jr., Todd, N.D., Reich,
T., Vannier, M., & Raichle, M.E. (1997). Subgenual prefrontal cortex
abnormalities in mood disorders. Nature, 386, 824-827.
First, B., Spitzer, R.L., Gibbon, M., & Williams, J.B.W. (1997). Structured clinical interview for DSM-IV Axis I disorders: patient edition (version 2.0, 4/97 revision). New York: New York State Psychiatric Institute.
Fischl, B., & Dale, A.M. (2000). Measuring the thickness of the human cerebral cortex from magnetic resonance images. Proceedings of the National Academy of Sciences of the United States of America,
97, 11050-11055.
Fischl, B., Salat, D.H., Busa, E., Albert, M., Dieterich, M., Haselgrove, C., van der Kouwe, A., Killiany, R., Kennedy, D.,
Klaveness, S., Montillo, A., Makris, N., Rosen, B., & Dale, A.M. (2002). Whole brain segmentation: automated labeling of neuroanatomical structures in the human brain. Neuron, 33, 341-355.
Geuze, E., Vermetten, E., & Bremner, J.D. (2005). MR-based
in vivo hippocampal volumetrics: 2. Findings in neuropsychiatric disorders. Molecular Psychiatry, 10, 160-184.
Lewinsohn, P.M., Klein, D.N., & Seeley, J.R. (1995). Bipolar
disorders in a community sample of older adolescents: prevalence, phenomenology, comorbidity, and course. Journal of the American Academy of Child and Adolescent Psychiatry, 34, 454-463.
Lyoo, I.K., Sung, Y.H., Dager, S.R., Friedman, S.D., Lee, J.Y., Kim,
S.J., Kim, N., Dunner, D.L., & Renshaw, P.F. (2006). Regional cerebral cortical thinning in bipolar disorder. Bipolar Disorders, 8, 65-74.
McDonald, C., Zanelli, J., Rabe-Hesketh, S., Ellison-Wright, I.,
Sham, P., Kalidindi, S., Murray, R.M., & Kennedy, N. (2004). Meta-analysis of magnetic resonance imaging brain morphometry studies in bipolar disorder. Biological Psychiatry, 56, 411-417.
Sax, K.W., Strakowski, S.M., Zimmerman, M.E., DelBello,
M.P., Keck, P.E. Jr., & Hawkins, J.M. (1999). Frontosubcortical
neuroanatomy and the continuous performance test in mania.
American Journal of Psychiatry, 156, 139-141.
Table 1. Cortical thickness in different brain regions in bipolar disorder patients and controls. The regions shown in the table are
the cortical regions with the greatest signiicance.
Cortical Thickness (mm3 ± SEM)
Bipolar Disorder Patients Controls
Region Female Male Female Male
Left Hemisphere
Superior parietal 1.816 ± 0.232 1.908 ± 0.247 1.972 ± 0.310 1.946 ± 0.270
Posterior cingulated 2.424 ± 0.291 2.198 ± 0.480 2.219 ± 0.465 2.453 ± 0.591
Lateral orbitofrontal 2.443 ± 0.623 2.518 ± 0.475 2.726 ± 0.448 2.485 ± 0.497
Lateral occipital 2.717 ± 0.370 2.659 ± 0.362 2.780 ± 0.396 2.667 ± 0.265
Caudal anterior cingulate 2.578 ± 0.412 2.255 ± 0.377 2.612 ± 0.324 2.634 ± 0.506
Right Hemisphere
Isthmus cingulated 2.855 ± 0.711 2.690 ± 0.510 2.786 ± 0.584 2.442 ± 0.607
Caudal anterior cingulate 2.271 ± 0.581 2.255 ± 0.377 2.269 ± 0.515 2.236 ± 0.427
Superior parietal 2.057 ± 0.476 1.790 ± 0.398 1.734 ± 0.423 1.751 ± 0.419
Caudal middle frontal 2.593 ± 0.608 2.626 ± 0.366 2.773 ± 0.351 2.777 ± 0.435
Soares, J.C., & Mann, J.J. (1997). The anatomy of mood disorders: review
of structural neuroimaging studies. Biological Psychiatry, 41, 86-106. Stoll, A.L., Renshaw, P.F., Yurgelun-Todd, D.A., & Cohen, B.M. (2000). Neuroimaging in bipolar disorder: what have we learned?
Biological Psychiatry, 48, 505-517.
Strakowski, S.M., Adler, C.M., & DelBello, M.P. (2002). Volumetric MRI studies of mood disorders: do they distinguish
unipolar and bipolar disorder? Bipolar Disorders, 4, 80-88.
Strakowski, S.M., DelBello, M.P., Sax, K.W., Zimmerman, M.E.,
Shear, P.K., Hawkins, J.M., & Larson, E.R. (1999). Brain magnetic
resonance imaging of structural abnormalities in bipolar disorder.
Archives of General Psychiatry, 56, 254-260.