Effects of age and education level on the Trail Making Test
in A healthy Brazilian sample
Amer C. Hamdan
1and Eli Mara L. R. Hamdan
21 Universidade Federal do Paraná, Brazil
2 Faculdades Integradas do Brasil, Brazil
Abstract
The Trail Making Test (TMT) has been a useful tool for neuropsychological assessment. The present study analyzed the inluence of age and education level on TMT performance in healthy adult Portuguese speakers. The criteria for exclusion were a history of neurological disease, psychiatric illness, substance abuse, learning disabilities, or any other dificulty that may interfere with testing. The sample (n = 318) was divided into four age groups: (i) very young (n = 92; 18-34 years old), (ii) young (n = 66; 35-49 years old), (iii) middle-age (n = 117; 50-64 years old), and (iv) elderly (n = 43; 65-81 years old). The sample was also divided into three education levels: (i) low (2-8 years), (ii) middle (9-11 years), and (iii) high (≥ 12 years). Correlations among the demographic variables and scores on Trails A and B showed that age and education level were the two variables that most affected TMT scores (p < 0.001, analysis of covariance). Post hoc analyses of age did not reveal signiicant differences between the middle-age and elderly groups in TMT-A performance or between middle and high education level in TMT-A or TMT-B performance. These results are consistent with previous studies and demonstrate that age and education level affect the performance of Brazilian subjects on the TMT. Keywords: aging, Trail Making Test, neuropsychological test, education level.
Received 30 October 2009; received in revised form 16 December 2009; accepted 17 December 2009. Available on line 29 December 2009.
Amer Cavalheiro Hamdan, Departamento de Psicologia, Universidade Federal do Paraná, Curitiba, Brazil. Eli Mara L. R. Hamdan, Faculdades Integradas do Brazil, Curitiba, Paraná, Brazil. Correspondence regarding this article should be directed to: Amer Cavalheiro Hamdan, Departamento de Psicologia, Universidade Federal do Paraná. Rua Paulo Friebe, 265, Bairro Alto, Curitiba, Paraná, CEP 82820-420 Brazil. Phone: 55-4133673011. E-mail: [email protected]
Introduction
The Trail Making Test (TMT) is one of the most common cognitive tests used in neuropsychological assessment (Rabin, Barr, & Burton, 2005). The test consists of two parts (A and B), one with numbers and the other with numbers and letters. The test must be performed as quickly and accurately as possible. In Part A, the task of the subject is to connect the numbers in ascending order (1-2-3-4...). In Part B, the subject is required to alternately connect numbers and letters in ascending order (for the numbers) and sequential order (for the alphabet letters; 1-A-2-B-3-C...). The time taken to complete each part is used when analyzing performance (Spreen & Strauss, 1998).
The TMT is considered a test of visual search,
attention, mental lexibility, motor function, and executive
function (Lezak, 1995; Spreen & Strauss, 1998). It has been widely used as a sensitive test for the detection
of various types of brain damage. Research shows that
TMT deicits are one of the most prevalent sequelae of
almost any disease that compromises brain function, including traumatic brain injury, schizophrenia, and dementia (Albert, Moss, Tanzi, & Jones, 2001; Ashendorf et al., 2008; Moll, Oliveira-Souza, Moll, Bramati, & Andreiuolo, 2002; Nitrini et al., 2005; Oliveira-Souza et al., 2000; Periáñez et al., 2007; Stuss et al., 2001).
The inluence of age and education level on the time
necessary to complete the TMT has been widely reported (Spreen & Strauss, 1998; Lezak, 1995; Mitrushina, Boone, Razani, & D’Elia, 2005). Some studies have examined how age affects the time to complete both the TMT-A and TMT-B and in adults have shown that the time necessary to complete the TMT increases with age (Periáñez et al., 2007; Tombaugh, 2004; Giovagnoli et al., 1996). In contrast, conclusions regarding the
inluence of education level on TMT performance
these studies only included participants with a relatively high education level, suggesting that the effects in a population with a relatively low education level have not been fully investigated. The purpose of the present
study was to examine the inluence of age and education
level on the time necessary to complete the TMT in a healthy Brazilian sample.
Method
Participants
A total of 318 participants were included in this study (136 males; 182 females; 18-81 years old). They were all Portuguese speakers and had normal or corrected-to-normal vision. The sample consisted of healthy adults recruited as volunteers from undergraduate university classes, university staff, social organizations, and government staff from the city of Curitiba, Brazil. A self-reported history of medical and psychiatric problems was obtained from each participant. Any person with a history of neurological disease, psychiatric illness, head injury, stroke, substance abuse, learning disabilities, or any other
dificulty that may interfere with testing were excluded
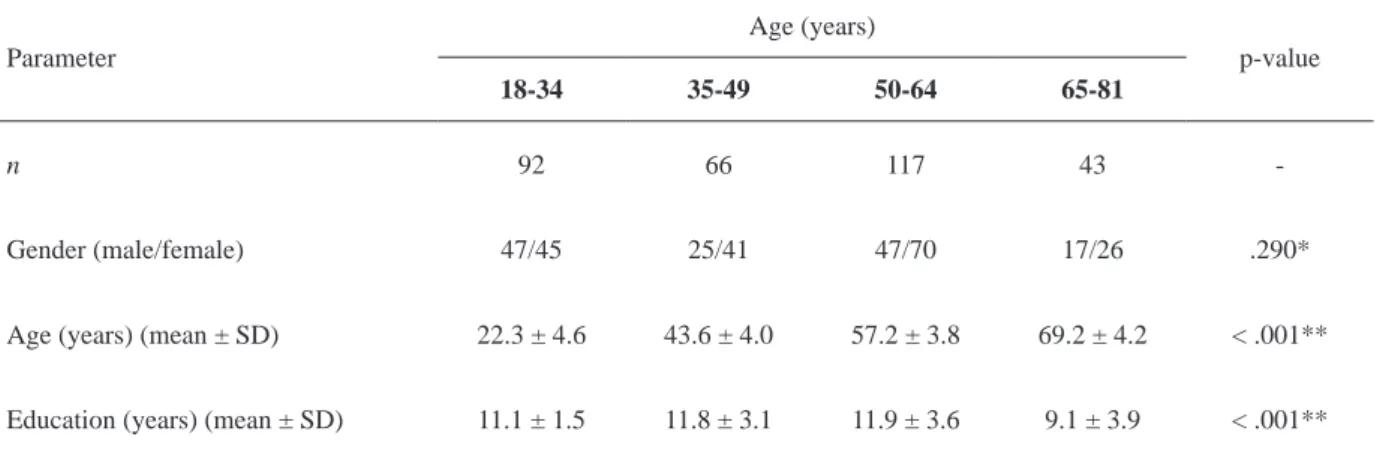
from the study. Subjects with scores less than 24 on the Mini Mental State Examination (Folstein, Folstein, & McHugh, 1975) and older subjects (60-81 years old) who scored higher than 4 on the Geriatric Depression Scale (Brink et al., 1982) were discarded from the analysis. All subjects were informed about the objectives and procedures involved in the study, and written informed consent was obtained prior to the interviews and tests. Table 1 provides the statistics between demographics and TMT variables of the sample.
Procedure
Subjects were administered part A and part B of the TMT (Reitan, 1992) according to the guidelines presented by Spreen and Strauss (1998). Each part was performed by all participants. When an error was made
on the test, the subject was instructed to return to the point where the error originated and to continue until the test was completed. The total time (s) necessary to complete parts A and B was recorded, which represented the TMT-A and TMT-B scores.
Statistics
Pearson’s correlation coefficients (r) were computed for the dependent (TMT-A AND TMT-B) and independent (age, education level, and gender) variables. The predictive value of the variables was explored using multiple linear regression analysis, thus clarifying their independent and unique contributions to predicting TMT performance. Univariate Analysis of Covariance (ANCOVA) was performed to examine the effect of age on TMT performance, with education level as a covariate. To identify the effect of education level on TMT performance, the age of the subjects was used
as a covariate. A signiicance level of .05 was set for all main contrasts. The Bonferroni-corrected signiicance
level of p < .05 was adopted for all tests of simple effects involving multiple comparisons. SPSS version 13.0 was used for all statistical analyses.
Results
Correlations among the demographic variables and TMT-A and TMT-B scores in the sample (n = 318)
provided an approach for selection of stratiication
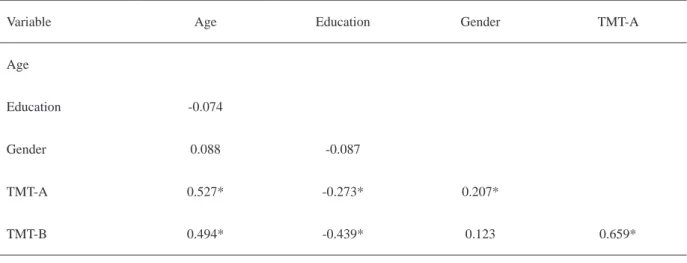
variables (Table 2). The results revealed that age and education level were more highly correlated with TMT scores than was gender. The relative effects of these variables on TMT performance were further explored using regression analysis. Age, education level, and gender together accounted for 37.6% and 43.2% of the variance on TMT-A and TMT-B, respectively. Age alone accounted for 32.1% of the variance on TMT-A and 30.8% on TMT-B. Education level alone accounted for 5.1% of the variance on TMT-A and
Parameter
Age (years)
p-value
18-34 35-49 50-64 65-81
n 92 66 117 43
-Gender (male/female) 47/45 25/41 47/70 17/26 .290*
Age (years) (mean ± SD) 22.3 ± 4.6 43.6 ± 4.0 57.2 ± 3.8 69.2 ± 4.2 < .001**
Education (years) (mean ± SD) 11.1 ± 1.5 11.8 ± 3.1 11.9 ± 3.6 9.1 ± 3.9 < .001**
*χ2 Test; **ANOVA; SD, standard deviation.
15.2% on TMT-B. Gender alone accounted for 4.2% of the variance on TMT-A and 1.3% on TMT-B. Age and education level were the two variables that most affected TMT scores.
A series of exploratory ANOVAs and prior approaches to normative data analysis for the TMT (Periáñez et al., 2007) we created four age groups: (i) very young (n = 92; 18-34 years old), (ii) young (n = 66; 35-49 years old), (iii) middle-age (n = 117; 50-64 years old), and (iv) elderly (n = 43; 65-81 years old). ANCOVA was performed on these data for the TMT-A and TMT-B. Table 3 shows the mean and standard deviation of the sample. As shown in Fig. 1A, all scores tended to increase with age (TMT-A, [F(3,313) = 54.3, p < .001]; TMT-B, [F(3,313) = 48.2, p < .001). Post hoc analyses revealed no signiicant differences in TMT-A scores between middle-age and elderly adults (p = .619).
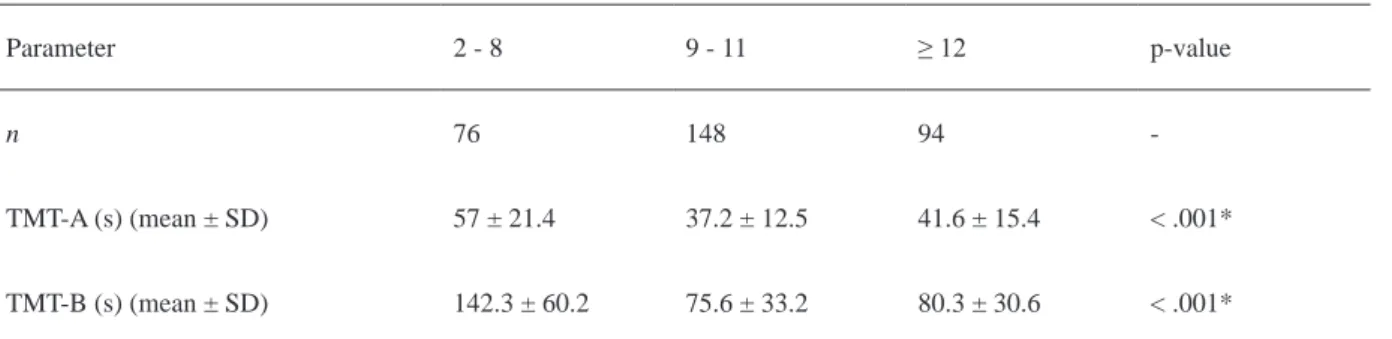
Three education level groups were created: low
(1-8 years), middle (9-11 years), and high (≥ 12 years).
Table 4 shows the mean and standard deviation of the three education levels. Fig. 1B shows the results of the ANCOVA, which revealed a decrease in the time
necessary to complete the TMT in subjects with a higher education level (TMT-A, [F(2,314) = 9.04, p < .001]; TMT-B, [F(2,314) = 32.31, p < .001]. Post hoc analyses
revealed no signiicant differences in TMT-A scores (p =
0.261) and no signiicant differences in TMT-B scores (p
= 1.000) between subjects with middle and high levels of education. In contrast, the low education group exhibited differences in TMT-A and TMT-B scores (p < .001).
Discussion
The aim of the present study was to analyze the effects of age and education level in healthy Brazilian subjects on TMT performance, one of the most widely used tests for neuropsychological assessment (Rabin et al., 2005; Spreen & Strauss, 1998; Lezak, 1995). The analyses of the effects of age and education level
conirmed that they had a signiicant impact on TMT performance. A signiicant increase in the time necessary
to complete both the TMT-A and TMT-B was observed in the very young group (18 years old) compared with
the elderly group (81 years old). A signiicant decrease
Table 2. Correlation between age, education level, and gender and time to complete Trails A and B.
Table 3. Effects of age on TMT performance.
Variable Age Education Gender TMT-A
Age
Education -0.074
Gender 0.088 -0.087
TMT-A 0.527* -0.273* 0.207*
TMT-B 0.494* -0.439* 0.123 0.659*
*p < .001
Parameter
Age (years)
p-value
18 -34 35 - 49 50 - 64 65 - 81
TMT-A (s) (mean ± SD) 30.9 ± 9 38.7 ± 14.1 50.4 ± 16.9 56.4 ± 20.1 < .001*
TMT-B (s) (mean ± SD) 64.6 ± 24.4 80.6 ± 41.2 107.5 ± 51.7 133.1 ± 51.8 < .001*
in the time necessary to complete the TMT was observed
in subjects with a higher education level (≥ 9 years).
Consistent with previous studies (Periáñez et al., 2007; Mitrushina et al., 2005; Tombaugh, 2004; Giovagnoli et al., 1996), the present study indicated that the time necessary to complete the TMT is affected by age. The mean time necessary to complete the TMT-A and TMT-B decreased with higher education levels, consistent with several previous reports (Periáñez et al., 2007; Giovagnoli et al., 1996; Stuss et al., 1987).
However, the effects of education level on TMT performance, especially the TMT-A, have been controversial. Other reports have concluded that
the TMT-A is not inluenced by education, but an inluence on the TMT-B was still observed (Tombaugh,
2004; Hashimoto et al., 2006; Ivnik et al., 1996). In the previous study, the sample included subjects with education only up to the fundamental school level (2-8 years). The effects of education level on TMT-A and
TMT-B performance were statistically signiicant for
persons with a low education level in the present sample.
Interestingly, however, we did not ind a signiicant difference between the middle (9-11 years) and high (≥
12 years) education level groups in TMT-A and TMT-B scores. Moreover, the mean time necessary to complete the TMT-A and TMT-B was high, especially in the low education level group. Thus, one possible interpretation
of these results is that the threshold for inluencing TMT
scores differs between education levels. For the TMT-A and TMT-B, the time necessary to complete the tests may
be inluenced by education level, provided the subjects
have at least some education (> 2 years). This result is consistent with previous reports, especially those
including highly educated subjects. Our data conirm that highly educated persons (≥ 9 years) are more likely
to complete the TMT-A and TMT- B in a shorter time than those with less education.
To summarize, the present study provides new data for neuropsychologists regarding the effects of age and education level to determine more precisely the
Figure 1. Performance on Trails A and B in a healthy Brazilian sample (s). (Top) Performance as a function of age (very young,
18-34 years old; young, 35-49 years old; middle-age, 50-64 years old; elderly, 65-81 years old). (Bottom) Performance as a function of education level (low, 2-8 years; middle, 9-11 years; high, ≥ 12 years).
A) B)
Parameter 2 - 8 9 - 11 ≥ 12 p-value
n 76 148 94
-TMT-A (s) (mean ± SD) 57 ± 21.4 37.2 ± 12.5 41.6 ± 15.4 < .001*
TMT-B (s) (mean ± SD) 142.3 ± 60.2 75.6 ± 33.2 80.3 ± 30.6 < .001*
*ANCOVA; SD, standard deviation.
extent to which these factors relect performance on
the TMT-A and TMT-B in healthy subjects. This issue
has repercussions for future research that may beneit from a more precise classiication of the effects of age
and education level. Additionally, we provide TMT performance data from a sample of healthy Brazilian individuals, which could be used for comparisons with clinical studies.
Acknowledgments
The authors are grateful to Alexandre Gonçalves Lopes and Luiz Paulo Leitão Martins for their help with data collection.
References
Albert, M.S., Moss, M.B., Tanzi, R., & Jones, K. (2001). Preclinical prediction of AD using neuropsychological tests. Journal of the International Neuropsychological Society, 7, 631-639.
Ashendorf, L., Jefferson, A.L., O’Connor M.K., Chaisson, C., Green, R.C., & Stearn, R.A. (2008). Trail Making Test errors in normal aging, mild cognitive impairment, and dementia. Archives of Clinical Neuropsychology, 23, 129-137.
Brink, T.L., Yesavage, J.A., Lum, O., Heersema, P.H., Adey, M., & Rose, T.L. (1982). Screening tests for geriatric depression. Clinical Gerontologist, 1, 37-43.
Folstein, M.F., Folstein, S.E., & McHugh, P.R. (1975). “Mini-mental state”: a practical method for grading the cognitive state of patients for the clinician. Journal of Psychiatric Research, 12, 189-198. Giovagnoli, A.R., Del Pesce, M., Mascheroni, S., Simoncelli,
M., Laiacanona, M., & Capitani, E. (1996). Trail making test: normative values from 287 normal adult controls. Italian Journal of Neurological Sciences, 17, 305-309.
Hashimoto, R., Meguro, K., Lee, E., Kasai, M., Ishii, H., & Yamaguchi, S. (2006). Effect of age and education on the Trail Making Test and determination of normative data for Japanese elderly people: the Tajiri Project. Psychiatry and Clinical Neurosciences, 60, 422-428.
Ivnik, R.J., Malec, J.F., Smith, G.E., Tanglos, E.G., & Petersen, R.C. (1996). Neuropsychological tests’ norms above age 55: COWAT, BNT, MAE Token, WRAT-R Reading, AMNART, STROOP, TMT and JLO. Clinical Neuropsychologist, 10, 262-278.
Lezak, M.D. (1995). Neuropsychological assessment. New York: Oxford University Press.
Mitrushina, M.N., Boone, K.B., Razani, J., & D’Elia, L.F. (2005). Handbook of normative data for neuropsychological assessment, 2nd edition. New York: Oxford University Press.
Moll, J., Oliveira-Souza, R., Moll, F.T., Bramati, I.E., & Andreiuolo, P.A. (2002). The cerebral correlattes of set-shifting: an fMRI study of the trail making test. Arquivos de Neuropsiquiatria, 60, 900-905. Nitrini, R., Caramelli, P., Bottino, C.M.C., Damansceno, B.P., Brucki,
S.M.D., & Anghinah, R. (2005). Diagnosis of Alzheimer’s disease in Brazil: diagnostic criteria and auxiliary tests-recommendations of
the Scientiic Department of Cognitive Neurology and Aging of the
Brazilian Academy of Neurology. Arquivos de Neuropsiquiatria, 63, 713-719.
Oliveira-Souza, R., Moll, J., Passman, L.J., Cunha, F.C., Paes, F., Adriano, M.V., Ignácio, F. A., & Marrocos, R.P. (2000). Trail making and cognitive set-shifting. Arquivos de Neuropsiquiatria, 58, 826-829. Periáñez, J.A., Ríos-Lago, M., Rodríguez-Sánchez, J.M.,
Adrover-Roig, D., Sánchez-Cubillo, I., Crespo-Facorro, B., Quemada, J.I., & Barceló, F. (2007). Trail Making Test in traumatic brain injury, schizophrenia, and normal ageing: sample comparisons and normative data. Archives of Clinical Neuropsychology, 22, 433-447. Rabin, L.A., Barr, W.B., & Burton, L.A. (2005). Assessment practices
of clinical neuropsychologists in the United States and Canada: a survey of INS, NAN, and APA Division 40 members. Archives of Clinical Neuropsychology, 20, 33-65.
Reitan, R.M. (1992). Trail Making Test: manual for administration and scoring. Tucson, AZ: Reitan Neuropsychology Laboratory. Spreen, O., & Strauss, E. (1998). A compendium of neuropsychological
tests: administration, norms, and commentary, 2nd edition. New York: Oxford University Press.
Stuss, D.T., Bisschop, S.M., Alexander, M.P., Levine, B., Katz, D., & Izukawa, D. (2001). The Trail Making Test: a study in focal lesion patients. Psychological Assessment, 13, 230-239.
Stuss, D.T., Stethem, L.L., & Poirier, C.A. (1987). Comparison of three tests of attention and rapid information processing across six age groups. Clinical Neuropsychologist, 1, 139-152.
Tombaugh, T.N. (2004). Trail Making Test A and B: normative