A DESCRIPTIVE ANALYSIS OF THE SEASONAL VARIATION OF PHYSICAL
OCEANOGRAPHIC CHARACTERISTICS IN THE NORTHERN REGION OF THE
TODOS OS SANTOS BAY (BAHIA, BRAZIL)
Luiz Bruner de Miranda1, Ilson Carlos Almeida da Silveira, Felipe Pires Alvarenga Fernandes, Leandro Ponsoni and Thiago Podadera Costa
Instituto Oceanográfico da Universidade de São Paulo (Praça do Oceanográfico, 191, 05508-120 São Paulo, SP, Brasil)
1E-mail: [email protected]
A
B S T R A C TThe results obtained in the August and December 2003, August 2004 and January 2005 oceanographic campaigns in the northern region of the Todos os Santos Bay (lat. 12o44.5’S; long. 038o35.00’W) between the Madre de Deus and Maré islands are analyzed. Instruments of continuous and discrete samplings were used to measure hydrographic properties currents and tides. The water mass of the northern region of the bay is forced by semidiurnal and mesotides of form number 0.08 and the lunar component M2 height was estimated at 91cm. The time series of the surface currents indicated movements in the N/S direction, forced by the tide with maximum magnitudes of 0.73 m.s-1 on the December 2003 campaign. However, in August 2004 the currents were dominated by the wind stress forcing, with a maximum speed of 1.85 m.s-1 and SE direction. Near the bottom, the influence of the tide is not as evident, with a decrease in intensity due to internal and bottom friction, with a maximum velocity of 0.17 m.s-1. The thermal and haline structures were weakly horizontally, as well as vertically stratified, with extreme values varying in the intervals 23oC (August, 2004) to 28oC (December, 2003) and 31.0 psu (August, 2003) to 36.0 psu (December, 2003), respectively. Some conclusions may be drawn from these results: i) The signs of the dilution of the fresh water discharges of the Caípe, Mataripe and São Paulo rivers in the region under the influence of the RLAM were observed only during the winter periods, but in the summer the region was flooded by waters of oceanic origin and the salinities above 36.0 indicated TW mass intrusion; ii) The N-S circulation near the RLAM is strongly dominated by the tide, and the importance of the M2 component was unequivocal, however, the E-W component presented some tidal modulation away from abrupt bottom topographical changes, and iii) The residual series, calculated as the difference between the original and modeled, is about ¼ of the original and confirmed its semidiurnalcharacter.
R
E S U M OResultados obtidos em campanhas oceanográficas realizadas em agosto e dezembro de 2003, agosto de 2004 e janeiro de 2005 na região norte da Baía de Todos os Santos (lat. 12o44.5’ S e long. 038o35.00’ W) entre as ilhas Madre de Deus e Maré são analisadas. Instrumentos com amostragem discreta e contínua foram utilizados para medidas das propriedades hidrográficas, correntes e marés. A massa de água da região norte da baía é forçada por maré semidiurna e mesomaré com número de forma 0,08 e altura da componente M2 próxima a 0.91 m. A série temporal das correntes de superfície indicaram movimentos na direção N/S, com intensidades de até 0,73 m.s-1 em dezembro de 2003. Entretanto, em agosto de 2004 as correntes foram dominadas pela tensão de cisalhamento do vento atingindo intensidade máxima de 1,85 m.s-1 no sentido SE. Nas proximidades do fundo a influência da maré não foi muito evidente, com a intensidade decrescendo até cerca de 0.17 m.s-1 devido ao atrito interno e de fundo. Os campos de temperatura e de salinidade foram fracamente estratificados tanto vertical como horizontalmente, com valores extremos nos intervalos de 23oC (agosto de 2004) a 28oC (dezembro de 2003) e 31.0 ups (agosto de 2003) a 36.0 ups (dezembro de 2003), respectivamente. Desses resultados seguem as conclusões: i) A diluição gerada pela descarga de água doce dos rios Caípe, Mataripe e São Paulo na região sob influência da RLAM foram observadas somente nos períodos; inverno, e no verão a intrusão de águas de origem oceânica com salinidades maiores do que 36.0 indicaram a intrusão da massa de Água Tropical; ii) A circulação N-S próximo à RLAM foi dominada fortemente pela maré, sendo a importância da componente semidiurna M2 muito clara; entretanto, a circulação na direção E-W somente apresentou alguma modulação da maré longe das variações abruptas da topografia do fundo; iii) As diferenças da série residual da maré, calculadas pelas alturas da série original subtraídas das séries modeladas, foram, cerca de ¼ das originais, confirmando sua característica semidiurna. Descriptors: Hydrographic properties, Currents, Tides, Spatial distribution, Temporal variations, Harmonic analysis.
I
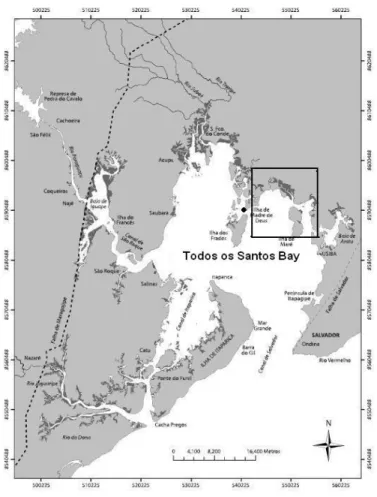
NTRODUCTIONThe Todos os Santos Bay (TSB) (Fig. 1) is located in the vicinity of the city of Salvador and on it is to be found the largest petrochemical complex in the southern hemisphere (Camaçari Petrochemical Center). The commodity exporting ports of Aratú and Salvador and several maritime terminals are also situated on the bay. Relevant publications on the oceanographic characteristics of the bay are: that on the former analysis of the data on suspended material by Wolgemuth et al. (1981), the description of its thermohaline properties by Barreto and Paredes (1995) and of the barotropic modeling of its circulation and dispersion characteristics by Montenegro et al. (1999), and more recently those by Cirano and Lessa (2007) and Lessa et al. (2009).
Additional results were released by Lessa etal. (2001) who analyzed a data set of tide heights and current measurements obtained from the National Bank of Oceanographic Data of the Hydrography and Navigation Directory (BNDO). However, although these measurements are also mainly concentrated to the western region and to the south of the dos Frades Island (Fig. 1), the authors identified the existence of tide measurements within the TSB and in the adjacent coastal region, although most of them were of short duration. In that study, the bimonthly modulation of the tide is evident, as also is the fact that the propagation of the tidal wave up to the Paraguaçu Channel is hypersynchronous, amplified by a factor of 1.5 in relation to the tide at the entrance of the bay. The current measurements, taken during spring tide, indicated a small vertical shear, consistent with the almost homogeneous characteristics of the water column.
A data set of meteorological observations, thermohaline properties, tidal heights and currents sampled at several stations during wet and dry seasons was subjected to further analysis by Cirano and Lessa (2007) with the following principal results: the TSB circulation is mainly tidally with no significant variation during the year; ii) during the summer the water masses in the bay present oceanic characteristics with the TW (S>36.0 o/
oo in deep water) penetrating throughout the bay, except at the mouth of the Iguape Bay in the NW region of the bay where salinities lower than S= 32.0 o/
oo are found (GENZ, 2006), with temperatures reaching 30oC, about 3.0oC higher than those of the water masses of the coastal zone. In the winter time, due to the increase in the fresh water input, salinities in the bay can be as low as 32.3 o/
oo). The cotidal lines show a progressive amplification and delay of the semidiurnal M2 component, characterizing hypersynchronous wave propagation. The most comprehensive literature review and presentation of knowledge on the climatology, hydrology, thermohaline properties, forcing mechanisms and circulation of the TSB, particularly in some important sectors or those impacted by the local urban and industrial development, is presented in the recent publication of Lessa et al. (2009).
It has been noted, in the light of the above-mentioned studies, that the data on the hydrographic properties and circulation were not obtained on a seasonal time scale and that the spatial coverage was concentrated on the area to the west and south of Frade Island (IF) and on the Paraguaçú Canal (CP), stretching up to the Iguape Bay (GENZ, 2006).
The study area is located in the northern region of the TSB, between the Madre de Deus (MDI) and Maré islands (MI) (Fig. 1). This region receives the discharges of the Caipé, Mataripe and São Paulo rivers located in the north-eastern part of the northern TSB, named Sector_3, with a small fresh water discharge varying between the extreme mean values of 5.9 m3.s-1 and 1.18 m3.s-1 with an annual mean of 4.20 m3.s-1 (LESSA et al., 2009). Also, during the experiments, two control regions were created located, respectively, in the Caboto (TSB) Embayment and Camamu Bay (BC) to the south. The present study was conducted within the scope of the Program of Environmental Monitoring of the Estuarine Ecosystem in the area affected by the Landulpho Alves Refinery – PROMARLAM (a joint PETROBRÁS-CENPES/IOUSP project). The main objective of this article with its analysis of the data collected on the thermohaline properties, velocity and tides is to expand our knowledge of the oceanographic characteristics of the northern reaches of the TSB.
M
ATERIAL ANDM
ETHODSThe tide heights were digitally registered by an Aanderaa tidal pressure gauge, installed in the “TRANSPETRO” dock on the Madre de Deus Island (lat. 12o45.4’S; lat. 038o37.4’W Fig. 1) from August 2003 to January 2004. The equipment was set to register relative pressure data at the same time interval as the mooring’s current measurements (∆t=30 min). The pressure values were converted into heights by means of the conversion equation supplied by the instrument’s manufacturer.
The harmonic analysis, by which the signals of deterministic and astronomic tides are distinguished by inertial signals, was conducted in accordance with Godin (1972), using the Matlab software (Mathworks Inc.) “t_tide.m” (PAWLOWICZ et al., 2002). This routine breaks the sea surface height series down into astronomical and 24 shallow water components. The non-tidal signal is estimated as a function of the deterministic characteristic of the tide and the inertial residue is obtained by subtracting the tide signal calculated by the analysis of the total signal measured. The form number (Nf) used to characterize the tidal periodicity, was calculated in accordance with A. Courtier (DEFANT, 1960), using the ratio between the amplitudes of the main diurnal (K1+O1) and semidiurnal (M2+S2) components.
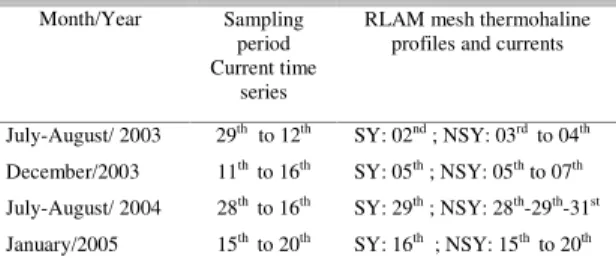
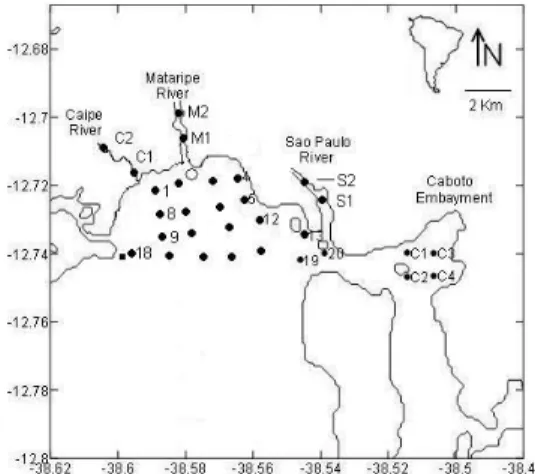
The hydrographical experiments were conducted by means of quasi-synoptic (Fig. 2) and non-synoptic (Fig. 3) samplings in the region between the MDI and MI, called the RLAM mesh which, together with its chronology, is presented in Table 1. The quasi-synoptic sampling at the stations was carried out under both flood and ebb tide conditions.
Table 1. Date sampling chronology of current time series, thermohaline properties and current profiles in the RLAM mesh. SY and NSY denote periods of synoptic and non-synoptic measurements.
Month/Year Sampling period Current time
series
RLAM mesh thermohaline profiles and currents
July-August/ 2003 29th to 12th SY: 02nd ; NSY: 03rd to 04th December/2003 11thto 16th SY: 05th ; NSY: 05th to 07th July-August/ 2004 28th to 16th SY: 29th ; NSY: 28th-29th-31st January/2005 15th to 20th SY: 16th ; NSY: 15th to 20th
obtain data on the hydrographic conditions simultaneously with the actual sampling of the chemical and biological parameters and differed slightly from the synoptic one.
Fig. 2. Geographical location of the oceanographic stations in the RLAM mesh of the quasi-synoptic grid (•) named in alphabetical order and the current meter mooring (black square). Adapted from Pires-Vanin et al. (2010).
Fig. 3. Geographical localization of the oceanographic stations of the non-synoptic grid (•) almost coincident with the synoptic grid, the current meter mooring (black square), the Caipe (C1 and C2), Mataripe (M1 and M2) and São Paulo (S1 and S2) rivers. Adapted from Pires-Vanin et al., 2010.
The current measurements in the quasi-synoptic grid were carried out on profiles, simultaneously with the measurements of hydrographic properties and in the Eulerian form, and the current time series of the mooring near the MDI was used to infer the variability in the circulation near the RLAM.
For the hydrographic and current profiling a current meter/CTD system, model 2D-ACM, of Falmouth Scientific Inc., was used, together with an acoustic velocity sensor, at the stations situated within
the study area (Figs 2 and 3). The equipment was set to measure in situ conductivity (in mS/cm), temperature (°C) and pressure (decibars) converted into salinity by means of the Practical Salinity Scale (PSS-78); the salinity unity psu will be suppressed in reporting the salinity figures. Instantaneous values of the north-south (VN) and east-west velocity components (VE) were measured by the equipment in relation to the local magnetic north (MN). Due to the shallowness of the water column sampled, the compressibility effect of the water was negligible, and the pressure (in decibars) may be numerically related to the depth (z) in meters. Water samples were collected at many stations to monitor the CTD conductivity sensor. These samples were analyzed in the laboratory with an AutoSal salinometer by Guildline standardized with normal water (KCI standard) and were also converted into salinity by the PSS-78.
In order to avoid any influence of the draft of the vessel on the physical properties, especially as regards the direction and intensity of the currents, the measurements along the water column were initiated approximately 1 m below the water surface. Starting at this depth, the profiles were monitored with the pressure sensor until nearing the bottom, with intermediate measurements taken at variable depth intervals according to local depth.
The editing and processing of the hydrographic data were carried out in accordance with the following procedure. The electric conductivity C=C(S,T,p), measured by the instrument in mS/cm, was converted into the Electrical Conductivity Ratio (Rt) using the equation Rt=C(S,T,p)/C(35,15,0)= C(S,T,p)/42.914. This non-dimensional property was converted into salinity (S) by the application of the PSS-1978 Algorithm (UNESCO, 1981; FOFONOFF; MILLARD JR, 1983), using Morgan´s (1994) programmed subroutines.
Simultaneously, measurements of current intensity and direction were carried out from the moored boat and with the instrument held at the depth sampled for 60 seconds. The velocity vectors were broken down in accordance with the orthogonal Cartesian referential Oxy, with the Oy and Ox axes oriented positively to the north and east; the so-called u- and v-velocity components were obtained by the method presented in Miranda et al. (2002). In accordance with UNESCO’s recommendation (UNESCO, 1985) the intensity of the current is expressed in SI units (m.s-1). All the data were submitted to quality control, editing, and processing. Specific programs were developed for this purpose in order to generate discrete values throughout the water column.
synoptic grid were obtained from the interpolation of the observed values into a regular grid. The Objective Analysis Technique (OAT) used is based on the least-squares method and the Gauss-Markov theorem (DAVIS, 1975). For the present gridding we used a weight-function which is the auto-correlation function of interest (CARTER; ROBINSON, 1987). The usual procedure is the adjustment of the auto-correlation function of the data to a theoretical form. In this study we adopted a Gaussian and isotropic form (that is, with isotropic features in the cross-shore and along-shore directions) given by C(r) = (1-ε2) exp(-r2/L2), acting as a strong process of spatial filtering. In the case of the synoptic grid, we used the empirically determined values L=2.75 km and ε2=10-5. Since in the estuarine area the time scales are associated with variability forced, among other agents, by the tidal dynamics, the plotting of the contours involving grid stations, where chemical-biological sampling took place, may lead to mistakes in interpretation due to temporal smoothing. In this case the spatial filtering of the OAT is insufficient to simulate the synoptic sampling mathematically.
During the August 2003, December 2004 and August 2004 campaigns, time series of currents (intensity and direction) were also measured, with current meters (Falmouth; model 2D-ACM, 1370-2D and 1356-2D series) installed on the main branch of a U mooring at lat. 12o44.526’ S and long. 038o34.990’ W (Fig. 2). The nominal depth of the instrument was established at two meters from the surface. These
measurements, taken at 30-minute intervals (∆t=30 min), are representative to characterize surface circulation. On the first campaign (August, 2003), additional current measurements were taken near the bottom. On the January 2005 campaign the mooring position was slightly altered (lat. 02o44.526’ S and long. 038o30.000’ W) in order to evaluate the effect of the topographic shallows in the surroundings of the original position. The method used for the velocity vector breakdown was analogous to that used in the profiles and the time series of the v and u components were processed in the time and frequency domain using harmonic analysis to identify the characteristics of the circulation and its main forcing mechanism.
R
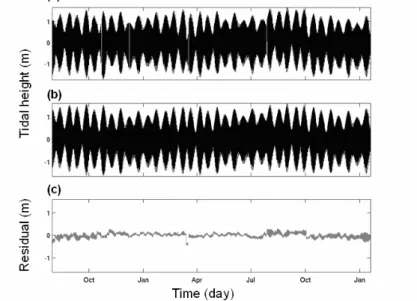
ESULTSTides
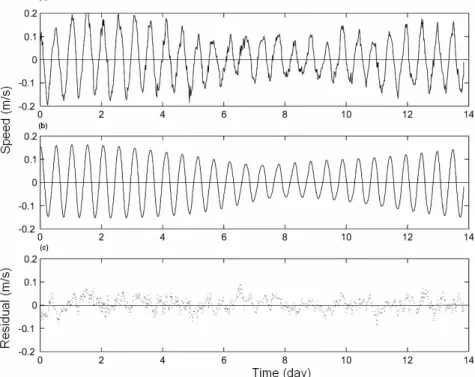
The time series of the tidal heights (Fig. 4a) is presented together with the modeled tide (Fig. 4b) calculated with harmonic analysis and the residual height (Fig. 4c), obtained by subtracting the modeled deterministic tide from the original series.
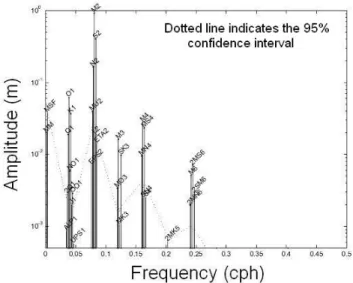
The harmonic analysis parameter was set to resolve the main periodic components with a confidence interval of 95% (Fig. 5). As a result of the analysis it was possible to quantify the semidiurnal character of the tide (Nf=0.08) and conclude that the semidiurnal components M2, S2 and N2 are responsible for nearly 1.5 m of the tidal height.
Fig. 5. Amplitude of the main tidal components harmonically analyzed at a 95% confidence level. Time series from August, 2003 to January, 2005.
July/August 2003
Current Time Series
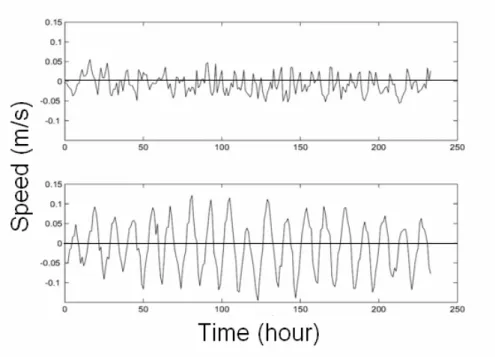
The time series of the transversal (u) and longitudinal (v) components at the surface are presented in Figure 6 a,b. This figure shows that the
u-component is less intense and has a west to east (u>0) and east to west (u<0) orientation with velocities between 0.10 m.s-1and -0.07 m.s-1; the circulation associated with this component does not present a well defined periodicity.
The longitudinal v-velocity component, in turn, has intensities which vary in the interval of –0.20 to 0.20 m.s-1, and shows a notable semidiurnal and fortnightly tidal modulation with distinct high and low intensities in the spring and neap tidal cycles, respectively.
The time series of the transversal (u) and longitudinal (v) components near the bottom are presented in Figure 7. In general, as would be expected, the transversal (u) and longitudinal (v) components are less intense than those on the surface (Fig. 6), varying within the intervals: -0.12 m.s-1 to 0.14 m.s-1 and -0.15 m.s-1 to -0.15 m.s-1, respectively. The comparative analysis of these time series shows
that near the bottom the currents are less influenced by the semidiurnal and the neap to spring tidal (fortnightly) modulation.
In order to investigate the v-velocity time series behavior in the frequency domain to confirm and quantify the fact that the transversal component (v) is dominated by the tidal forcing, the time series was processed by harmonic analysis, just as was done with the tide height time series (Fig. 5). The results are presented in Figure 8 and the dominance of the semidiurnal tide component M2 as the main forcing mechanism of the v-velocity component in the north region of the TSM is clearly seen.
Fig. 8. Amplitude of the harmonically analyzed constituents, at the 95% confidence level, for the v-velocity component of the August 2003 Campaign (07/29-08/12/2003). Amplitude in m.s-1.
The original time series (a), the theoretical heights determined by harmonic analysis (b) and the residual time series (c) are presented in Figure 9. The comparison of the original time series with the modeled one allow the visualization and the understanding of its spectrum in the frequency domain (Fig. 8). It must be emphasized that the residual series still presents strong evidence of tidal cycle periodicity. This is to be expected due to the short length of the series (15 days) which only allows for the “extraction” of the M2 by harmonic analysis. It is however necessary to state in Figure 8 that this semidiurnal tidal component has the highest significant amplitude at the 95% confidence interval.
Hydrography and Currents
The results of the edited data regarding hydrography (salinity and temperature) and currents (intensity, direction and v and u components), which represent the environmental characterization of the area sampled, are presented to the RLAM mesh in the nearly synoptic grid sampling during the rising and ebbing tides, as well as to the non-synoptic grid .
As described in the methodology, in order to trace the structure of the horizontal property field, the OAT analysis method was used to minimize the
percentage error committed while delineating the isolines.
The characterization of the salinity and temperature fields at the surface and near the bottom in the nearly synoptic sampling are presented in Figures 10 and 11 and Figures 12 and 13 for thefloodingand ebbing periods, respectively.
The distributions of salinity and temperature presented variations between 31.0 and 33.0 and 25.0oC and 26.5oC, respectively, with negative and positive gradients delimited in the NE orientation; lower (higher) values of salinity (temperature), on the surface as well as near the bottom, are found in the extreme northeast of the synoptic mesh and are associated with riverine discharge. The most intense gradients are found at the surface during both flooding and ebbing. The presence of more saline waters during the ebbing periods exhibits the initial scenario of the retraction of the penetration of marine waters, whose maximum was attained during the period of slack water (see the distribution of the isohalines of 32.0 in the panels in Figs 12 and 13). The horizontal distributions of salinity for the flooding period show a greater participation of waters of lower salinity and, therefore, greater continental influence. The isohaline of 32.0, for example, occupies a more central position in the area sampled.
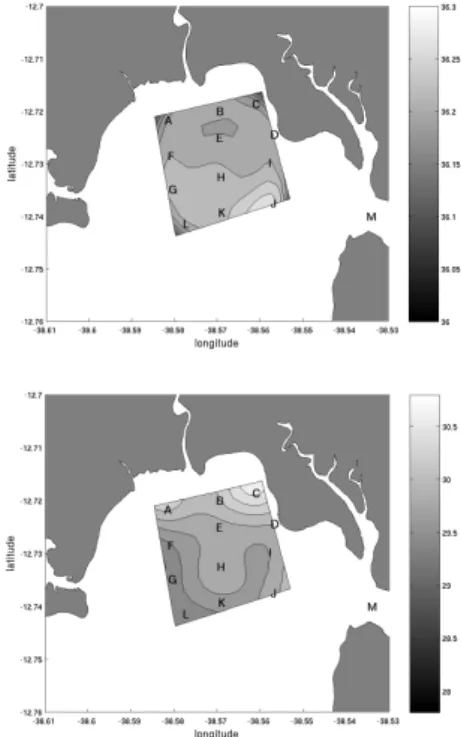
Fig. 10. Distribution of salinity (upper) and temperature (oC) (lower) at the surface (flooding). Sampling of August 2nd, 2003.
Fig. 11. Distribution of salinity (upper) and temperature (oC) (lower) near the bottom (flooding). Sampling of August 2nd, 2003.
Fig. 12. Distribution of salinity (upper) and temperature (oC) (lower) at the surface (ebbing). Sampling of August 2nd, 2003.
December 2003
During this period of observation, a single current meter, whose operation started for technical reasons the 11th day, was moored near the surface. Its time series is presented in Figure 14.
While the transversal movement (component u) did not present a very evident periodic signature, the longitudinal movements (component v), whose intensities varied between the extremes –0.15 m.s-1 and 0.12 m.s-1, presented a noteworthy semidiurnal modulation of the tide. We observed evidence of modulation of the intensity of the currents associated with the spring and neap tides, despite the brevity of the series.
On this second campaign, the vertical structure of the hydrographic properties presented weak vertical stratification in the region investigated, during both the flood and ebb tides. The temperatures observed are about 3.0oC to 4.0oC higher than those observed on the August, 2003 campaign. However, the biggest differences are to be found in the salinity values which are above 36.0 at all the stations, evidencing strong marine influence. This salinity value indicated
intrusion of the Tropical Water mass into the bay, right up to its northern region.
Figures 15 to 18 present the horizontal distributions of salinity and temperature in the synoptic grid of the RLAM mesh, obtained by the OAT analysis method. The interpolation parameters used on the August 2003 campaign were also used in the computation in order to obtain the temperature and salinity fields. The salinity distributions are typically between 36.0 and 36.2. Gradients are subtle and reflect a virtually isohaline condition. The higher values found at station M induce a slight variation in the extreme northeast of the synoptic grid. The values of oceanic salinity suggest a decrease in the riverine discharge in the region affected by the RLAM during the summer period sampled. The temperature distributions however exhibit values between 28.8oC and 30.6oC. The temperature gradient is also different from that obtained on the August, 2003 campaign: it obeys a predominantly south-north orientation, higher values being associated with shallower regions, probably induced by solar radiation over more exiguous water columns. The slightly higher temperature values during ebb tide are due to the fact that the sampling occurred later in the day.
Fig. 15. Distribution of salinity (upper) and temperature (oC) (lower) at the surface (flooding). Sampling of December 05th, 2003.
Fig. 16. Distribution of salinity (upper) and temperature (oC) (lower) near the bottom (flooding). Sampling of December 05th, 2003.
Fig. 17. Distribution of salinity (upper) and temperature (oC) (lower) at the surface (ebbing). Sampling of December 05th,2003.
There are no notable differences between the distributions obtained for the flood and ebb tide periods. This is a consequence of the clear prevalence of waters of marine origin over those of continental origin.
July/August 2004
The time series of the transversal (u) and longitudinal (v) components at the surface, where the movements do not present the expected tidal modulation seen on previous campaigns, are presented in Figure 19.
The u component has an east to west (u>0) and a west to east (u<0) orientation, its maximum intensities being between 0.59 m.s-1 and 0.07 m.s-1. The longitudinal movements (v-component) have intensities which vary between the limiting values of – 0.52 m.s-1 and 0.03 m.s-1.
On the previous campaigns, the transversal component was widely dominated by the tide (Figs 8 and 9). However, on this campaign there was no such domination, as is confirmed by the harmonic analysis (Fig. 20).
Figure 21 exhibits the original, the modeled deterministic and the residual time series. The comparison between the original and modeled series consists of the visualization of the spectrum in the frequency domain (Fig. 20). It must be emphasized that the residual series is practically the same as the original ones, showing very little evidence of periodicity. This was unexpected since in previous campaigns it was possible, even in short time series such as this one, to observe the dominance of the semidiurnal tidal component M2 in the frequency domain (Fig. 8). Such a result, very different from the others, may be a consequence of the passage of cold fronts across the region during the period sampled, due to the wind stress forcing and meteorological tides.
Fig. 20. Harmonic analysis of the amplitude, at a confidence level of 95%, of the v-velocity component (N-S) of the July/August 2004 (07/28 to 08/15) campaign. Amplitude in m.s-1.
Fig. 21. Original time series (a), harmonically modeled (b) and residual (c) of the longitudinal velocity component v of the August, 2004 (07/28 to 08/15) Campaign. Amplitudes in m.s-1.
The thermohaline field characterizationat the surface and near the bottom for the flooding and ebbing periods are presented in Figures 22 and 23, and Figures 24 and 25, respectively.
Fig. 22. Distribution of salinity (upper) and temperature (oC) (lower) at the surface (flooding). Sampling of July 29th, 2004.
Fig. 23. Distribution of salinity (upper) and temperature (oC) (lower) near the bottom (flooding). Sampling of July 29th, 2004.
Fig. 24. Distribution of salinity (upper) and temperature (oC) (lower) at the surface (ebbing). Sampling of July 29th, 2004.
The lower/higher values of salinity/ temperature at the surface, as well as near the bottom, are found in the extreme northeast of the synoptic grid and the area associated with riverine discharge (solar radiation input). The most intense gradients are found at the surface, during both flood and ebb tides. The presence of more saline waters during the ebbing periods exhibits the initial scenario of the retraction of the penetration of marine waters, whose maximum was attained during the period of slack water (see the distribution of isohalines of 32 in the panels in Figs 24-25) The horizontal distributions of salinity for the flooding period show a greater participation of less saline waters and, therefore, a higher input of fresh water discharge.
January 2005
The mooring during this period consisted of a single current meter located near the sea surface, though with a slight modification in its position. This modification was made in order to permit observation of the currents generated by the tide at a distance from the bathymetric shallows of the previous position of the three initial campaigns.
Figure 26 presents the current time series of the u and v-velocity components. The transversal currents (u component) have almost the same intensities as the longitudinal ones (v-component). Their maximum velocities are between 0.09 m.s-1 and –0.08 m.s-1 and 0.13 m.s-1 and –0.12 m.s-1, respectively.
The transversal and longitudinal circulation present very evident periodic signatures: a noteworthy semidiurnal modulation of the tide, despite the brevity of the series, is clearly to be seen. The east-west component also indicates the importance of the diurnal component.
Examination of the figure (Fig. 26) reveals that both current components are largely dominated by the tide. In order to confirm and quantify this influence, the time series was also subjected to harmonic analysis, just as in the August 2003 and 2004 time series, so that the analysis might be performed in the frequency domain. However, it was used in the complex form so as to present the velocity analysis of both components together. The results are presented in Figure 27 and the dominance of the semidiurnal (M2) and the diurnal (K1) components forcing in the velocity field is clear.
Fig. 27. Amplitude of the complex harmonic analysis of constituents, at a 95% confidence level, for the u and v-velocity components during the January 2004 (01/15-01/20) period. Amplitude in m.s-1.
The salinity distributions in the RLAM mesh area (Figs 28 - 31) present values typically between 35.3 and 36.2. Gradients are subtle and reflect a virtually isohaline structure. The temperature distributions also exhibit almost isothermal conditions from 28.7oC to 29.9oC. The horizontal temperature distribution, with slightly more marked north-south gradients, probably being the signature of diurnal heating in the shallower regions of the bay.
D
ISCUSSIONThe northern region of the Todos os Santos Bay is dominated by semidiurnal tides. The form number, determined on the basis of the tide harmonic analysis, was calculated at 0.08, and is within the interval (0.04-0.11) obtained in previous studies (LESSA et al., 2001).
The time series of Eulerian current measurements in the bay near the RLAM indicated that in the August 2003, December 2003 and January 2005 Campaigns, the transversal movements (u-component) on the surface are less intense (between
Fig. 28. Distribution of salinity (upper) and temperature (oC) (lower) at the surface (flooding). Sampling of January 16th, 2005.
Fig. 29. Distribution of salinity (upper) and temperature (oC) (lower) near the bottom (flooding). Sampling of January 16th, 2005.
Fig. 30. Distribution of salinity (upper) and temperature (oC) (lower) at the surface (ebbing). Sampling of January 16th, 2005.
On the January 2005 campaign, a new location was tested in order to verify the influence of the bottom topography on the circulation in the RLAM bay. The mooring was cast further from the topographic shallow or sandbank. The result was that, away from the shallows, the flow was dominated by the tide, also in the east-west orientation. The velocity isotropy was also verified, both components having similar magnitudes. This experiment illustrates the importance of topography for flow in estuarine regions - as has been investigated in classical articles, such as that by Dyer (1977).
The time and salinity distributions reveal a greater influence of continental water discharges during the winter. The surface and bottom salinities varied basically from 31.0 to 33.0. During the summer however, the values are typically situated between 36.0 and 36.2 at practically all the sampling stations and these high values indicate that the intrusion of the Tropical Water mass reaches the northern part of the TSB. These results are in close agreement with those of the pioneering works of Wolgemuth et al. (1981), Barreto and Paredes (1995) and the more recent ones of Cirano and Lessa (2007) and Lessa and Cirano (2009).
The temperature and salinity values presented averages for the interpolated values obtained by the Objective Analysis Technique and their respective absolute maximum and minimum. Despite their simplicity, the August 2003/2004 and December 2003/January 2004 campaigns seem typically to represent the winter and summer periods, since the mean values of these campaigns at the stations are very close to each other.
The river discharge input induces a negative gradient in the NE direction during the winter, and weaker gradients in the opposite direction during the summer. The temperature fields are less evident in terms of tracing continental water input into the bay. The temperature maps during the winter period presented greater areas which coincided with the salinity minima associated with the riverine discharge. However, for the summer periods the thermal gradient is predominantly in the N-S direction with the highest temperatures near the coast. Such a distribution is the result of the solar heating of the water of marine origin in shallower regions.
The seasonal behavior, which alternates between an estuarine regime in the winter and water of oceanic origin during the summer, has recently been described by Cirano and Lessa (2007). These oceanic waters have the characteristics of the Tropical Water found adjacent to the continental shelf break but which penetrated the Todos os Santos Bay during the summer.
Based
On the seasonal samplings taken in the present study we may establish that:
1. The dilution promoted by the fresh water discharges of the Caípe, Mataripe and São Paulo rivers in the estuarine water of the region under the influence of the RLAM was observed only during the winter periods. In the summer, the region was flooded by waters of oceanic origin and the salinities higher than 36.0 indicate the intrusion of the Tropical Water mass into the Bay;
2. The water column was well mixed vertically throughout the year. Even during the summer, no vertical stratification was observed at any of the oceanographic stations sampled, due to the low input of fresh water;
3. The circulation in the bay, near the RLAM, is, in fact, strongly dominated by the tide. The importance of the M2 constituent is particularly unequivocal. The limited extension of the current series of each campaign prevents a more accurate analysis of the record. However, at least 70% of the variation of the longitudinal velocity component is explained deterministically by the tidal phenomenon. The transversal component, on the other hand, only presented this modulation when the mooring was placed in deeper waters and away from abrupt bottom topographical changes;
4. The tide time series of nearly two years allowed for the separation (in a statistically significant way) of several tide components. The residual series, calculated as the difference between the original and modeled series, is about ¼ of the original. The tide height time series also provided the confirmation of the semidiurnal aspect of the local tide with a form number of 0.08;
5. Based on the present sampling period there seems to be a certain influence of the meteorological tide during the August 2004 campaign, which masked the tidal circulation pattern. This result, however, is only speculative since no simultaneous meteorological data were available.
A
CKNOWLEDGMENTSR
EFERENCESBARRETO, M. A. S.; PAREDES, J. F. Estudos hidrodinâmicos no estuário do Rio Paraguaçu. Ciência e Tecnologia. Brasília, DF: CPRM, 1995. N. 5, p. 46-51.
CARTER, E. F; ROBINSON, A. R. Analysis models for the estimation of oceanic fields, J. atmos. ocean.
Technol.,v. 4, n. 1, p. 49-74, 1987.
CIRANO, M.; LESSA, G. C. Oceanographic characterístics of Baía de Todos os Santos, Brazil. Rev. Bras. Geofis.,
v. 25, n. 4, p. 363-387, 2007.
DAVIS, R. E. Predictability of sea surface temperature and sea level pressure anomalies over the North Pacific Ocean, J. phys. Oceanogr., v. 9, p. 724-738, 1975.
DEFANT, A. Physical Oceanography. Oxford: Pergamon
Press, v. 2, 1960. 598 p.
DYER, K. R. Lateral circulation effects in estuaries.
Estuaries. Geophysics and the environment. Washington, D.C.: National Academy of Sciences, 1977. p. 22-29. FOFONOFF, N.; MILLARD JR, R. C. Algorithms for
computation of fundamental properties of seawater.
Unesco tech. Pap. mar. Sci., n. 44, 1983. 53 p. GENZ, F. Avaliação dos efeitos da Barragem Pedra do
Cavalo sobre os efeitos da circulação estuarina do rio Paraguassú e Baía de Iguape. 2006. 266 p. Tese
(Doutorado)- Programa de Pós-Graduação em Geologia da Universidade Federal da Baía, 2006.
GODIN, G. The Analysis of tides. Toronto: University of Toronto Press, 1972. 264 p.
LESSA, G. C.; DOMINGUEZ, J. M. L.; BITTENCOURT, A. C. S. P.; BRICHTA, A. The Tides and tidal circulation of Todos os Santos Bay, Northeast Brazil: a general characterization. An. Acad. Bras. Ciên., v. 73, n. 2, p. 245-261, 2001.
LESSA, G. C.; CIRANO, M.; TANAJURA, C. A. S.; SILVA, R. R. Oceanografia Física. In: HATJE, V. ; ANDRADE, J. B. DE. (Org.). Baía de Todos os Santos: aspectos oceanográficos. Salvador, EDUFBA, v. 1, p. 68-119, 2009.
MIRANDA, L. B.; CASTRO, B. M.; KJERFVE, B.
Princípios de Oceanografia Física de estuários. São Paulo: EDUSP, 2002. 424 p. (Acadêmica 42). MONTENEGRO, A. M.; FONSECA, C. A.; CAMPOS, E. J.
D. Implementação do modelo oceânico da Universidade de Princeton para estudo da circulação e dispersão de materiais na Baía de Todos os Santos. Ciên.biol. Meio Amb., v. 2, n. 2, p. 10-18, 1999.
MORGAN, P. P. Seawater: A Library of MATLAB computational routines for the properties of sea water. –
CSIRO mar. Labs. Australia Rept., ver. 1.2, 222, 29
p., 1994.
PAWLOWICZ, R., R.; BEARDSLEY, R.; S. LENTZ Classical tidal harmonic analysis including error estimates using T_TIDE. Computers, Geosciences , v. 28, p. 929-937, 2002.
UNESCO. The International System of Units (SI) in Oceanography. Unesco tech. Pap. Mar. Sci. IAPSO,
Publ. Scient., Paris, n. 32, 124 p., 1985.
WOLGEMUTH, K. M.; BURNETT, W.C.; MOURA, P. L. Oceanography and suspended material in Todos os Santos Bay. Rev. Bras. Geociênc., v. 11, n. 3, p.
172-178, 1981.
Sources of Unpublished Material
XAVIER, A. G. Análise hidrodinâmica da Baía de Todos os Santos. 2002. 222 p. Tese (Doutorado) - Programa de Pós-Graduação em Engenharia, Universidade Federal do Rio de Janeiro, 2002.