Article
Printed in Brazil - ©2017 Sociedade Brasileira de Química0103 - 5053 $6.00+0.00*e-mail: [email protected]
AC Induced Corrosion of Underground Steel Pipelines under Cathodic Protection:
III. Theoretical Approach with Electrolyte Resistance and Double Layer
Capacitance for Mixed Corrosion Kinetics
Ibrahim Ibrahim,a,c Michel Meyer,b Hisasi Takenouti*,c,d and Bernard Tribolletc,d
aAl-Andalus University, Tartus, Al Qadmus, Syria
bENGIE, formerly GDFSUEZ, 361 avenue du Président Wilson,
93211 Saint Denis La Plaine, France
cSorbonne Universités, UPMC Univ Paris 06, UMR 8235,
Laboratoire Interfaces et Systèmes Electrochimiques (LISE), 75005 Paris, France
dCNRS, UMR 8235, LISE, Case 133, 4 place Jussieu, 75005, Paris, France
In this series of papers, AC induced corrosion of steel pipe under cathodic protection was investigated. In this Part III, the most realistic model was devised, i.e., the cathodic current was composed of the reductions of dissolved oxygen partly controlled by diffusion and of the water following the Tafel law. The cathodic protection potential necessary to mitigate the corrosion for various AC amplitudes were evaluated. In this modeling approach, no change of soil properties due to AC corrosion is considered. Mean DC values of corrosion potential shift and the corrosion current density in presence of AC signal were calculated in reduced scale making possible field applications by introducing an appropriate set of corrosion kinetics parameter collected without AC signal. In a highly corrosive soil, the reduction of dissolved oxygen is slow compared with that of the water reduction, and then the corrosion behavior becomes similar to the case examined in Part II.
Keywords: electrolyte resistance, double layer capacitance, faradaic rectification, digital simulation, mixed corrosion kinetics
Introduction
In this series of papers,1,2 AC enhanced corrosion (or simply AC corrosion) of underground steel structures under the cathodic protection was investigated by modeling and digital simulations. In Part I,1 the case where these pipes are located in a highly electrical conducting soils, i.e., the electrolyte resistance is negligibly small, was considered. In contrast, more realistic cathodic process than other publications in the literature was dealt with.3,4 The cathodic reaction may follow a Tafel law corresponding to the reduction of water or may be composed of two reactions, the reduction of dissolved oxygen with partially diffusion limited process together with the reduction of water.1,5 The former model involves two tafelian reactions, one for anodic dissolution of steel and another one for the cathodic process, then this corrosion mechanism was named the bi-tafelian.1-4 The latter involves three reactions, then this corrosion
mechanism was called the three reaction mechanism.1 Very recently, Ghanbari et al.6 published a similar subject combining experimental results and modeling approach with three reaction mechanism. We will discuss this new insight later on.
In this part, we will study the AC corrosion of three reaction corrosion mechanism where the electrolyte resistance RE was no longer neglected as this was the case for bi-tafelian mechanism.2 When R
potential Ecorr,0. At higher cathodic potentials (more negative potentials) the reduction of the water becomes the major process. In this paper, as it was the case in Part II,2 two cases were examined; one in a mildly corrosive soil with relatively low corrosion current density, Icorr,0, in absence of AC voltage, and another in a highly corrosive soil with Icorr,0 significantly higher than the diffusion limiting current density of the dissolved oxygen ILIM.
The complete model, without any approximation is thus presented in this Part III. As explained in Part I,1 the enhancement of the corrosion current density is due to the faradaic rectification as consequence of nonlinear property of the current-potential characteristics.1,3-5 Except the reference quoted above,6 no such complete system has been reported in the literature, besides we didn’t find analytical solution of the mathematical model describing the AC enhanced corrosion. Digital simulations were consequently used as it was the case for Part II.2
Methodology
Reaction model and methodology
It is worth to recall that, as mentioned in Part I,1 the underground steel pipe is covered with a thick organic coating, and the corrosion protection is completed by the cathodic protection. It is postulated, as in Part I for the sake of simplification on theoretical approach, that the effect of stray AC signal is limited to its kinetic effect, and no side effect such as the modification of soil chemistry close to coating defect will take place. The polarization curves in presence of AC signal will be also collected experimentally in a manuscript under preparation for experimental results. Then side effects such as the modification of local pH at the very vicinity of the electrode surface induced by enhanced cathodic current will be measured experimentally and discussed. The validity and the limit of simplification hypotheses used in this paper will then be discussed together with experimental observations.
Let the cathodic protection potential U0 (V) in presence of AC signal of the peak amplitude ∆U (V) and the angular
frequency ω (rad s-1), the overall applied potential U at a certain distance from the delaminated area with a reference electrode can be expressed as:
U = U0 + ∆Usin(ωt) (1)
In the corroding system where the electrolyte resistance RE (for the geometrical unit surface of delaminated area,
Ω cm2) is no longer considered negligible, then the applied potential U, and the effective potential E (V) at the electrode
interface are different due to the ohmic potential drop term, REI.
E = U – REI (2)
where I is the current density (A cm-2) flowing across the electrode interface.
The anodic reaction can be assimilated to the dissolution of iron:
Fe → Fe2+ + 2e– (3)
Its reaction rate in terms of the faradaic current density IF,a (A cm-2) will then be expressed with respect to the interface potential E and the corrosion current density Icorr (A cm-2) by:
IF,a = Icorrexp[ba(E – Ecorr)] (4)
where ba (V-1) is the Tafel constant for the anodic reaction. As mentioned above, the cathodic reaction is constituted of two components; one for the reduction of the dissolved oxygen:
O2 + 2H2O + 4e–→ 4OH– (5)
Since the concentration of dissolved oxygen is rather low, this reaction may be partly controlled by the diffusion, often called the mixed kinetics. Let the limiting current density determined by the concentration of oxygen in the bulk solution ILim (A cm-2) and the reaction rate without any mass transfer effect of oxygen, I∞(A cm-2), the cathodic current density IF,c,O2 (A cm
-2) can be calculated by Levich-Koutecky relationship:7
(6)
The diffusion limiting current density is expressed as:
(7)
where F, DO2, C∞, C0, and d stand, respectively, Faraday
(96485 A s mol-1), diffusion coefficient of the dissolved oxygen (ca. 2 × 10⁻⁵ cm2 s-1 at room temperature), concentration of the dissolved oxygen in the solution bulk (2 × 10⁻⁷ mol mL-1 at saturation), and the thickness of diffusion layer (cm).
(8)
I0,O2 represents the current density (A cm
-2) of the oxygen reduction reaction at E = 0 with respect to any reference electrode.
The second cathodic reaction is the reduction of water molecules themselves:
2H2O + 2e–→ H2 + 2OH– (9)
Reaction 9, from the thermodynamic viewpoint will take place at more cathodic potential, and can be expressed as:
(10)
where I0,H2O represents the current density (A cm
-2) of the water reduction reaction at E = 0.
It is considered that both the current for the dissolved oxygen and that for the water reductions are purely additive, then we can write the fractional contribution of the water reduction Icorr,0,H2O to the total free corrosion current as:
(11)
According to this definition λ is dimensionless, and
values 0 ≤ λ≤ 1. Note that for the bi-tafelian corrosion
mechanism presented in Part II,2λ = 1 because the reduction of dissolved oxygen was neglected. Another determining parameter for the cathodic process is the ratio RL, Icorr,0 over the diffusion limiting current of dissolved oxygen ILim. The reduction of dissolved oxygen is considered to be controlled partly by the diffusion. Then, the ratio of the corrosion current density over the diffusion limiting current ILim defines RL.
(12)
Since Icorr,0 is positive whereas ILim is negative, RL is dimensionless negative value.
The potential-current relationships given above were expressed with the interface potential E and current density without AC signal. In the presence of the electrolyte resistance RE, the ohmic potential drop term should be corrected according to equation 2, and the current with the faradaic rectification induced by AC signal. As a whole, the final equation to be solved, for the three reaction corrosion mechanism can be expressed, after several mathematical treatments, as follows:
(13)
T h e t h i r d t e r m i n t h e s q u a r e b r a c k e t (λexp(bc,H
2O(E(t) – Ecorr,0) corresponds to the current for
the water reduction. The denominator D allows determining the effect of the diffusion process to the oxygen reduction reaction, and expressed as follows:
(14)
In equation 13, Cd stands for the double layer capacitance, and CddE(t)/dt, the first term in the curly bracket, describes the current for the charging of this capacitance. Substituting D expressed in equation 14, equations 13 was resolved by means of Mathematica software with the ordinary differential equation.8 For this sake, built-in function of Mathematica “ParametricNDSolveValue[expression]” was called. This function gives the value of expr with functions determined by a numerical solution to the ordinary differential equation.8 The equation used for model calculation by Ghanbari et al.6 (equations 15 and 16) are the same to ours except for some misprints. It is worth to recall that equations given in Appendix A in their article are correctly written.
Results and Discussion
We will present the results of digital simulation for AC corrosion enhancement of steel-pipe under cathodic protection in a mildly and a highly corrosive soils. Then, these simulated data will be compared with the experimental data given by Ghanbari et al.6
Case 1: corrosion in a mildly corrosive soil
in a stagnant aqueous solution saturated of air. The Tafel constant bc,O2 was fixed arbitrarily equal to bc,H2O as Part I of
this paper1 to make the calculation easier, and corresponds to the Tafel slope of −0.12 V per decade. The values of these parameters are fixed on the basis of data collected in laboratory and field experiments by the research group of Engie company (former French gas authority).
Figure 1 presents the impedance spectrum Z (Ω cm2) calculated at Ecorr,0 without AC corrosion enhancement with the kinetics parameter displayed in Table 1.
On this figure, one can remark the diffusion impedance at the frequency below 10 mHz. Above this frequency, the impedance is determined by RE, Cd, and the charge transfer resistance Rt. The impedance at 50 Hz, the frequency of AC signal used is indicated in the insert. It can be seen that at this frequency, the impedance is essentially determined by RE and Cd. The amplitude ∆I for ∆U = 10 mV will be evaluated by ∆U / |Z(50 Hz)| = 10 (mV) / 202.7 (Ω cm2); thus equal to 49.33 mA cm-2. One may then evaluate hastily that ∆E = ∆U −∆I|Z(50 Hz)| = 0.134 mV, only 1.34% of
applied AC signal. This calculation is, however, wrong as illustrated below.
Figure 2A illustrates, for ∆U arbitrarily chosen
to 10 mV, the potential modulation U(t) and E(t) and Figure 2B depicts the overall current modulation I(t), those for the charging of double layer capacitance ICd(t), and the
faradaic current IF(t). Equation 15 presents the relation linking these three currents.
(15)
Then E(t) can be calculated by equation 1.
E(t) illustrates the decrease of AC amplitude as mentioned above due to the ohmic drop through the electrolyte resistance RE (equation 2). But, because of the phase-shift between U(t) and I(t), ∆E is much higher, i.e.
1.57 mV, than that evaluated by hasty calculation above (0.134 mV), more than 10 times greater. The ratio of its amplitude ∆ICd over ∆I is ca. 4.5. Then with equation 15,
the faradaic current IF(t) was evaluated. The amplitude of IF(t) is similar to that of ICd(t). It is important to point out that the amplitude of these two currents is surprisingly higher than the total current I(t), because of the phase shift
Figure 1. Nyquist plot of impedance spectrum Z calculated at Ecorr,0 in
absence of AC corrosion enhancement in a mildly corrosive soil with the corrosion parameters displayed in Table 1. The insert is high frequency part to illustrate Z at 50 Hz (parameters in Hz and f with 10 points per decade).
Table 1. Values of corrosion kinetic parameters and some pertinent ones used for the three reaction corrosion mechanism
Ecorr,0 / V Icorr,0 / (µA cm-2) ba / V-1 bc,H2O / V
-1 b
c,O2 / V-1 ILim / (µA cm-2) Icorr,0,O2 / (µA cm-2)
−0.75 4 23.1 −19.2 −19.2 20 4
RE / (Ω cm2) Cd / (µF cm-2) λH2O / dimensionless RL / dimensionless f / Hz Rp / (kΩ cm
2) R
pIcorr,0 / V
200 100 0.001 -0.2 50 7.84 0.0293
Subscript “0” indicates the values without AC signal.
between these three terms, as this was the case for E(t) compared with U(t).
The results of digital simulation for various peak voltages of AC signal ∆U on the mean DC polarization
curve IF,AV with respect to U is presented in Figure 3. IF,AV represents the mean faradaic current density (mean value for entire periods of AC signal). On this figure, the diffusion limiting current density for the dissolved oxygen is marked by ILim, and the open circuit corrosion potential Ecorr,0 and the corrosion current density Icorr,0 in absence of AC signal are also indicated by (+) mark. It is worth to recall that there is no faradaic rectification effect on the diffusion limiting current density, since this value is determined by the concentration gradient of O2 at the vicinity of the electrode surface.
In some experiments, AC perturbation was added in parallel to the potentiostat circuit that maintains U constant. To avoid the coupling of AC perturbation and potential regulation, a huge inductor is inserted. In this configuration, IF enhanced by AC signal cannot be determined. In contrast, if AC signal was superimposed to U in a potentiostat circuit IF,AV can be determined by using low pass filter.
Since the value of λ used here is small, 0.001, the
reduction of water becomes visible only at rather high cathodic potential. When ∆U increases, the water reduction
reaction is enhanced by faradaic rectification; consequently the potential domain controlled by the diffusion limiting current density becomes narrower with increasing ∆U. In
other terms, the current plateau can no longer be observed for ∆U ≥ 2V.
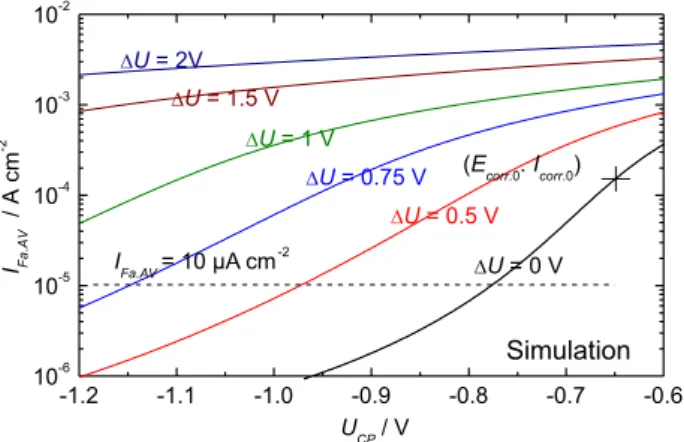
The effect of the cathodic protection by UCP in presence of AC induced corrosion is illustrated in Figure 4. The mean DC anodic faradaic current density, IFa,AV with respect to DC potential UCP for various AC amplitude ∆U are drawn in this figure.
Let us consider that the maximum admissible corrosion current density be 10 µA cm-2, that is the thickness-loss of 116 µm y-1 for uniform corrosion. No cathodic protection is necessary in absence of AC signal since the corrosion current density was set at 4 µA cm-2, for this mildly corrosive soil. At high ∆U, the corrosion
enhancement occurs by the increase of the water reduction reaction. This process induces an alkalization of soil close to the steel surface and the formation of H2 bubbles. These effects were neglected as stated above in the present paper. For imposed UCP equal to −1 V, the steel pipe will be protected up to ∆U ca. 2.2 V. Above ∆U ca. 2.5 V,
the anodic component increases steeply by the faradic rectification effect with the corrosion parameters given in Table 1. The cathodic protection can thus be hardly applied in presence of AC signal greater than ca. 2.7 V, i.e. slightly smaller than 2 Vrms.
Let us examine now the corrosion potential shift induced by AC perturbation, as illustrated in Figure 3 above. The amplitude of AC signal was normalized by dividing ∆U by Stern-Geary coefficient,9 B
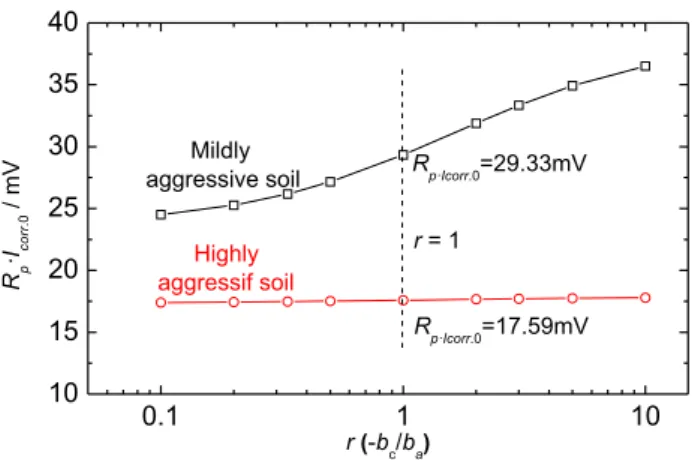
SG (= RpIcorr,0) calculated at the corrosion potential without AC signal. RpIcorr,0 is independent of r (= −bc/ba) for bi-tafelian corrosion mechanism,1,2 however for the mixed kinetics, Stern-Geary coefficient depends upon bc,O2 value. Figure 5 shows the cathodic polarization curve relative to the oxygen reduction dissolved in electrolyte near the corrosion potential in absence of AC signal according to the corrosion kinetics parameters presented in Table 1. On this figure, one can remark readily that the higher the r value is, the steeper the polarization curves is, thus the smaller the polarization resistance for the same Icorr,0.
The overall polarization resistance Rp is determined by the following equation.
Figure 3. Simulated polarization curves under AC signal of different amplitudes ∆U (in V) indicated near the polarization curves. Table 1 indicates the corrosion kinetic parameters used.
Figure 4. Averaged anodic faradaic current density IFa,AV in presence of
AC signal for a set of corrosion parameters indicated in Table 1. A dashed line indicatesthe maximum admissible corrosion rate ofIFa,AV = 10 µA cm-2
arbitrary chosen corresponding to the thickness-loss of 116 µm y-1. A side
(16)
Rp,c,O2and Rp,c,O2are, respectively, the polarization
resistance of oxygen and water reduction reaction (Ω cm2) when only one of these processes are taking place. Rp,c,O2was determined by equation 6 where I∞ is equal to
5 µA cm-2.
Figure 6 illustrates the variation of RpIcorr,0 calculated for various r values. It can be noticed that the coefficient linking the corrosion current density and the polarization resistance in absence of AC signal at the open circuit potential, BSG (= RpIcorr,0) increases when the r ratio increases.
However, to present the variation of the corrosion potential, it seems judicious to keep BSG constant, because when applied to other corrosion system, it is sufficient to multiply <∆U> by this coefficient to that of the system
under investigation. This is the reason that we opted the value determined at r = 1, i.e., 29.33 mV.
Figure 7 presents the results of digital simulations on the zero overall current in presence of AC signal in reduced scale, <∆Ecorr,AV> (= ∆Ecorr,AV / ∆U) with respect
to <∆U> (∆U / BSG). In contrast to the case of bi-tafelian
corrosion mechanism, cf. Part II,2 these curves are no longer symmetrical between r and 1/r. Besides, <∆Ecorr,AV>
shows an N-shaped curve at small <∆U> then decreases,
in a absolute value, progressively for <∆U> greater than
approximately 25. One may wonder if this oscillatory phenomenon is due merely to the fact that the corrosion potential shift was presented by the reduced scale.
Figure 8 presents the corrosion potential shift ∆Ecorr,AV
in presence of AC perturbation in a small ∆U domain.
In this figure, both variables were not reduced to check if N shaped curves observed above are due to the use of reduced scale. One can remark that ∆Ecorr,AV shifts towards
negative values for r ≤ 1. For r > 1, a maximum followed
by a minimum of the corrosion potential shift ∆Ecorr,AV with
respect to ∆U can be noticed. Beyond this minimum point
located at about ∆U = 0.3 V, the corrosion potential Ecorr,AV
shifts towards more positive direction, but rather slowly for
∆U > 5 V, in other terms, with reduced scale <∆U> > 170
(not illustrated graphically here).
When the cathodic process is under mixed kinetics, at very low ∆U, the corrosion potential shift corresponds to
that predicted for r (= −bc,O
2/ba) with bi-tafelian corrosion
mechanism. Ecorr,AV is negative for r < 1 and positive for r > 1. This is actually observed for ∆U < 0.1. However,
IFa,AV increases due to the faradaic rectification of AC signal, whereas the cathodic reaction rate change little since this reaction is, as stated above, controlled partly or mainly by the concentration gradient. Consequently, the apparent bc,O2
decreases leading to the potential shift observed for r < 1
Figure 5. Polarization curves of the oxygen reduction with mixed kinetics near the open circuit corrosion potential for various r values marked close to each curve in absence of AC signal. Parameters describing the corrosion kinetics are presented in Table 1.
Figure 6. Variation of “Stern-Geary coefficient BSG” calculated for the
three reaction corrosion mechanism for the corrosion kinetics parameters of a mildly corrosive and a highly corrosive soil towards the corrosion of carbon steel.
Figure 7. Effect of <∆U> upon <∆Ecorr,AV> for the three reaction
in the case of the bi-tafelian corrosion mechanism. This explains the corrosion potential shift towards more negative direction even for r > 1. But, as can be observed in Figure 3, the reduction of water molecule taking place in parallel to the oxygen reduction reaction becomes faster for higher cathodic polarization (small U), and then the electrode behavior approaches to that of the bi-tafelian mechanism. This explains ∆Ecorr,AV−∆U curves observed for ∆U > 3 V.
Figure 9 presents the corrosion enhancement Icorr,AV induced by AC signalin logarithmic scale normalized by the corrosion current density in absence of AC signal (<Icorr,AV> = Icorr,AV / Icorr,0) with respect to the reduced amplitude <∆U> = ∆U / BSG. It can be noticed first
that all curves tend to overlap at high <∆U>. When the
current density increases induced by AC signal, mean polarization resistance, Rp,AV, decreases. Then, the actual AC perturbation amplitude (∆E) at the interface decreases
significantly. Consequently, the faradaic rectification becomes less marked. The same observation was made by Ghanbari et al.6
When r is small, bc,H2O in absolute value is small, too.
Then, the oxygen reduction reaction remains in a wider
∆U range controlled by the limiting current density. This
explains why, Icorr,AV − <∆U> curve exhibits a larger plateau. 1/RL, the ratio of the limiting current density ILim over the corrosion current density is −5, thus log (|1/RL|) is 0.7,
this is actually the plateau height close to that observed in Figure 9.
In contrast to the case of bi-tafelian corrosion mechanism (Part II),2 for the corrosion mechanism with three reactions in a mildly corrosive soil, both ∆Ecorr,AV
and ∆Icorr,AV show rather intricate shape because of the
diffusion current plateau that modifies deeply the faradaic rectification effect.
Let us examine now, what will occur for the AC corrosion enhancement of steel embedded in a highly corrosive soil.
Case 2: corrosion in a highly corrosive soil
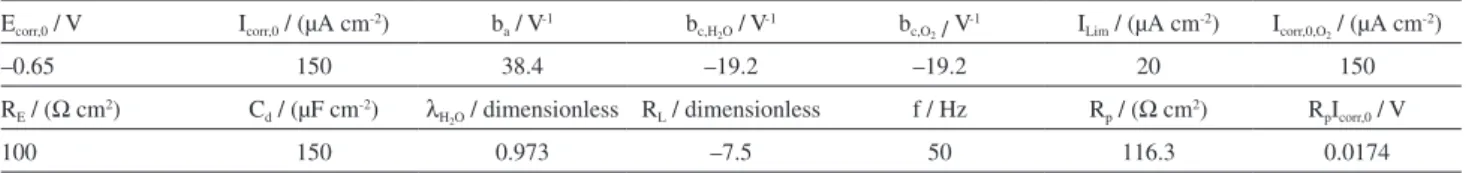
The corrosion kinetics parameters used were similar to those displayed in Table 3 in Part II.2 For this corrosion mechanism, as Table 1, some parameters relative to the oxygen reduction reaction were added.
Figure 10 presents the impedance spectrum calculated at the open circuit potential in absence of faradaic rectification. The impedance diagram exhibits a semi circle with the apex at about 10 Hz. However, by enlarging the low frequency limit of this impedance spectrum, as illustrated in the insert, small diffusion impedance can be seen. The chord of this loop is about 0.6 Ω cm2 whereas the frequency distribution is the same as that in Figure 1. As this is the case for a mildly corrosive soil, the impedance at 50 Hz is located at the high frequency part of the capacitive loop.
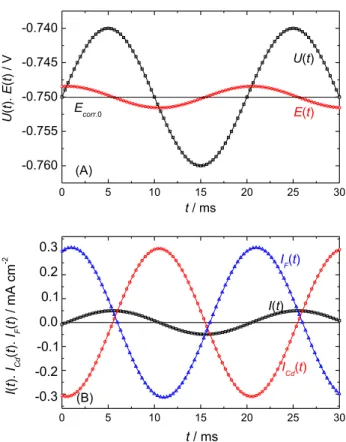
Similar evaluation as a mildly corrosive soil (cf. Figure 2) were carried out to quantify the effective potential E(t), the overall current I(t), the charging of double layer capacitance
Figure 8. Effect of faradaic rectification induced by AC signal of small amplitude ∆U on the corrosion potential shift ∆Ecorr,AV for various r values.
Figure 9. Effect of faradaic rectification with various −bc/ba ratios with respect to the AC amplitude in dimensionless magnitudes.
Table 2. Values of some corrosion kinetic parameters used for calculating AC corrosion enhancement in a highly corrosive soil for three reactions mechanism
Ecorr,0 / V Icorr,0 / (µA cm-2) ba / V-1 bc,H2O / V
-1 b
c,O2 / V-1 ILim / (µA cm-2) Icorr,0,O2 / (µA cm
-2)
–0.65 150 38.4 –19.2 –19.2 20 150
RE / (Ω cm2) Cd / (µF cm-2) λH2O / dimensionless RL / dimensionless f / Hz Rp / (Ω cm
2) R
pIcorr,0 / V
100 150 0.973 –7.5 50 116.3 0.0174
ICd(t) and the faradaic one IF(t). The results are presented in Figure 11 for AC amplitude ∆U = 10 mV to remain in a
linear domain. The electrolyte resistance is smaller and the double layer capacitance and the corrosion rate are higher compared with a mildly corrosive medium presented above.
The amplitude of interface potential ∆E is slightly
higher; 2 mV instead of 1.6 mV. ∆I is almost twice as high in
this medium, because the electrolyte resistance determines the impedance modulus. Due to a higher Cd value and higher
∆E, ∆ICd is 1.5 times greater. As a whole, ∆IF, is also about
1.5 times greater than that of a mildly corrosive soil, as can be seen in Figures 2 and 11.
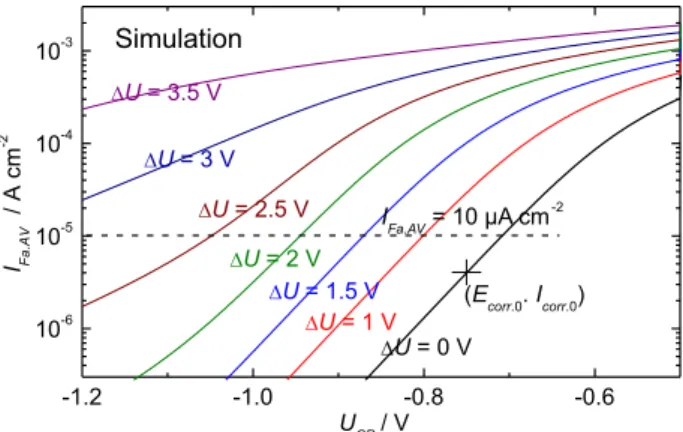
Figure 12 shows the mean DC polarization curves calculated in the presence of AC signal of various amplitudes ∆U. Since the corrosion current density is
significantly higher than the diffusion limiting current density of dissolved oxygen, RL (= Icorr,0 / ILim) as high as 7.5 in absolute value, no current plateau is observed. The polarization curve obtained in the absence of AC signal is similar to bi-tafelian system, or three reaction corrosion mechanism in presence of ∆U = 2 V in a mildly corrosive
soil. In the latter, both anodic and the water reduction reaction are highly enhanced by faradaic rectification.
On this figure, one can remark also that the corrosion potential shift is much less than that observed in a mildly corrosive soil, since the cathodic process, mainly the reduction of water, follows approximately the Tafel law. Then, an increase of the anodic current density induces a smaller DC mean corrosion potential shift compared with that for mildly corrosive soil.
One can notice also that the effect of ∆U to the cathodic
current tends to “saturate” at high UCP values. Almost no further enhancement of the cathodic current is observed beyond ∆U equal to ca. 2 V. This phenomenon is explained
similarly to that presented for bi-tafelian corrosion mechanism in a highly corrosive soil.2
Figure 13 shows the mean DC anodic contribution IFa,AF on the overall faradaic current IF,AV. As above, if the corrosion enhancement by AC signal does not induce a modification of soil chemistry and also if the admissible corrosion current density is considered to be 10 µA cm-2, then in absence of AC signal, UCP equal to −0.8 V is sufficient to protect the steel pipe against the severe corrosion, where Ecorr,0 was set equal to −0.65 V and Icorr,0 = 150 µA cm-2. The value of UCP is thus about 0.15 V more negative with respect to Ecorr,0. With this threshold value of corrosion current
Figure 10. Impedance spectrum in Nyquist plot calculated at Ecorr,0 in
absence of AC corrosion enhancement in a highly corrosive soil with the corrosion parameters presented in Table 2. The insert is the low frequency end of Nyquist plot to show the diffusion impedance (parameters in Hz).
Figure 11. (A) Potential and (B) current modulations at 50 Hz in a highly corrosive medium; cf. conditions in Table 1.
density and at UCP = −0.12 V, the cathodic protection is efficient up to ∆U = 0.76 V. On this figure, it can be seen
that, as it is the case in a mildly corrosive soil, the mean DC current density IFa,AV changes little for high ∆U with respect to UCP, but the anodic dissolution current density is too high. The underground steel pipe in these situations may suffer a severe corrosion.
The variation of the corrosion potential in presence of AC perturbation for various r ratios is presented in Figure 14. The shapes of these curves are similar to those observed for bi-tafelian corrosion mechanism in contrast to those calculated for a mildly corrosive soil.2 In a highly corrosive soil, the polarization curves look like also bi-tafelian corrosion mechanism since Icorr,0 is markedly greater than ILim. However, compared with Figure 11 of Part II for bi-tafelian corrosion mechanism,2 the peak <∆E
corr,AV> value for a given r is much higher in absolute value than that calculated for bi-tafelian corrosion mechanism. Though the water reduction current density predominates the overall
IF,AV, as can be seen in Figure 12, the oxygen reduction reaction induces a significant effect on the corrosion potential shift.
The corrosion current density as the mean DC current value over an entire period of AC signal induced by the faradaic rectification is presented on Figure 15. Like bi-tafelian corrosion mechanism (cf. Figure 12 in Part II),2 the curves for r and 1/r overlap. The effect of the oxygen reduction on the current is, as expected, negligible on the overall current. It is also important to note that all curves tend to join each other at high <∆U>. For a low <∆U>
domain, a steep increase of log (<Icorr,AV>) − <∆U> can be remarked. At about <∆U> = 3, a slope change is observed
as this was the case for bi-tafelian corrosion mechanism. The corrosion enhancement by AC signal in a highly corrosive soil is therefore similar to the case of bi-tafelian corrosion mechanism.
Discussion of results with Ghanbari’s article
The corroding system used by Ghanbari et al.6 was a carbon steel in 0.1 M NaCl. The corrosion rate was ca. 40 µA cm-2 and R
E close to 50 Ω cm2 according to Figure 3 and Table 3.6 Thus, compared with the corrosion kinetics parameters used in this article, these two variables correspond to, rather, those used for highly corrosive soil.
We considered that the mean DC current density in presence of AC signal corresponds to the corrosion rate of steel specimen. This premise was verified by Ghanbari’s experiments. They used 60 Hz whereas in our modeling AC signal was 50 Hz, frequency largely used for power supply in USA and in Europe, respectively. The effect of this frequency difference is likely negligible. The corrosion current density in their experiments is rather high, close to the limiting current of dissolved oxygen according to Figure 1.6 Thus the corrosion mechanism will
Figure 13. Averaged faradaic anodic components in presence of AC signal of various amplitudes to illustrate the cathodic protection potential necessary to protect the carbon steel from the corrosion in a highly corrosive soil.
Figure 14. Effect of <∆U> upon <∆Ecorr,AV> for the three reaction corrosion
mechanism in a highly corrosive soil for various r values. The corrosion kinetic parameters are given in Table 2.
Figure 15. Effect of faradaic rectification with various r (= −bc/ba) ratios in
be in-between the bi-tafelian and three reaction corrosion mechanisms.
In our former paper,2 the effect of the double layer capacitance to the corrosion current density was evaluated for the bi-tafelian mechanism (cf. Figure 6).2 The increase of the double layer capacitance diminishes the corrosion enhancement. This effect was verified experimentally by their paper. However, Ghanbari et al.6 attributed to the “high frequency break point”. This frequency is defined as above which no faradaic current is passing through the interface. This definition is surprising because whatever the frequency, faradaic current should be remaining in the total current, even if this will be very small. One may understand readily that at low frequency (10 mHz), the double layer capacitance has no effect since the current for charging this capacitance is negligible. In contrast, at high frequency, 1 kHz, almost whole AC current is by-passed through the double layer capacitance, and no Faradaic rectification is expected.
Consequently, their experimental results and simulation calculation confirm our hypotheses used.
Conclusion
In this Part III, the results of digital simulations were presented when the electrolyte resistance RE is no longer negligible, which may happen definitively during the corrosion enhancement induced by stray AC signal on underground steel pipelines covered with a thick organic coating and under a cathodic protection. The system under consideration is named three reaction corrosion mechanism since there are one anodic reaction corresponding to the steel dissolution, and two cathodic processes. One of these reactions is the reduction of dissolved oxygen taking place near the open circuit corrosion potential and another that of the water molecules taking place at higher cathodic over-potential. The electrolyte resistance attenuates the effective AC voltage at the electrode interface (∆E) because of the
ohmic drop, consequently the AC corrosion enhancement. The corrosion potential, i.e. the zero overall current, Ecorr,AV in presence of AC signal was calculated in reduced scales. For this sake, as this was the case in Part I and II,1,2 reduced corrosion potential shift <∆Ecorr,AV> = (Ecorr,AV − Ecorr,0) / ∆U and reduced AC
amplitude <∆U> = ∆U / BSG were used for various
r (= −bc/ba) values between 0.1 and 10. ba and bc stand,
respectively, for the Tafel constant of anodic and cathodic processes. BSG is the so-called Stern-Geary coefficient defined as RpIcorr,0 where Rp is the polarization resistance (= ∆E/∆I at Ecorr,0). As our former work,1 the Tafel constant of two cathodic processes were considered identical. When
the reaction rate is partly controlled by the diffusion, BSG depends on r value, therefore BSG at r = 1 was used. By this reduced entities, one may evaluate rather readily the effect of AC signal on the corrosion current enhancement for particular case encountered in field applications. A voltammogram obtained without AC signal may allow determining Icorr,0, ba and bc, whereas the electrochemical impedance spectroscopy at the same conditions supplies RE and Cd, parameters necessary to evaluate the AC corrosion enhancement.
Two corrosion situations were modeled; steel pipes buried in a mildly or in a highly corrosive soil. The corrosion current density in absence of AC signal Icorr,0 were fixed equal to 4 and 150 µA cm-2, respectively, in these soils as bi-tafelian corrosion mechanism analyzed in Part II of this series.2 These corrosion parameters and others were fixed according to the values often encountered in the field experiences.
In a mildly corrosive soil, Icorr,0 is set at ca. one fifth of the diffusion limited current density of the dissolved oxygen at saturation for stationary electrode. The impedance spectrum calculated at the open circuit corrosion potential without AC signal, Ecorr,0 shows clearly finite diffusion impedance at low frequency end. The frequency of AC signal inducing the corrosion enhancement used in this paper was 50 Hz. Even at this frequency, the contribution of the faradaic current is significant and more than six times greater than the overall AC current. This somewhat unexpected behavior is due to the fact that overall current is the sum of the current for the charging of double layer capacitance ICd and the faradaic one IF with significant difference in phase-shift between them.
The kinetics parameters used make appear clearly the reduction of water reduction in absence of AC signal at about 0.3 V more negative to Ecorr,0. The diffusion limited current can then be clearly observed on the polarization curves. The effect of AC signal of various amplitude ∆U
on the faradaic rectification was calculated by the averaged value on entire periods of AC signal, IF,AV. The anodic part of these currents increases steeply with ∆U. On the contrary,
the cathodic component increases only clearly for high
∆U. The diffusion limiting current is controlled by the
concentration gradient of the dissolved oxygen, thus there is no faradaic rectification effect. The observed current increase is therefore due to the enhancement of the water reduction reaction.
surface was taken into consideration. If the admissible corrosion current density was fixed arbitrary equal to 10 µA cm-2, i.e. the thickness loss of 0.12 mm y-1, the steel pipe surrounded by a mildly corrosive soil can be protected up to ∆U = 2.7 V with UCP = −1.2 V.
For a highly corrosive soil, the diffusion limiting current density ILim is much smaller than the overall corrosion current density. In this case, the polarization curves no longer exhibit the current plateau, and calculated IF,AV−∆U curves are similar to those obtained for the case of bi-tafelian corrosion mechanism. The corrosion potential shift is slightly influenced by the presence of oxygen reduction reaction, but the corrosion enhancement remains almost the same. The corrosion of steel pipe surrounded in a highly corrosive medium, with the kinetics parameters used here, can be mitigated only when ∆U is smaller than 0.8 V at
UCP = −1.2 V if the corrosion enhancement by AC signal does not induce any modification of the soil properties at coating holidays.
The digital simulation approaches used in this study was validated by a recent experimental and theoretical work by Ghanbari et al.6
References
1. Ibrahim, I.; Tribllet, B.; Takenouti, H.; Meyer, M.; J. Braz. Chem. Soc. 2015, 26, 196.
2. Ibrahim, I.; Tribollet, B.; Takenouti, H.; Meyer, M.; J. Braz. Chem. Soc. 2016, 3, 605.
3. Gellings, P. J.; Electrochim. Acta 1962, 7, 19. 4. Bertocci, U.; Corrosion 1979, 35, 211.
5. Bosch, R. W.; Bogaerts, W. F.; Corros. Sci. 1998, 40, 323. 6. Ghanbari, Z.; Iannuzzi, M.; Lillard, R. S.; Corrosion 2016, 72,
1196.
7. Bard, A. J.; Faulkner, L. R.; Electrochemical Methods, Wiley, New York, 1980, ch. 9, p. 331.
8. Wolfram, S.; The Mathematica Book, 6th ed.; Wolfram Media
& Cambridge University Press: Champaign, USA; Cambridge, UK, 2007.
9. Stern, M.; Geary, A. L.; J. Electrochem. Soc. 1957, 104, 56.
Submitted: September 19, 2016