Tree population and community dynamics in a Brazilian
tropical semideciduous forest
VIVETTE APPOLINÁRIO1, ARY T. OLIVEIRA FILHO1,3 and FREDERICO A.G. GUILHERME2 (received: April 8, 2004; accepted: February 3, 2005)
ABSTRACT – (Tree population and community dynamics in a Brazilian tropical semideciduous forest). The dynamics of the tree community and 30 tree populations were examined in an area of tropical semideciduous forest located on the margin of the Rio Grande, SE Brazil, based on surveys done in 1990 and 1997 in three 0.18 ha plots. The main purpose was to assess whether variations in dynamics were related to topography and the effects of a catastrophic flood in 1992. Rates of mortality and recruitment of trees and gain and loss of basal area in two topographic sites, lower (flooded) and upper (non-flooded), were obtained. Projected trajectories of mean and accelerated growth in diameter were obtained for each species. In both topographic sites, mortality rates surpassed recruitment rates, gain rates of basal area surpassed loss rates, and size distributions changed, with declining proportions of smaller trees. These overall changes were possibly related to increased underground water supply after the 1992 flood as well as to a c. 250-year-old process of primary succession on abandoned gold mines. Possible effects of the 1992 flood showed up in the higher proportions of dead trees in the flooded sites and faster growth rates in the flood-free sites. Species of different regeneration guilds showed particular trends with respect to their demographic changes and diameter growth patterns. Nevertheless, patterns of population dynamics differed between topographic sites for only two species.
Key words - forest dynamics, tree community dynamics, tree growth, tree population dynamics, tropical semideciduous forest
RESUMO – (Dinâmica da comunidade e de populações arbóreas em uma floresta tropical semidecídua). A dinâmica da comunidade arbórea e de 30 populações das espécies constituintes foi investigada em uma área de floresta tropical semidecídua situada na margem do Rio Grande, em Bom Sucesso (MG), com base em inventários conduzidos em 1990 e 1997 em três parcelas de 0,18 ha. O objetivo principal foi verificar se variações na dinâmica estariam relacionadas à topografia e aos efeitos de uma inundação catastrófica ocorrida em 1992. Foram obtidas taxas de mortalidade e recrutamento de árvores e taxas de ganho e perda de área basal em dois sítios topográficos: baixo (inundado) e alto (não-inundado). Trajetórias de crescimento médio e acelerado foram obtidas para cada espécie. Registrou-se, para ambos os sítios topográficos, que as taxas de mortalidade superaram as de recrutamento, as taxas de ganho superaram as de perda de aérea basal e as distribuições de tamanho mudaram no período devido ao declínio na proporção de árvores menores. Tais mudanças se relacionaram, possivelmente, ao incremento do suprimento de água subterrânea registrado depois da inundação de 1992, bem como a um processo de sucessão primária que vinha ocorrendo há cerca de 250 anos em uma área de mineração de ouro abandonada. Possíveis efeitos da inundação apareceram na maior proporção de árvores mortas nos sítios inundados e nas taxas de crescimento mais aceleradas nos sítios não-inundados. Espécies de diferentes guildas de regeneração mostraram tendências particulares com respeito às suas mudanças demográficas e padrões de crescimento em diâmetro.
Palavras-chave - crescimento de árvores, dinâmica de comunidades arbóreas, dinâmica florestal, dinâmica de populações arbóreas, floresta tropical semidecídua
Introduction
Disturbance plays a key role in shaping the structure, dynamics and species composition of tropical tree communities by causing environmental heterogeneity
over space and time and on a wide range of scales (van der Maarel 1993, Phillips & Gentry 1994, Sheil & Burslem 2003). Fine-scale disturbances due to tree-falls are believed to heighten the structural complexity and species diversity of tropical forests, though this is subject to debate (Schnitzer & Carson 2001). Other disturbances, operating on larger scales, such as forest felling and fragmentation, fire outbreaks, hurricanes, landslides, and river floods, are also known to have a strong effect on forest dynamics and, as a result, on the composition and structure of tree communities (Whitmore & Burslem 1998). The effects of river flood disturbances to tropical forests dynamics are still poorly
1. Universidade Federal de Lavras, Departamento de Ciências Florestais, 37200-000 Lavras, MG, Brazil.
2. Universidade Estadual Paulista, Departamento de Botânica, 13506-900 Rio Claro, SP, Brazil.
studied (Damasceno Junior et al. 2004, Guilherme et al.
2004).
Rivers are an important source of disturbance to tropical forests due both to their flooding regime and changing of course (Kellman & Tackaberry 1993, Naiman & Décamps 1997). They may maintain a constant instability and reorganization of the floodplain plant communities as a result of the strong influence of moving water and sediments on the establishment, growth and reproduction of different species assemblages (Salo & Räsänem 1990, Siebel & Blom 1998). Long-lasting floods and sediments laden flanks often result in the establishment of a species-poor plant community (Guilherme et al. 2004). Species-richer
“várzea” forests develop on more stable sites, where floods are shorter or sedimentation rates lower (Junk 1990, Metzger et al. 1997). Notwithstanding, infrequent
but catastrophic floods can also have a considerable effect on the structure of plant communities of riverine forests (Damasceno Junior et al. 2004).
Here we analyze tree population and community dynamics after a seven-year period (1990-1997) in an area of semideciduous forest that occurs alongside a river in south-eastern Brazil. In the first detailed survey of this area, Oliveira Filho et al. (1994) found evidence
that tree species distribution in three plots located along the river margin was significantly associated with the topographic variation but not with the distance from the river margin. Contrasting to the well drained upper areas, depressions were moister year-round and liable to unpredictable and catastrophic floods. In 1997, we carried out a second survey in the same plots, addressing the following main question: how is the tree community dynamics affected by topography in this area? We were particularly interested in the effects of a great flood that occurred in 1992 because we observed many dead seedlings and saplings in the areas where leaves and stems were coated in sediments left by the flood. The specific hypotheses were: (a) Tree community dynamics differ between upper (non-flooded) and lower ((non-flooded) sites, with the latter showing higher instability due to increased mortality, reduced recruitment, and faster accumulation of biomass caused by increased growth of surviving trees; (b) Tree population dynamics differ among species according to their regeneration guilds and preference for either upper or lower sites. We expect that species concentrated on topographic lows, low-stature understory species and species with higher potential growth rates are negatively affected by the flood.
Materials and methods
Study area – The studied sites are situated in a fragment of tropical semideciduous forest along the margin of the Rio Grande river in the district of Macaia (21°09’ S and 44°54’ W, 806-832 m a.s.l.), municipality of Bom Sucesso, Minas Gerais state, south-eastern Brazil (site details in Oliveira Filho et al. 1994). The studied area was one of the largest continuous forest tracts still found in the Upper Rio Grande region. In 2002, nearly 30% of the original 84 ha, including the study sites, were felled before being inundated by the Funil Hydroelectric Reservoir. Before this, the forest fragment used to fringe the steep river banks, extending inland through a complex net of steep ravines. Oliveira Filho et al. (1994) mistakenly believed those ravines resulted only from erosion by groundwater seepage and runoff. In fact, they were the result of a gold rush that took place along the Rio Grande and Rio das Mortes around 1740. Miners channeled water in order to help excavation and separation of gold particles through washing. This mining practice on alluvial terraces was called “cata” (Portuguese for “picking up”), a term also extended to the ravine itself. After the “catas” were abandoned by the miners, the land became useless for agriculture because of the rough topography and removal of up to 10 m of topsoil. Primary succession then took place on a moonscape of exposed subsoil and resulted, after c. 250 years, as the present-day forest. The inland contour of the forest fragment coincides with great precision to the blunt edges of the “catas” that certainly hampered both logging operations and the expansion of the surrounding farmlands toward the river margin.
As the forest fragment lies on the outer side of a river bend, where the banks are high and steep, the river level usually does not rise enough to flood the forest floor. However, in exceptionally rainy years, 1978/79 and 1991/92, catastrophic floods took place along the Rio Grande and partially inundated the forest. In January 1992 (total monthly rainfall of 717.9 mm), the water level rose up to 812 m a.s.l. (7 m above normal floods, see figure 1) and flooded the bottom of the “catas” for nearly one month. In addition, the underground water supply increased up to a point that intermittent rivulets appeared in several “catas” and did not dry out completely before mid 1995.
They also carried out a detailed topographic survey of all sample plots and collected soil samples in each subplot for analysis.
Between March and October 1990, the authors surveyed the three plots for all live trees with a diameter at the base of the trunk (dbt) t 5 cm. The size limit was adopted to effectively survey both understory and canopy trees and therefore give a more detailed description of the plant community in a highly heterogeneous environment. Trees were marked with numbered aluminum tags (pinned 5 cm above the dbt measuring level), identified to species and measured for height and dbt. Descriptive results of this first survey and full taxonomic information are given in Oliveira Filho et al. (1994) and Carvalho et al. (1995). We performed a second survey in the same plots from March to August 1997, recording dead trees and measuring surviving trees and recruits. The interval between the midpoints of the two survey periods was 6 years and 10 months (6.92 yr).
Data analyses – We split each the three sample plots into two topographic sites corresponding to the flood-free elevated sites, named Upper Sites, and the occasionally flooded bottom of the “catas”, named Lower Sites (figure 1). The level reached by the 1992 flood was the criterion used to classify the 24 sample subplots as to inundating either more or less than half of their surface. Fortunately, all sample plots contained four subplots in each topographic site. Both the Upper and Lower Sites were therefore represented by three replications of half-plots, each containing four subplots (900 m2).
We obtained dynamics variables for the total sample, the two topographic sites and their three replications, diameter classes and chosen tree populations. Based on Sheil et al. (1995), Sheil & May (1996) and Gomes et al. (2003), we assumed that changes in population size per time interval are a constant proportion of the initial population and calculated mean annual rates of mortality (M) and recruitment (R) using the exponential expressions: M = {1 - [(N0- m)/N0]1/'t} × 100,
and R = {[(N0 + r)/N0]1/'t - 1} × 100, where N0 is the initial
population count, m is the number of deaths, r is the number of recruits and 't is the time elapsed between surveys. As in Oliveira Filho et al. (1997) and Werneck and Franceschinelli (2004), we also obtained the rates of loss (L) and gain (G) of tree basal area using the equations L = {1 - [(AB0 - ABm - ABd)/
AB0] 1/'t} × 100, and G = {[(AB0 + ABr -ABg)/N0]1/'t - 1} × 100,
where AB0 is the initial population basal area, ABm is basal
area of dead trees, ABd is the basal area decremented by
surviving trees (through breaking and stem decay), ABr is
the basal area of recruits, and ABg is the basal area
incremented by surviving trees. We also produced rates of net change in the full period, for both number of individuals (ChN) and basal area (ChAB), using the equations
ChN = {[(N0 -m + r)/N0] -1} × 100 and ChAB = {[(AB0
-ABm -ABd + ABr + ABg)/N0] -1} × 100. We also obtained
turnover rates from the means of mortality and recruitment rates and the means of loss and gain rates.
The net change in tree density and basal area and the rates of mortality, recruitment, loss, gain and turnover in the two topographic sites were compared with paired-sample t tests while the number of surviving, dead and recruit trees were tested for independence of the same two sites with chi-square goodness of fit tests (Zar 1996). It is worth stressing that the three half-plots, and not the 12 subplots, were used as replications because the latter are not independent. Independent, normal populations with equal variances were deliberately assumed to perform the t tests. As stated by Zar (1996), “the biological researcher cannot (…) always be assured that these assumptions are correct. Fortunately
Figure 1. Surface grids of the three plots of semideciduous forest surveyed in Bom Sucesso, southeastern Brazil, showing the topographic sites. Each forest plot is composed of eight adjacent subplots (15 × 15 m in size).
Section 1
Section 2
numerous studies have shown that the t test is robust enough to stand considerable departures from its theoretical assumptions, especially if sample sizes are equal or nearly equal, and especially when two-tailed hypotheses are considered”.
We also examined tree dynamics per diameter classes in the two topographic sites and total sample. In order to enhance graphic comparisons, the increasing ranges of diameter classes proposed by Botrel et al. (2002) for semideciduous forests of the same region (5-10, >10-20, >20-40, and >40-80 cm) were used to make up for the strong decline in tree density towards larger diameter classes, typical of reversed-J distributions. For each diameter class, we extracted the number of trees that underwent the following events: death, ingrowth (inter-class imports through recruitment and growth) and outgrowth (inter-class exports through growth) of trees. We used a chi-square goodness of fit to test whether the final number of trees (1997), the number of dead trees, and number of outgrowth and ingrowth events were independent of the diameter classes based on the frequencies expected from the initial diameter distribution (1990). We also calculated mortality, ingrowth and outgrowth rates per diameter class using the same equation described above.
For the analyses of population dynamics, we chose the species that were represented by more than 10 surviving trees in the total sample and contained at least two trees in each of the diameter classes (see above) present in the species size range (30 out of 165 species). For the sake of seeking ecologically meaningful patterns, we classified the species into four regeneration guilds and also according to their preference for Upper and Lower Sites. The regeneration guilds, adapted from Lieberman & Lieberman (1987), were: (a) ‘understory’ - shade-tolerant tree species up to 5 m in height that usually reproduce below the forest canopy; (b) ‘subcanopy’ - shade-tolerant tree species up to 15 m in height that usually reproduce below or near the forest canopy; (c) ‘shade-tolerant canopy’ - species of tall trees, 15-25 m in height, that usually grow slowly in the forest understory but become reproductive only after reaching the forest canopy; and (d) ‘light-demanding canopy’ - species of tall trees, attaining 15-25 m of height, that usually grow fast in the forest understory when favored by canopy openings, but stagnate or die when the canopy closes up; they also reproduce only after reaching the forest canopy and may become emergent trees. Species classification was based on the literature coupled with field observations (see Oliveira Filhoet al. 1994). We used a chi-square goodness of fit to the species frequencies in the Upper and Lower sites in order to classify them as preferential for either of the two topographic sites (significant chi-square) or, alternatively, as indifferent to both sites (non-significant). In addition to the changes in tree population density and basal area, we analyzed the growth of surviving trees using the procedures described by Conditet al. (1993).
Results
Tree community dynamics – There was a general decline in tree density throughout the area between 1990 and 1997, as the number of dead trees surpassed the number of recruits in all plots and topographic sites (table 1). In fact, the number of trees declined in 19 out of the 24 subplots. Although, in absolute values, this decline was nearly twice as higher in the Lower compared to Upper Sites, this difference was not significant (t = 1.27, p = 0.33). Likewise, the two sites did not differ significantly for their mean rates of mortality (t = 1.86, p number of surviving, dead and recruit trees did differ significantly between the two sites (F2 = 10.82,
p < 0.005) and this difference was mainly due to the significantly higher and lower frequencies of dead trees in the Lower and Upper Sites, respectively, with regard to expected values from the total sample (F2 = 7.69,
p < 0.006).
Contrary to the trends found with respect to tree density, the dynamics, expressed as tree basal area, indicated a positive balance between loss and gain rates in both topographic sites (and in 22 out of the 24 subplots), mostly caused by a pronounced growth of surviving trees (table 1). In absolute values, the net accretion of basal area in the Upper Sites was much higher than in the Lower Sites, but the corresponding means did not differ significantly (t = 3.51, p = 0.07), and so did the mean rates of loss (t = 1.96, p = 0.19) and turnover (t = 0.82, p = 0.50) of tree basal area. In spite of this, the mean gain rate of tree basal area was significantly higher in the Upper than in the Lower Sites (t = 6.92, p < 0.02).
The net decrease in tree density associated with the net increase in tree basal area entailed an enlargement of mean tree size and, therefore, a change in diameter distributions (table 2). Indeed dbt distributions in 1997 differed significantly from expected values based on 1990 for the total sample (F2 = 31.27,
p < 10-5) as well as for both topographic sites (Lower: F2 = 10.53, p < 0.01, Upper: F2 = 24.86, p < 10-4). Tree
frequencies in the period increased for dbt classes >10 and >20 in the Upper and Lower Sites, respectively, and decreased for dbt classes below those limits. In effect, if the minimum diameter is raised to dbt > 10 cm, recruitment rates exceed mortality in both sites, indicating that tree density decline was concentrated in the smallest dbt class, 5-10 cm.
Tree mortality differed significantly among dbt classes for the total sample (F2 = 9.08, p < 0.03) but not
F2 = 3.79, p = 0.28, Upper: F2 = 5.60, p = 0.13). Dead
trees were more frequent than expected for the 5-10 cm dbt class and less frequent in dbt classes >10 cm (table 2). However, the proportions of dead over surviving trees of the 5-10 cm dbt class differed significantly between the two sites (F2 = 5.85, p < 0.025)
with higher and lower frequencies of dead trees in the Lower and Upper Sites, respectively. Differences were non-significant for dbt classes >10 cm. Contrary to the outgrowth rates, which did not vary significantly among dbt classes (total sample: F2 = 4.16, p = 0.25, Lower: F2 = 3.24, p = 0.36, Upper: F2 = 2.60, p = 0.46), ingrowth
rates did differ significantly for the total sample (F2 = 41.68, p < 10-6) and its two topographic sites
(Lower: F2 = 11.40, p < 0.01, Upper: F2 = 39.31,
p < 10-6). These differences were concentrated in the
5-10 cm dbt class which incorporated a number of imports significantly smaller than expected, in contrast with dbt classes > 10 cm which imported more than expected.
Tree population dynamics – The majority of the tree populations analyzed, 25 out of 30 species, showed a net increase in tree basal area (table 3). Of these, 14
populations decreased in density, 10 populations increased in density and one showed no change. The remaining five populations declined in both aspects. Some trends concerning regeneration guilds and preference for topographic sites may be pointed out. There was no Upper Site species among the five declining in both density and basal area; they were either preferential for Lower Sites or indifferent. Nevertheless, the frequencies of species which were either decreasing or increasing (or no change) in density did not differ among the three categories of preference for topographic sites (F2 = 0.84, p > 0.5). The same was
observed for changes in basal area (F2 = 2.85, p > 0.25).
The frequencies of dead and recruited trees did not differ significantly between the two sites, except for two species. Dead trees of Ixora warmingii were more
frequent than expected in the Lower Sites (F2 = 7.17,
p < 0.01) while recruited trees of Esenbeckia febrifuga
were more frequent than expected in the Upper Sites (F2 = 4.00, p < 0.05).
The five understory species were all indifferent to the topographic sites, increased in basal area, and showed higher turnover rates expressed as both tree Table 1. Dynamics of the tree community in an area of tropical semideciduous forest surveyed in 1990 and 1997 in Bom Sucesso, Brazil, given for the total sample and its two topographic sites, and expressed as number of trees and tree basal area. Time interval was 6.92 yr. Values within parentheses are expected frequencies for surviving, dead and recruit trees based on the total frequencies while values within brackets are means of the three half-plots (N = 3).
Total sample Lower Sites Upper Sites
Number of trees:
Initial, 1990 1618 866 752
Final, 1997 1488 773 715
Net change (%) -8.0 -10.7 [-10.7] -4.9 [-5.3]
Surviving 1247 640 (670.1) 607 (576.9)
Dead 371 226 (199.4) 145 (171.6)
Recruits 241 133 (129.5) 108 (111.5)
Mortality rate (% yr-1) 3.7 4.3 [4.2] 3.0 [3.1]
Recruitment rate (% yr-1) 2.0 2.1 [2.0] 2.0 [1.9]
Turnover (% yr-1) 2.9 3.2 [3.1] 2.5 [2.5]
Basal area:
Initial, 1990 (m2) 25.82 13.93 11.89
Final, 1997 (m2) 30.11 15.60 14.51
Net change (%) 16.6 12.0 [12.3] 22.0 [22.5]
Dead (m2) 3.94 2.49 1.45
Recruits (m2) 0.68 0.37 0.31
Growth of surviving (m2) 7.54 3.79 3.75
Loss rate (% yr-1) 2.4 2.8 [2.8] 1.9 [1.8]
Gain rate (% yr-1) 4.1 3.8 [3.8] 4.3 [4.4]
density and basal area. Three of them, Trichilia pallida, Guarea macrophylla and Ocotea laxa, also
increased in tree density while Stylogyne ambigua
and Geonoma schottiana decreased. At the other
extreme, all six light-demanding canopy species were also indifferent to the sites, showed intermediate to lower turnover rates and declined in tree density. This was the only regeneration guild with a significantly higher proportion of species in the declining density category (F2 = 4.59, p < 0.05). Two species, Tapirira
obtusa and Protium widgrenii, also declined in tree
basal area while the other four, Machaerium stipitatum, M. villosum, M. nictitans and Connarus regnellii, increased their basal area. The 11 subcanopy
species and eight shade-tolerant canopy species varied widely in their preference for the topographic sites and turnover rates. Of these 19 species, all but
Dendropanax cuneatus, Protium spruceanum and Myrsine umbellata increased in basal area and seven
also increased in density: Calophyllum brasiliense, Ixora warmingii, Esenbeckia febrifuga, Marlierea racemosa, Metrodorea stipularis, Mollinedia widgrenii and Gymnanthes concolor.
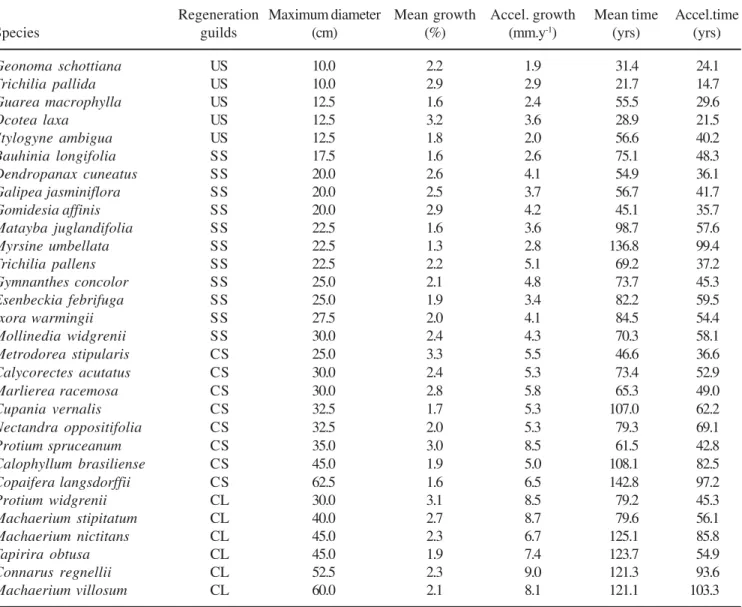
The mean annual growth rates in diameter of the
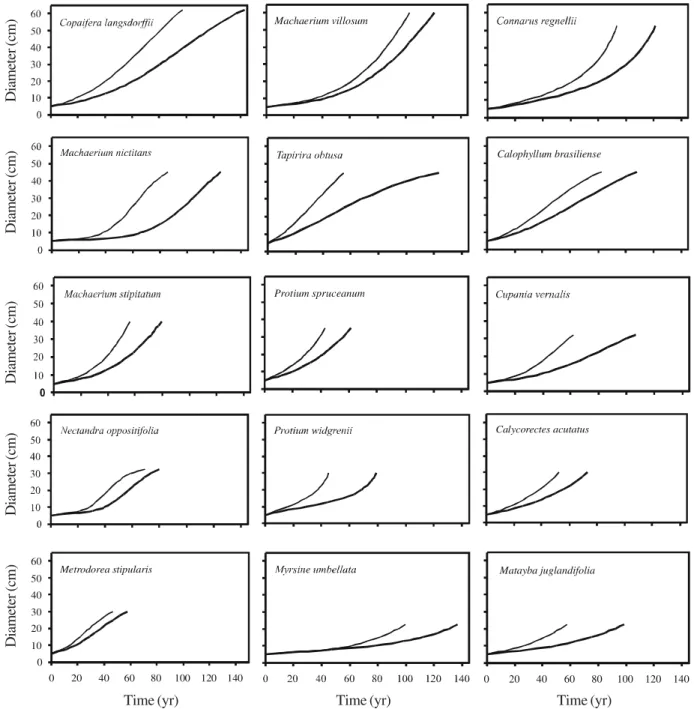
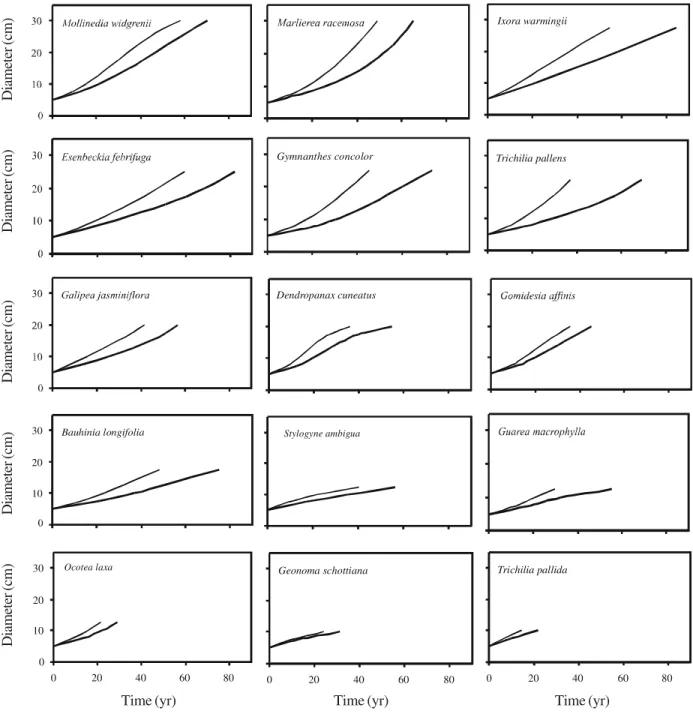
30 populations varied between 1.3% and 3.3% and a similar variation occurred within all regeneration guilds (table 4). The maximum diameter increased from understory (10-12.5 cm) to subcanopy (17.5-30 cm) and canopy species (25-60 cm), therefore reflecting the definition of the groups. There was a large variation among the 30 species in their simulated diameter trajectories under mean and accelerated growth (figures 2, 3). Some curves, such as those for Connarus regnellii, Machaerium stipitatum, Protium spruceanum, Marlierea racemosa and Ocotea laxa,
approached an exponential growth model, i.e. showed
increasing growth rates and no trace of late deceleration. Some of these also showed a long quasi-linear initial phase of slow growth prior to the acceleration phase, as shown by Protium widgrenii, Myrsine umbellata
and Matayba juglandifolia. A full range quasi-linear
growth model was shown by Ixora warmingii, Stylogyne ambigua, Guarea macrophylla, Geonoma schottiana and Trichilia pallida. Some curves
approached the sigmoid growth model, such as those for Copaifera langsdorffii, Tapirira obtusa, Calophyllum brasiliense, Nectandra oppositifolia, Mollinedia widgrenii and Dendropanax cuneatus, but Table 2. Tree community dynamics per diameter (dbt) classes for the area of tropical semideciduous forest surveyed in 1990 and 1997 in Bom Sucesso, Brazil, given for the two topographic sites and the total sample. Expected values (within parentheses) for the number of trees in 1997 and the number of death, outgrowth and ingrowth events per dbt class were based on the distribution of the number of trees per dbt class in 1990. Annual percent rates are also given.
dbt-class Number of trees Deaths Outgrowth Ingrowth
(cm) 1990 1997 N. %yr-1 N. %yr-1 N. %yr-1
Lower Sites:
5-10 556 461 (496.3) 156 (145.1) -4.6 74 (73.8) -2.0 a135 (159.2) 3.2 >10-20 209 199 (186.6) 52 (54.5) -4.0 32 (27.8) -2.4 74 (59.9) 4.5
>20-40 85 91 (75.9) 16 (22.2) -3.0 9 (11.3) -1.6 31 (24.3) 4.6
>40-80 16 22 (14.3) 2 (4.2) -1.9 0 (2.1) 0.0 8 (4.6) 6.0
Totals 866 773 226 -4.3 115 -2.0 248 3.7
Upper Sites:
5 -10 470 402 (446.9) 101 (90.6) -3.4 75 (70.6) -2.5 b108 (138.1) 3.0 >10-20 190 207 (180.7) 34 (36.6) -2.8 25 (28.6) -2.0 76 (55.8) 5.0
>20-40 80 81 (76.1) 10 (15.4) -1.9 13 (12.0) -2.5 24 (23.5) 3.9
>40-80 12 25 (11.4) 0 (2.3) 0.0 0 (1.8) 0.0 13 (3.5) 11.2
Totals 752 715 145 -3.0 113 -2.3 221 3.8
Total sample:
5-10 1026 863 (943.6) 257 (235.3) -4.1 149 (144.6) -2.2 243 (297.4) 3.1 >10-20 399 406 (366.9) 86 (91.5) -3.4 57 (56.2) -2.2 150 (115.7) 4.7 >20-40 165 172 (151.7) 26 (37.8) -2.4 22 (23.3) -2.0 55 (47.8) 4.2
>40-80 28 47 (25.8) 2 (6.4) -1.1 0 (3.9) 0.0 21 (8.1) 8.4
Totals 1618 1488 371 -3.7 228 -2.5 469 4.1
Table 3. Tree population dynamics for the 30 most abundant species of the area of tropical semideciduous forest surveyed in 1990 and 1997 in Bom Sucesso, Brazil. Species regeneration guilds: US = understory; SS = subcanopy; CS = canopy/shade-tolerant; CL = canopy/light-demanding. Topogr. Sites = preference for topographic sites (Indiff. = indifferent). Number of trees: N0 = initial (1990); Dd. = dead; Rcr. = recruits; Nt = final (1997). Basal area: AB0 = initial (1990); Dec. = decay; ABt = final (1997).
Regen. Topogr. Number of trees Basal area (m2)
Species guilds sites N0 Dd. Rcr. Nt AB0 Dec. Gain ABt
Geonoma schottiana Mart. US Indiff. 28 7 2 23 0.105 0.025 0.038 0.118 Guarea macrophylla Vahl. US Indiff. 20 5 8 23 0.079 0.016 0.042 0.104 Ocotea laxa (Nees) Mez US Indiff. 43 7 10 46 0.151 0.020 0.090 0.221 Stylogyne ambigua (Mart.) Mez US Indiff. 16 5 4 15 0.057 0.015 0.028 0.071 Trichilia pallida Sw. US Indiff. 33 9 14 38 0.117 0.038 0.091 0.171 Dendropanax cuneatus (DC.) Decne. SS Lower 58 35 2 25 0.501 0.308 0.073 0.266
& Planch.
Gomidesia affinis (Cambess.) SS Lower 31 7 2 26 0.172 0.022 0.078 0.228
D. Legrand
Trichilia pallens C.DC. SS Lower 44 12 8 40 0.274 0.070 0.118 0.323 Gymnanthes concolor (Spreng.) SS Upper 74 9 10 75 0.539 0.071 0.212 0.680
Müll.Arg.
Bauhinia longifolia D.Dietr. SS Upper 26 4 3 25 0.158 0.021 0.056 0.193 Esenbeckia febrifuga (A.St.-Hil.) SS Upper 23 3 8 28 0.148 0.008 0.076 0.216
A.Juss. ex Mart.
Galipea jasminiflora (A.St.-Hil.) SS Upper 21 9 6 18 0.092 0.034 0.049 0.107
Engl.
Ixora warmingii Müll.Arg. SS Upper 27 3 10 34 0.299 0.007 0.138 0.429 Matayba juglandifolia (Cambess.) SS Upper 24 5 2 21 0.268 0.034 0.061 0.295
Raklk.
Mollinedia widgrenii A.DC. SS Indiff. 19 2 3 20 0.184 0.013 0.084 0.255 Myrsine umbellata Mart. SS Indiff. 16 4 0 12 0.177 0.033 0.031 0.176 Calophyllum brasiliense Cambess. CS Lower 59 6 22 75 0.299 0.025 0.180 0.454 Marlierea racemosa (Vell.) Kiaersk. CS Lower 23 4 5 24 0.137 0.014 0.075 0.198 Protium spruceanum (Benth.) Engl. CS Lower 51 18 12 45 0.647 0.337 0.204 0.513 Calycorectes acutatus (Miq.) Toledo CS Upper 69 10 3 62 0.381 0.043 0.165 0.503 Metrodorea stipularis Mart. CS Upper 29 3 5 31 0.256 0.024 0.187 0.418 Copaifera langsdorffii Desf. CS Indiff. 76 3 1 74 3.668 0.045 0.974 4.598 Cupania vernalis Cambess. CS Indiff. 66 12 11 65 0.547 0.047 0.182 0.683 Nectandra oppositifolia Nees & Mart. CS Indiff. 16 2 2 16 0.412 0.062 0.387 0.450 Connarus regnellii G.Schellenb. CL Indiff. 21 1 1 21 0.655 0.003 0.235 0.888 Machaerium nyctitans (Vell.) Benth. CL Indiff. 32 2 1 31 1.028 0.048 0.390 1.369 Machaerium stipitatum (DC.) Vogel CL Indiff. 45 8 1 38 0.521 0.102 0.187 0.607 Machaerium villosum Vogel CL Indiff. 22 4 1 19 1.136 0.044 0.233 1.326 Protium widgrenii Engl. CL Indiff. 18 5 1 14 0.196 0.061 0.066 0.202 Tapirira obtusa (Benth.) D.J.Mitch. CL Indiff. 37 18 0 19 1.023 0.414 0.190 0.798
For species authorities refer to Carvalho et al. 1995.
they all failed to reach a final slow growth plateau. The curves of the other 11 species were intermediate among the three growth models.
Sigmoid and exponential growth models were found in similar proportions within subcanopy, shade-tolerant canopy, and light-demanding canopy species. Quasi-linear models, however, were predominant among
understory species. With regard to the preferences for topographic sites, all models were equally distributed within the species groups. The species regeneration guilds were best discriminated with respect to their mean accelerated growth rates in diameter (expressed in mm.yr-1) in conjunction with the time spent to reach
Table 4. Growth in diameter of surviving trees for the 30 most abundant species in an area of tropical semideciduous forest surveyed in 1990 and 1997 in Bom Sucesso, Brazil. Regeneration guilds: US = understory; SS = subcanopy; CS = canopy/ shade-tolerant; CL = canopy/light-demanding. Mean growth = mean annual proportional growth rates; accel. growth = mean accelerated growth rates; mean time = time elapsed from diameter = 5 cm to maximum diameter projected by the simulated diameter trajectories under mean growth rates; accel. time = the same as above but under accelerated growth rates. Species ranked by regeneration guilds and maximum dbt.
Regeneration Maximum diameter Mean growth Accel. growth Mean time Accel.time
Species guilds (cm) (%) (mm.y-1) (yrs) (yrs)
Geonoma schottiana US 10.0 2.2 1.9 31.4 24.1
Trichilia pallida US 10.0 2.9 2.9 21.7 14.7
Guarea macrophylla US 12.5 1.6 2.4 55.5 29.6
Ocotea laxa US 12.5 3.2 3.6 28.9 21.5
Stylogyne ambigua US 12.5 1.8 2.0 56.6 40.2
Bauhinia longifolia SS 17.5 1.6 2.6 75.1 48.3
Dendropanax cuneatus SS 20.0 2.6 4.1 54.9 36.1
Galipea jasminiflora SS 20.0 2.5 3.7 56.7 41.7
Gomidesia affinis SS 20.0 2.9 4.2 45.1 35.7
Matayba juglandifolia SS 22.5 1.6 3.6 98.7 57.6
Myrsine umbellata SS 22.5 1.3 2.8 136.8 99.4
Trichilia pallens SS 22.5 2.2 5.1 69.2 37.2
Gymnanthes concolor SS 25.0 2.1 4.8 73.7 45.3
Esenbeckia febrifuga SS 25.0 1.9 3.4 82.2 59.5
Ixora warmingii SS 27.5 2.0 4.1 84.5 54.4
Mollinedia widgrenii SS 30.0 2.4 4.3 70.3 58.1
Metrodorea stipularis CS 25.0 3.3 5.5 46.6 36.6 Calycorectes acutatus CS 30.0 2.4 5.3 73.4 52.9
Marlierea racemosa CS 30.0 2.8 5.8 65.3 49.0
Cupania vernalis CS 32.5 1.7 5.3 107.0 62.2
Nectandra oppositifolia CS 32.5 2.0 5.3 79.3 69.1
Protium spruceanum CS 35.0 3.0 8.5 61.5 42.8
Calophyllum brasiliense CS 45.0 1.9 5.0 108.1 82.5 Copaifera langsdorffii CS 62.5 1.6 6.5 142.8 97.2
Protium widgrenii CL 30.0 3.1 8.5 79.2 45.3
Machaerium stipitatum CL 40.0 2.7 8.7 79.6 56.1 Machaerium nictitans CL 45.0 2.3 6.7 125.1 85.8
Tapirira obtusa CL 45.0 1.9 7.4 123.7 54.9
Connarus regnellii CL 52.5 2.3 9.0 121.3 93.6
Machaerium villosum CL 60.0 2.1 8.1 121.1 103.3
For species authorities refer to Carvalho et al. 1995.
subcanopy species showed slower growth rates, most below 5 mm.yr-1, while the growth of canopy species
ranged between 5 and 9 mm.yr-1. Understory and
subcanopy species, however, differed in their time span (after dbt t 5 cm), c. 14-40 yr and 35-100 yr,
respectively. Shade-tolerant and light-demanding canopy species did not differ in their time span, similar in range to that of the subcanopy species. On the other hand, they did differ in the slower growth rates of shade-tolerant canopy species, with the exceptions of Protium spruceanum and Copaifera langsdorffii.
Discussion
long-Machaerium villosum
Calophyllum brasiliense
Protium spruceanum
Calycorectes acutatus
Metrodorea stipularis
0 10 20 30 40 50 60
0 20 40 60 80 100 120 140
Matayba juglandifolia
0 20 40 60 80 100 120 140
Figure 2. Simulated diameter trajectories for 15 tree species surveyed in 1990 and 1997 in an area of tropical semideciduous forest, in Bom Sucesso, Brazil. The two curves in each graph are based on the mean (lower curve) and accelerated growth (upper curve) of the surviving trees.
Time (yr) Time (yr) Time (yr)
Diameter (cm)
Diameter (cm)
Diameter (cm)
Diameter (cm)
Diameter (cm)
term stability through the balance between mortality and recruitment/growth (Lieberman et al. 1985, Swaine et al. 1987, Rankin-de-Merona et al. 1990, Felfili 1995).
Dead and mutilated trees constantly open new spaces that are occupied by recruits and growing trees, resulting in the typical size distributions with the nearly logarithmic decline in number of trees (Swaine 1990, Brokaw 1996). In addition, mature undisturbed tropical forests generally show size-independent mortality for trees with diameters above 5-10 cm (Lieberman et al. 1985; Swaine et al.
1987; Swaine 1990). In the present case, however, tree size distributions changed by the thinning out of trees of the smallest diameter classes (dbt d 20 cm). Death events were so concentrated in this size class that, if it is removed, the overall picture of tree community dynamics changes to an expansion of both tree density and basal area.
Ixora warmingii
Trichilia pallens
Dendropanax cuneatus
Bauhinia longifolia
10 20
30 Stylogyne ambigua
Ocotea laxa
0 10 20 30
0 20 40 60 80
Geonoma schottiana
0 20 40 60 80
Trichilia pallida
0 20 40 60 80
Gymnanthes concolor
Figure 3. Simulated diameter trajectories for 15 tree species surveyed in 1990 and 1997 in an area of tropical semideciduous forest, in Bom Sucesso, Brazil. The two curves in each graph are based on the mean (lower curve) and accelerated growth (upper curve) of the surviving trees.
Time (yr) Time (yr) Time (yr)
Diameter (cm)
Diameter (cm)
Diameter (cm)
Diameter (cm)
Diameter (cm)
either recruitment/growth or mortality is increased (Swaine 1990, Felfili 1995). This oscillation is obvious on a scale of small forest patches because of local sylvigenetic cycles, but when it occurs over wider areas, climatic fluctuations may also be important (Phillips & Gentry 1994). Disturbance of various kinds is commonly the chief cause of forest instability and this may involve floods, windstorms, fire, landslides, drought, and human intervention (Condit et al. 1995, Laurance et al. 1998,
Whitmore & Burslem 1998, Gomes et al. 2003,
Damasceno Junior et al. 2004, Werneck &
The exceptional rains in 1992 did not only bring about a catastrophic flood that struck the Lower Sites but also had a long-lasting effect on the area through the unusually higher underground water supplies between 1992 and 1995. A higher availability of water in that period could have increased the growth of larger trees to the detriment of the smaller ones. If this was really the case, the difficulty here lies merely in the application of the arguable concept of disturbance (van der Maarel 1993, Sheil & Burslem 2003).
Although the interpretation above is consistent with the facts, we cannot disregard an additional hypothesis to explain the changes in the area. The c. 250-year-old
process of primary succession on the abandoned “catas” may be still going on. The thinning out process coupled with accumulation of basal area (or biomass) is frequently associated with building-up phases of forest regeneration. Although the process is best described for secondary forests (Gentry & Terborgh 1990, Oliveira Filhoet al. 1997, Werneck & Franceschinelli 2004), it
has been registered in some cases of primary succession on landslides (Guariguata 1990, Dahling & Tanner 1994) and floodplains (Foster et al. 1986, Salo & Räsänem
1990). One could argue that the process is too old and that stability may have been achieved long before present. Nevertheless, primary succession processes taking place on a scale of centuries are not an uncommon event in the tropics (Foster et al. 1986). There are many other
equally old “catas” in the region and most of them still have a high proportion of bare ground and no forest cover. Soil fertility and water seem to be critical in the early stages of primary succession following topsoil removal (Whitmore & Burslem 1998). In the studied area the whole succession process was probably favored by both base-rich sediments (derived from calcareous-gneiss parent material) and more abundant water supplies as compared to the poorly vegetated “catas”. Nevertheless, this gives no clue about when, or if, post-succession stability was reached. An aspect to be considered is that 250 years is not a long period if we consider that the mean age of canopy trees in moist tropical forests range between 100 and 600 yr (Fichtler
et al. 2003). In fact, the mean projected lifespan of the
species of larger trees in the study area ranged between 100 and 143 years, discounting the time spent to reach 5 cm diameter. In conclusion, if there is no evidence for or against an ongoing primary succession process, the hypothesis cannot as well be disregarded for absurdity. The 1992 catastrophic flood cannot be linked directly to the overall pattern of tree community dynamics involving decreasing density with increasing basal area
because the inundation only affected the Lower Sites. However, these changes differed significantly between the topographic sites with respect to the magnitude of some events, and this was most certainly indirectly related to the flood. The proportion of dead trees was higher in the flooded sites and growth rates of surviving trees were higher in the flood-free sites. Differences in tree mortality rates associated with elevation have already been registered for an alluvial forest after an extreme flood in the Brazilian Pantanal by Damasceno Junior et al. (2004). Soil waterlogging is known to
hamper plant metabolism due to the critical shortage of oxygen for respiration and reduced hydraulic conductivity of the root system (Joly 1991). The sediments deposited on stems and leaves by the floods bring additional limitations to plant growth as they obstruct both light capture and gas exchanges. This probably explains both the lower gain rates in the flooded areas as well as their higher proportion of dead trees, particularly among those of the smallest diameter class (5-10 cm). Tree growth was probably slowed down by the residing water in contrast to the flood-free elevations where the accumulation of basal area was unaffected. In addition, the risk of being killed by the flood was probably higher for smaller trees because they had comparatively more plant parts under water. Moreover, smaller trees are generally already stressed by light deficiency in the understory and any additional source of stress may increase their death rates.
Demographic changes and growth patterns of the 30 tree populations analyzed here showed very few trends that could be linked to the topographic sites and, by extension, to the 1992 flood. Indeed there was no Upper Sites species among the five declining in both density and basal area. Two of them, Protium spruceanum and Dendropanax cuneatus, were
preferential for Lower Sites and are both known for their high tolerance to soil saturation (Oliveira Filho & Ratter 1995, Gamerro & Zuloaga 1998). The other three,
Tapirira obtusa, Myrsine umbellata and Protium widgrenii, were indifferent to topography and are habitat
generalists that abound in riverine forests of the region (Botrelet al. 2002). In contrast, the remaining Lower
Sites species, Calophyllum brasiliense, Marlierea racemosa, Gomidesia affinis and Trichilia pallens,
variable extent. Therefore their response to the impact of the 1992 flood may vary accordingly. Also, the decline of some species may be caused by other factors. For instance, during the 1990 survey we observed that many trees of T. obtusa were decaying and highly infested by
a beetle larvae. Contrary to our initial hypotheses, the only two species that showed significant events that are probably related to flood impacts were both preferential for Upper Sites and common inhabitants of well-drained sites in the region (Oliveira Filho et al. 1994, Botrel et al. 2002). Dead trees of Ixora warmingii and the recruits
of Esenbeckia febrifuga were significantly more
frequent than expected in the flooded and flood-free sites, respectively.
Although we could hardly trace a few patterns of population dynamics related to the species distribution in the topographic sites, we also unexpectedly found a clear differentiation among species of particular regeneration guilds with respect to their demographic changes and diameter growth patterns. Firstly, all six light-demanding canopy species decreased in tree density while the other 24 (all shade-tolerant) were almost equally distributed between the decreasing and increasing (or no change) categories. This is coherent with the building up phase of forest regeneration already indicated by the overall thinning out process discussed above. The retreat or slower expansion of light-demanding relative to that of shade-tolerant species has already been associated to post-disturbance regeneration phases (Oliveira Filho
et al. 1997, Gomes et al. 2003, Werneck &
Franceschinelli 2004).
The three types of projected diameter growth trajectories,i.e. sigmoid, exponential and quasi-linear,
were also found in similar proportions among the tree populations analyzed by Condit et al. (1993) in BCI,
Panama, and by Chagas et al. (2001) in Lavras, SE
Brazil, both studies using the technique proposed by Conditet al. (1993). These three studies also registered
similar ranges of time span and growth rates and rare cases of strong late deceleration of growth rates.
When the relationship between maximum diameter, mean accelerated growth rates and time spent to reach maximum diameter was analyzed together (as in Lieberman et al. 1985), the four regeneration
guilds were clearly discriminated. Two regeneration guilds, understory and subcanopy species, coincided with those defined by Lieberman et al. (1985) and
Lieberman & Lieberman (1987) for the rainforest tree populations studied at La Selva, Costa Rica, using a different method for extracting the growth curves. As described by the above authors, understory species in
the study area also showed slow growth rates and short lifespans, resulting in a small diameter. In both cases, subcanopy species also show slow growth rates but longer lifespans, resulting in larger sizes. In the present case, understory species also scored higher turnover rates, expressed as both tree density and basal area, in consistency with their shorter lifespans. There was also a predominance of quasi-linear growth trajectories, which is coherent with a slow but steady growth in a shady environment. This quasi-linear slow growth in the forest understory was also observed in the early stages of some species that attain larger sizes, such as Protium widgrenii, Matayba juglandifolia
and Myrsine umbellata.
The shade-intolerant (pioneer) guild of Lieberman & Lieberman (1987) is missing from the 30 populations analyzed here as none of them combined fast growth with short lifespan. On the other hand, if we split the canopy species into shade-tolerant and light-demanding, these two categories would fall both into the shade-tolerant canopy species of Lieberman & Lieberman (1987) with perhaps some of them transferred to their subcanopy category. Nevertheless, our two categories were fairly well discriminated with respect to their growth rates. One of the two outliers, Copaifera langsdorffii, is probably a case of intermediate light
requirement, as already stated by Oliveira Filho et al.
(1997). Therefore we do believe there are ecologically meaningful differences in the growth strategies of the two categories of canopy species (see methods) and a good indication of their differentiation is that light-demanders often become emergent and their juveniles are comparatively rarer in the forest understory. Lastly, we shall point out that the maximum diameter reached by the tree species of this forest physiognomy may be used as a first clue to both their regeneration guilds and growth rates. Sound classifications, however, may be obtained through combining the method of Condit et al.
(1993) to project diameter growth trajectories with the graphic analysis of the species growth rates, maximum diameters and lifespans, as first used by Lieberman et al.
(1985).
References
BOTREL, R.T., OLIVEIRA FILHO, A.T., RODRIGUES, L.A. & CURI, N. 2002. Composição florística e estrutura da comunidade arbórea de um fragmento de floresta estacional semidecidual em Ingaí, MG, e a influência de variáveis ambientais na distribuição das espécies. Revista Brasileira de Botânica 25:195-213.
BROKAW, N.V.L. 1996. Trefalls: frequency, timing and consequences. In The ecology of a tropical forest: seasonal rhythms and long-term changes (E.G. Leigh, A.S. Rand & D.M. Windsor, eds.). Smithsonian Institution, Washington, p.101-108.
CHAGAS, R.K., OLIVEIRA FILHO, A.T., VAN DEN BERG, E. & SCOLFORO, J.R.S. 2001. Dinâmica de populações arbóreas em um fragmento de floresta estacional semidecidual montana em Lavras, Minas Gerais. Revista Árvore 25:39-57.
CARVALHO, D.A., OLIVEIRA FILHO, A.T., VILELA, E.A. & GAVILANES, M.L. 1995. Estrutura fitossociológica de mata ripária do alto Rio Grande (Bom Sucesso, estado de Minas Gerais). Revista Brasileira de Botânica 18:39-49. CONDIT, R., HUBBELL, S.P. & FOSTER, R.B. 1993. Identifying fast-growing native trees from the Neotropics using data from a large, permanent census plot. Forest Ecology and Management 62:123-143.
CONDIT, R., HUBBELL, S.P. & FOSTER, R.B. 1995. Mortality rates of 205 Neotropical tree and shrub species and the impact of a severe drought. Ecological Monographs 65:419-439.
DAHLING, J.W. & TANNER, E.V.J. 1994. An experimental study of regeneration on landslides in montane rain forests in Jamaica. Journal of Ecology 83:55-64. DAMASCENO JUNIOR, G.A., SEMIR, J., SANTOS, F.A.M.
& LEITÃO FILHO, H.F. 2004. Tree mortality in a riparian forest at Rio Paraguai, Pantanal, Brazil, after an extreme flooding. Acta Botanica Brasilica 18:839-846.
FELFILI, J.M. 1995. Growth, recruitment and mortality in the Gama gallery forest in central Brazil over a six-year period (1985-1991). Journal of Tropical Ecology 11:67-83. FICHTLER, E., CLARK, D.A. & WORBES, M. 2003. Age and
long-term growth of trees in an old-growth tropical rain forest, based on analyses of tree rings and 14C.
Biotropica 35:306-317.
FOSTER, R.B., ARCE, J.B. & WACHTER, T. 1986. Dispersal and the sequential plant communities in Amazonian Peru floodplain.In Frugivores and seed dispersal (A. Estrada & T. H. Fleming, eds.). W. Junk Publishers, Dordrecht, p.357-370.
GAMERRO, J.C. & ZULOAGA, F.O. 1998. Dendropanax affinis, nueva combinación y synopsis de las Araliaceae argentinas. Darwiniana 35:163-166.
GENTRY, A.H. & TERBORGH, J. 1990. Composition and dynamics of the Cosha Cashu ‘mature’ floodplain forest. InFour Neotropical rainforests (A.H. Gentry, ed.). Yale University Press, New Haven, p.542-564.
GOMES, E.P.C., MANTOVANI, W. & KAGEYAMA, P.Y. 2003. Mortality and recruitment of trees in a secondary montane rainforest in southeastern Brazil. Brazilian Journal of Biology 63:47-60.
GUARIGUATA, M.R. 1990. Landslide disturbance and forest regeneration in the Upper Luquillo mountains of Puerto Rico. Journal of Ecology 78:814-832.
GUILHERME, F.A.G., OLIVEIRA FILHO, A.T., APPOLINÁRIO, V. & BEARZOTI, E. 2004. Effects of flooding regimes and woody bamboos on tree community dynamics in a section of tropical semideciduous forest in South-Eastern Brazil. Plant Ecology 174:19-36.
JOLY, C.A. 1991. Flooding tolerance in tropical trees. InPlant life under oxygen deprivation: ecology, physiology and biochemistry (M.B. Jackson, D.D. Davies & H. Lambers, eds.). Academic Publishing, The Hague, p.23-34. JUNK, W.J. 1990. Flood tolerance and tree distribution in
central Amazonian floodplains. In Tropical forests: botanical dynamics, speciation and diversity (L.B. Holm-Nielsen, I.C. Nielsen & H. Balslev, eds.). Academic Press, London, p.47-64.
KELLMAN, M. & TACKABERRY, R. 1993. Disturbance and tree species coexistence in tropical riparian forest fragments. Global Ecology and Biogeography Letters 3:1-9.
LAURANCE, W.F., FERREIRA, L.V., RANKIN-DE-MERONA, J.M. & LAURANCE, S.G. 1998. Rain forest fragmentation and the dynamics of Amazonian tree communities. Ecology 79:2032-2040.
LIEBERMAN, D. & LIEBERMAN, M. 1987. Forest tree growth and dynamics at La Selva, Costa Rica (1969-1982). Journal of Tropical Ecology 3:347-358.
LIEBERMAN, D., LIEBERMAN, M., PERALTA, R. & HARTSHORN, G.S. 1985. Mortality patterns and stand turnover rates in a wet tropical forest in Costa Rica. Journal of Ecology 73:915-924.
METZGER, J.P., BERNACCI, L.C. & GOLDENBERG, R. 1997. Pattern of tree species diversity in riparian forest fragments of different widths (SE Brazil). Plant Ecology 133:135-152.
NAIMAN, R.J. & DÉCAMPS, H. 1997. The ecology of interfaces: riparian zones. Annual Review of Ecology and Systematic 28:621-658.
OLIVEIRA FILHO, A.T. & RATTER J.A. 1995. A study of the origin of central Brazilian forests by the analysis of plant species distribution patterns. Edinburgh Journal of Botany 52:141-194.
OLIVEIRA FILHO, A.T., MELLO, J.M. & SCOLFORO, J.R.S. 1997. Effects of past disturbance and edges on tree community structure and dynamics within a fragment of tropical semideciduous forest in south-eastern Brazil over a five year period (1987-1992). Plant Ecology 131:45-66. PHILLIPS, O.L. & GENTRY, A.H. 1994. Increasing turnover
through time in tropical forests. Science 263:954-958. RANKIN-DE-MERONA, J.M., HUTCHINGS, H.R.W. &
LOVEJOY, T.E. 1990. Tree mortality and recruitment over a five-year period in undisturbed upland rainforest of the Central Amazon. In Four Neotropical rainforests (A.H. Gentry, ed.). Yale University Press, New Haven, p.573-584.
SALO, J. & RÄSÄNEM, M. 1990. Hierarchy of landscape patterns in western Amazon. In Tropical forests: botanical dynamics, speciation and diversity (L.B. Holm-Nielsen, I.C. Nielsen & H. Balslev, eds.). Academic Press, London, p.35-45.
SCHNITZER, S.A. & CARSON, J.P. 2001. Treefall gaps and the maintenance of species diversity in a tropical forest. Ecology 82:913-919.
SHEIL, D. & BURSLEM, D. F. R. P. 2003. Disturbing hypotheses in tropical forests. Trends in Ecology and Evolution 18:18-26.
SHEIL, D. & MAY, R. 1996. Mortality and recruitment rate evaluations in heterogeneous tropical forests. Journal of Ecology 84:91-100
SHEIL, D., BURSLEM, D.F.R.P. & ALDER, D. 1995. The interpretation and misinterpretation of mortality rate measures. Journal of Ecology 83: 331-333.
SIEBEL, H.N. & BLOM, C.W.P.M. 1998. Effects of irregular flooding on the establishment of tree species. Acta Botanica Neerlandica 47:231-240.
SWAINE, M.D. 1990. Population dynamics of tree species in tropical forests. In Tropical forests: botanical dynamics, speciation and diversity (L.B. Holm-Nielsen, I.C. Nielsen & H. Balslev, eds.). Academic Press, London, p.101-110.
SWAINE, M.D., LIEBERMAN, D. & PUTZ, F.E. 1987. The dynamics of tree populations in tropical forest: a review. Journal of Tropical Ecology 3:359-366.
VAN DER MAAREL, E. 1993. Some remarks on disturbance and its relation to diversity and stability. Journal of Vegetation Science 4:733-736.
WERNECK, M. & FRANCESCHINELLI, E.V. 2004. Dynamics of a dry forest fragment after the exclusion of human disturbance in southeastern Brazil. Plant Ecology 174:337-346.
WHITMORE, T.C. & BURSLEM, D.F.R.P. 1998. Major disturbances in tropical rainforests. InDynamics of tropical communities (D.M. Newbery, H.H.T. Prins & N. Brown, eds.). Blackwell, Oxford, pp.549-565.
ZAR, J.H. 1996. Biostatistical analysis, 3rd ed. Prentice-Hall,