regional committee
PAN AMERICAN
HEALTH
ORGANIZATION
XIV Meeting
Washington, D. C.
September 1963
.-
~~~~~~~~~~~~~
· . v~~~~~~~~~~~~~~~~ .·~~~~im
WORLD
HEALTH
ORGANIZATION
XV Meeting
Draft Agenda Item 23
CD14/16 (Eng. )
8 August 1963
ORIGINAL: ENGLISH-SPANISH
REPORT ON THE STATUS OF MALARIA ERADICATION IN THE AMERICAS
XI REPORT
TABLE OF CONTENTS
Page
Introduction ...
I. Status of the Malaria Eradication Program ...
A. General picture .. . . . ..
B. Extent of the Problem ...
C. Field Operations ...
II. Special Technical Problems ...
A. General ...
B. Physiological resistance of anophelines to insecticides ...
C. Irritability ... ...
D. Sorption of Insecticides ... . . . ... ...
E. Types of construction of houses ...
F. Migration...
G. Solutions to problems of continuing transmission ...
1. Mass drug administration ... 2. Chloroquinized Salt Programs ...
3. Anti-larval work . . . ..
III. Research on Malaria ...
A. Screening Center for Drug-resistant Malaria Parasites ....
B. Epidemiological Field Studies - AMRO-220 ...
C. Insecticide Testing Program - AMRO-196 ... D. Economics of Malaria Eradication - AMRO-250 ...
IV. International Cooperation ...
3
3
3
5
8
34
34
36
36
37
37
37
38
38 38 39
39
39
40
40
41
MAPS AND TABLES
Maps: Page
1. Status of the Malaria Eradication Program in the Americas,
31 December 1962 ... 1
2. Status of the Malaria Eradication Program in the Americas,
31 December 1961 ... ... ... 2
Tables:
1. Comparison of Population and Areas in various phases of the Malaria Eradication Program in the Americas, in 1961 and 1962, and
Percentages of change in each phase ... 4
2. Progress in Malaria Eradication Programs in the Americas ... 5
3. Status of Malaria Eradication in the Americas, by Population, 1962 .... 6
4. Status of Malaria Eradication in the Americas, by Area, 1962 ... 7
5. Percentage Distribution of Population and Area in the Americas, 1962 by Status of Malaria Eradication ...
6. Personnel Employed in Malaria Eradication Programs in the Americas
31 December 1961 and 1962 by Category ... 10
7. Personnel Employed in Spraying Operations in Malaria Eradication
Programs in the Americas - 31 December 1962 ... 11
8. Personnel Employed in Epidemiological Evaluation in Malaria
Eradication Programs, in the Americas, 31 December 1962 ... 12
9. Personnel Employed in Administrative Services and Others in Malaria
Eradication Programs in the Americas, 31 December 1962 ... 13
10. Personnel Employed in Transport Services in Malaria Eradication
Programs in the Americas - 31 December 1962 ... 14
11. Means of Transport in Malaria Eradication Programs in The Americas,
1962 ... 15
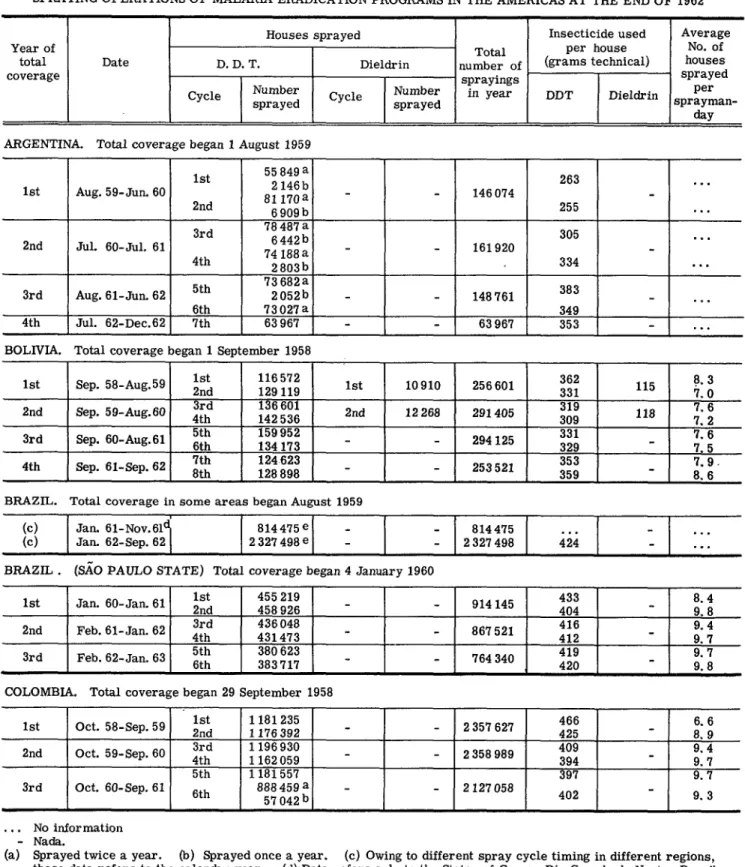
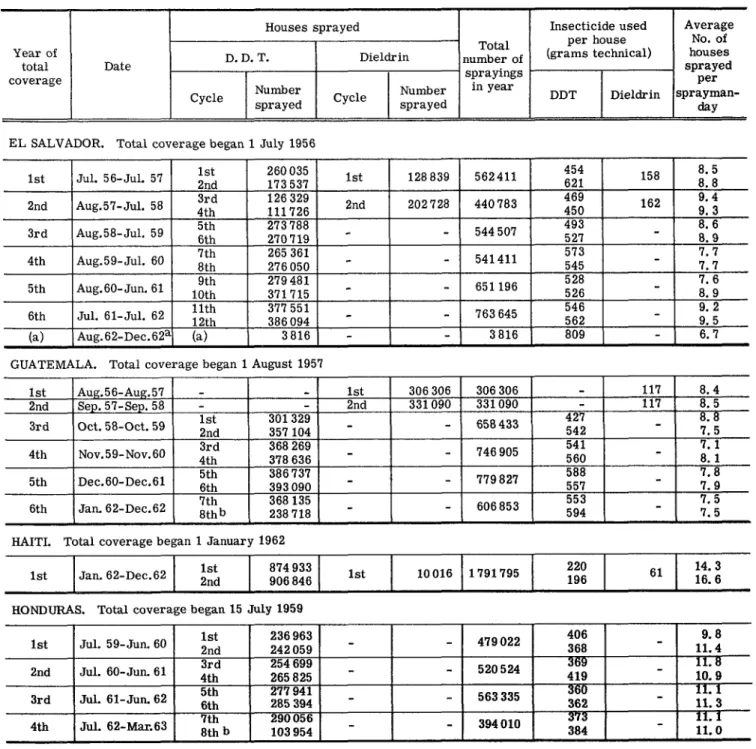
12. Spraying Operations of Malaria Eradication Programs in the Americas
at the end of 1962 ... 16
13. Spraying Achievements of Malaria Eradication Programs in the Americas at the end of 1962 ... 21
14. Case detection During the Attack Phase in Malaria Eradication Programs
in the Americas ... 25
15. Case detection During the Consolidation Phase in Malaria Eradication
MAPS AND TABLES (Cont.)
Tables: Page
16. Comparative Results of Active and Passive Case Detection in
Malaria Eradication Programs in the Americas, 1962 ... 33
170 Summary of Case Detection in the Americas, 1958-1962 ... 34
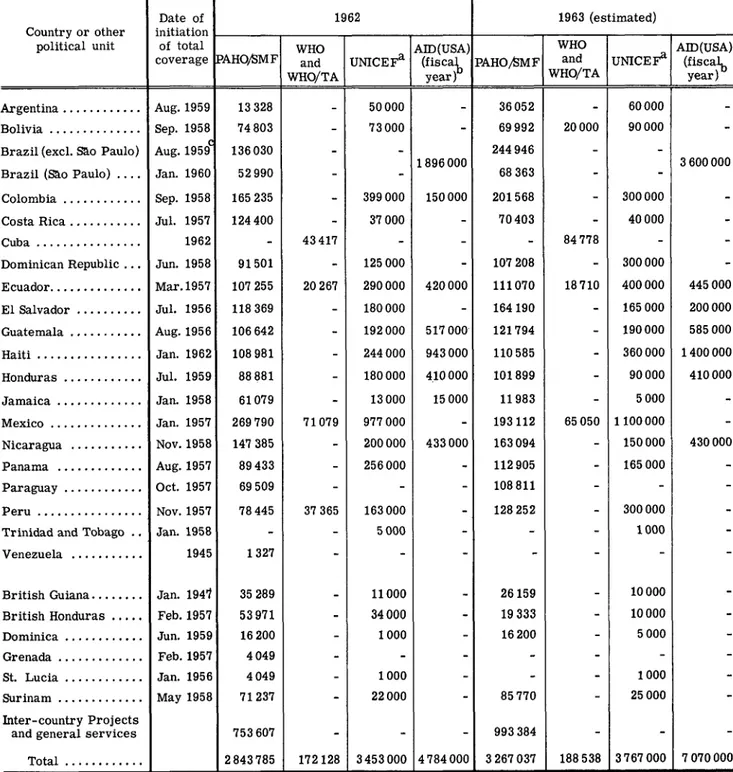
18. National Budgets for Malaria Eradication in the Americas, 1961-1963 35
19. PASB/WHO Full-time Professional and Technical Staff Assigned to Country, Inter-Country and Inter-Zone Malaria Eradication Projects
in the Americas, 1960 to April 1963 ... ... 43
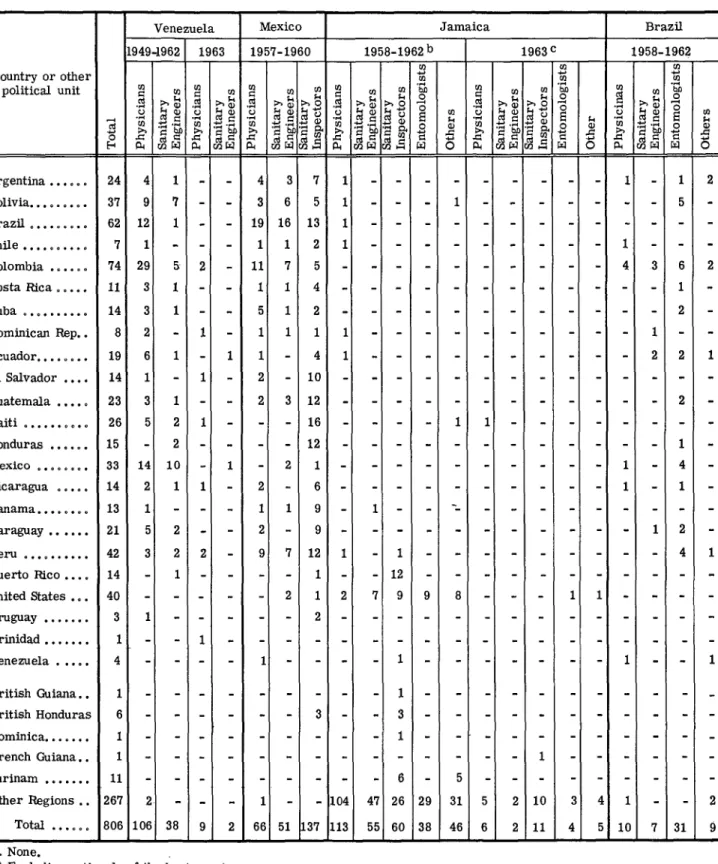
20. Personnel Trained in Malaria Eradication Techniques at International
Centers, 1949-1962 and First Semester of 1963 ... 44
21. Fellowships for Study Travel in Malaria Eradication, 1961 and 1962, 45
22, Equipment and Supplies, Excluding Drugs, Contributed by PAHO to
Malaria Eradication Programs in the Americas, 1958 to December 1962 46
23. Drugs Provided for Malaria Eradication Programs in the Americas by
PAHO, 1958-1962 ... ... ... 47
24. International Contributions to Malaria Eradication Programs in the
CD14/16 (Eng.)
Page 1
UNITED STATES
:,
BAHAMA ISLANDS
CAICS, TURKS BERMUDA
BRITISH VIRGIN ISLANDS U.S. VIRGIN ISLANDS
/AHUILU
'·~
~~"
'_ t, /~~~~~~~~~~~ST. NEVS, ISCUBA
of
'"~G
MEXICO
/AEIXUc
DO
A'^
DOMINICAN
REP.
GUADELOUPE
BR . HONDURAS ' DOMINICA
PICARAGUA
ST. VnICENT
AREASWHEEMALARIA HASBEEERADIATEDAERBADOSN
COSTA
RIC
BRUIAA
REHADA
3 AREAS
TIN
THE CONSOLIDATION PHDSE,
COLOMBIA
:TOBAG
ECUADOR
NOTREAS
REACHED
WHERE MALARIAH
D
N
E XADIATS
B
PERUt~J
BOLIVIASE
-~l AREAS WHERE THE CONSOLIDATION PHASE HAS
so,'MAP
NO
I
NOT
BEEN
REACHED AND WHERE MALARIA EXISTS
JLV.
CD14/16 (Eng.)
Page 2
CD14/16 (Eng. ) Page 3
REPORT OF THE STATUS OF MALARIA ERADICATION IN THE AMERICAS
XI REPORT
Introduction
The Director of the Pan American Sanitary Bureau has the honor to present to the XIV Meeting of the Directing Council the )XI Report on the status of malaria eradication in the Americas.
This report follows the same pattern as the previous ones, and is divided in four chapters: the status of the program in general; the special technical problems that have been found;the field research projects; and the international cooperation in the malaria eradication program.
The data have been taken from the response to a detailed annual questionnaire regarding malaria eradication activities in each country, as well as the statistical report which the majority of the programs submit each month to the Pan American Sanitary Bureau. In addition special technical reports regarding research projects are also presented by the countries when appropriate.
I. STATUS OF THE MALARIA ERADICATION PROGRAM
A. General picture
Further progress towards malaria eradication was achieved in the Americas during 1962. The attack phase was completed in British Honduras, Jamaica and in Trinidad and Tobago. These areas are now entirely in the consolidation phase. Both Jamaica and Trinidad have been without autochthonous cases for two years or more.
Additional areas placed in the consolidation phase during 1962 were reported byArgentina, Bolivia, Brazil, Colombia, Costa Rica, Guatemala, Honduras, Mexico, Nicaragua, Peru, Venezue-la, Dominica, Guadeloupe, Panama Canal Zone and Surinam. While the population living in areas under consolidation in 1961 was 17. 9 millions, in 1962 it went up to 30. 4 millions.
In more advanced stages, Grenada and Carriacou, and St. Lucia terminated their consoli-dation phase activities, while Venezuela and Guadeloupe claimed to have new areas where malaria has been eradicated. The islands of Grenada and Carriacou and of Saint Lucia were registered during 1962, by the Pan American Sanitary Bureau as having achieved malaria eradication.
In order to give a rapid over-all picture of the changesbetween 1961 and 1962, Table No. I is presented, indicating not only the population and area in each phase of eradicationbut the percent-ages of increase or decrease for 1962 in comparison with the same figures for 1961.
It can be observed that while the areas and population claimed or registered as having malaria eradication increased, there was a reduction in areas under attack and in population un-der the preparatory phase. The increase of population unun-der attack concomitantly with a decrease of the area under the same condition can be explained by the fact that more densly populated areas a) remained in, or b) entered this phase during 1962. a) In Central America, for example, the densely populated areas remained in the attack phase while sparsely settled ones left it to enter the consolidation phase. The same phenomenon has been observed in other countries. b) In Brazil, on the other hand, the Amazon Valley, a large but thinly populated area, reverted from attack to pre-paratory phase when the chloroquinized salt program ended, and the area is being gradually put under conventional attack, the more densely populated areas first, as a rule.
CD14/16 (Eng.) Page 4 Table 1
COMPARISON OF POPULATION AND AREAS IN VARIOUS PHASES OF THE MALARIA ERADICATION PROGRAMS IN THE AMERICAS, IN 1961 AND 1962, AND PERCENTAGES
OF CHANGE IN EACH PHASE
Originally malarious areas 1961 1962 Percentage
change
A. Population by thousands:
1. Malaria eradication claimed or registered .... 56 979 59 299 + 3. 9
2. Consolidation phase ... 17 379 30 424 + 70. 0
3. Attack phase ... 39 021 49 276 + 26. 3
4. Preparatory phase or not yet started ... 33 413 14 743 - 55.7
B. Area in km2
1. Malaria eradication claimed or registered .... 2 838 501 3 248 027 + 14. 4 2. Consolidation phase ... ... 1465 681 2 061 162 + 40. 6
3. Attack phase ... 7 710194 5 633 761 - 27. 0
4. Preparatory phase or not yet started ... 3853 835 5 167 795 + 34. 1
Various setbacks either continued or developed during 1962. In Paraguay the attack phase has been paralized since late 1960. In Argentina the attack phase could not be extended to the Pro-vinces of El Chaco and Formosa as had been scheduled. In Dominican Republic a new drive to total coverage started in October, but could not be extended to the whole malarious area until the end of the year. The same occurrence was reported in Cuba where very large areas have been under attack phase since May 1962, but total coverage with regular 6 month cycles of spraying of all houses in the recognized malarious area has not yet been achieved.
Most of the problems faced by these countries are classified as administrative. The pri-mary and most important one was the lack of economic resources to cover the local costs and/or to obtain materials and equipment to fulfill the requirements as planned.
The further evolution of the attack phase and some improvements in epidemiological ope-rations have made it possible to delimit, with more presicion, the areas with definite persistence of transmission due to technical problems. Such areas are considered to be those where a well administered program of DDT or dieldrin spraying of the houses alone has not interrupted trans-mission of malaria in a reasonable period. In some of these areas DDT definitely has shown some capacity to reduce transmission but not enough to halt it completely.
Every year it is becoming clearer that campaigns to eradicate malaria require not only an organization of highly skilled workers armed with administrative techniques of great flexibility but also with sufficient priority in the allocation of available funds in spite of the demands of other agencies of the government.
The experience of 1962 has shown again that progress is seriously hampered in countries with poor administrative set up. Only in the light of such experience is it conceivable that very large areas without technicalproblems are not yet free of transmission after four years of reported regular spraying.
In April 1963, a meeting of Ministers of Health, Task Force for Health of the Alliance for Progress, took place in Washington, D. C. They recommended that malaria eradication should be given the highest, the very first priority among the programs of health for the Americas. It is hoped that the Ministers andDelegates present and their respective Ministers of Finance will follow the same policy in the allocation of funds for health in the future.
CD14/16 (Eng.) Page 5
Honduras, and Nicaragua, and in a few very small foci in Costa Rica, but these are amenable to supplementary or alternative methods of attack which have been expanded considerably during 1962 - (see Special Tehcnical Problems). In South America, DDT resistance has not been observed on any significant level, but outdoor biting and resting appear to be part of the problem in Western Venezuela and in parts of Colombia, together with new houses, houses with poor or missing walls, and considerable migration from poorly controlled to well controlled areas. Brazil also has some areas where various species of the sub-genus Kerteszia maintain transmission by biting and resting out of doors. These are relatively small, and transmission is not intense, but mass drug treatment programs are being started in the expectation of perfecting a method of cleaning them up completely.
Chloroquine-tolerant strains of P. falciparum have been identified in additional localities in Brazil, Colombia, and now British Guiana, and a Screening Center has been established by PAHO and the Brazilian Government in Brazil to identify new strains and measure their tolerance. So far, drug-tolerant strains have not shown much tendency to spread, and the number of cases is small, even in Venezuela, where chloroquine-tolerant strains have been known since 1959.
While waiting for a perfect new insecticide, or a perfect long-lasting antimalarial drug, these technical problems demand a careful selection and usage of all classical anti-malaria methods and a higher degree of sophistication in planning and execution than routine operations in the areas where these problems are lacking. Solutions already exist, but better insecticides, and better methods of using existing insecticides are being intensively sought.
B. Extent of the Problem
At the present stage, many programs in the Americas should be in the process of moving from attack into consolidation phase, and relatively few into the maintenance phase. Table No. 2 that follows briefly recapitulates the progress during the last 3 years:
Table 2
Population
Malaria Annual % of Increase
Year eradication Consolidation Malaria
claimed or phase eradication Consolidation
achieved claimed phase
1959 53 251000 2 156 000
-1960 54 365 000 10 010 000 2.1 364.
1961 56 279 000 17 879 000 3.5 78.6
1962 59 299 000 30 424 000 5.5 70.2
Thus 90 million out of a population of 153,919,000 in the originally malarious area arepast the attack phase, while 49,276,000 are in it and 14,743,000 are still in the preparatory phase. 1
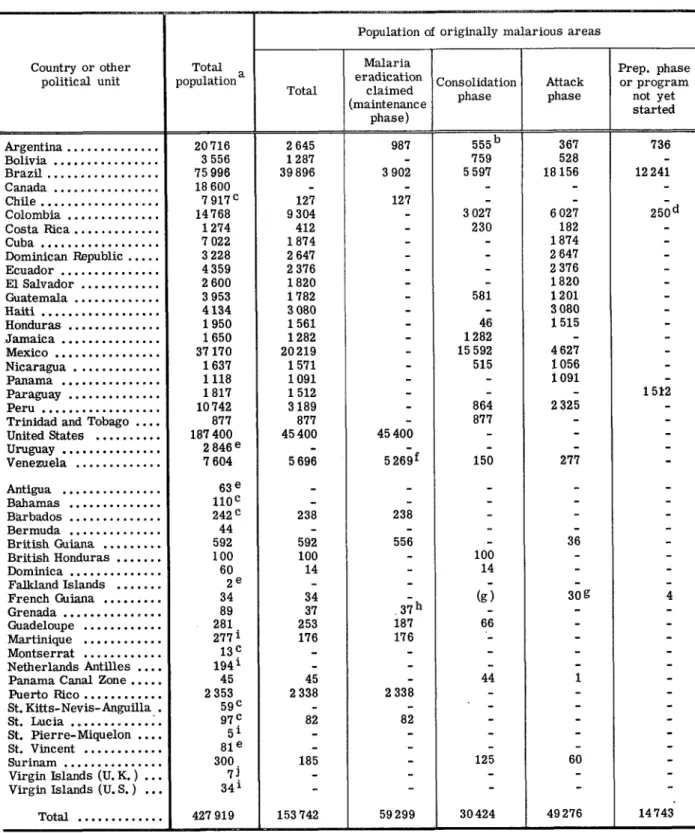
Tables 3 and 4 show the status of the program in each country by population and by area, as to totals, and as to the portions of the originally malarious areas which are in the various stages of the campaign.
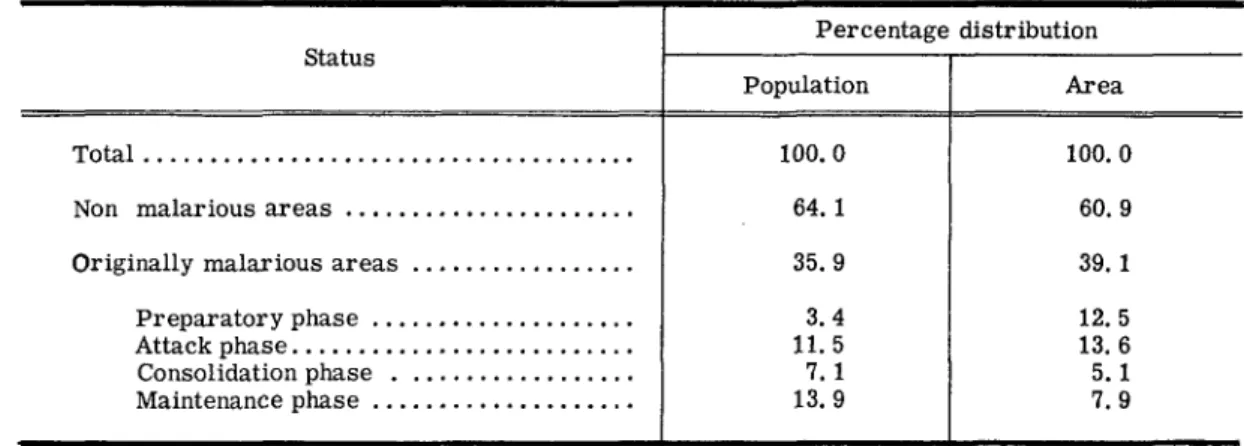
Table 5 summarizes this breakdown into stages showing percentages of the total population and area in each stage or condition.
Map No. 1 visually presents the situation as it existed on December 31, 1961 in all former-ly and presentformer-ly malarious countries, and Map No. 2 the situation one year later.
CD14/16 (Eng.)
Table 3 Page 6
STATUS OF MALARIA ERADICATION IN THE AMERICAS, BY POPULATION, 1962
(Population in thousands)
Population of originally malarious areas
Country or other Total Malaria Prep. phase
political unit populationa eradication Consolidation Attack or program
po
Total claintmed nphase phase not yet
(maintenance started
phase)
Argentina ... 20 716 2 645 987 5 5 5b 367 736
Bolivia ... 3 556 1 287 - 759 528
Brazil ... 75 996 39 896 3 902 5 597 18156 12 241
Canada ... 18 600
Chile ... 7 9 1 7c 127 127 -
-Colombia ... 14768 9304 - 3027 6027 2 5 0d
Costa Rica ... 1 274 412 - 230 182
Cuba ... 7 022 1874 - - 1874
Dominican Republic ... 3 228 2 647 - - 2 647
-Ecuador ... 4359 2 376 - - 2 376
El Salvador ... 2600 1820 - - 1820
Guatemala ... 3 953 1782 - 581 1201
Haiti ... 4134 3 080 - - 3080
Honduras ... 1 950 1561 - 46 1515
Jamaica ... 1650 1282 - 1282
Mexico ... 37 170 20219 - 15 592 4 627
Nicaragua ... 1637 1571 - 515 1056
Panama ... 1118 1091 - - 1091
Paraguay ... 1817 1512 - - - 1 512
Peru ... 10742 3189 - 864 2325
Trinidad and Tobago .... 877 877 - 877
-United States ... 187 400 45 400 45 400
-Uruguay ... 2 846 e
Venezuela ... 7604 5696 5 269f 150 277
Antigua ... 63 e
Bahamas ... 1 1 0c
Barbados ... 2 4 2c 238 238
Bermuda ... 44 -
-British Guiana ... 592 592 556 - 36
British Honduras ... 100 100 - 100
-Dominica . ... 60 14 - 14 -
-Falkland Islands ... 2 e
French Guiana ... 34 34 (g) 3 0g 4
Grenada ... 89 37 3 7h
-Guadeloupe ... 281 253 187 66
-Martinique ... 277i 176 176 - -
-Montserrat ... 13 c
Netherlands Antilles 194....
-Panama Canal Zone ... 45 45 - 44 1
Puerto Rico ... 2 353 2 338 2 338 -
-St. Kitts-Nevis-Anguilla. 5 9C -
-St. Lucia ... 9 7c 82 82 - -
-St. Pierre-Miquelon .... 5 -
-St. Vincent ... 81 e
Surinam ... 300 185 - 125 60
Virgin Islands (U. K.) ... 7 - -
-Virgin Islands (U. S. ) ... 34 - - - -
-Total ... 427 919 153 742 59299 30424 49276 14743
- None
CD14/16 (Eng.)
Page 7 Table 4
STATUS OF MALARIA ERADICATION IN THE AMERICAS, BY AREA, 1962 (Area in km 2 )
Originally malarious area
Country or other political unit Total Malaria
Prep. phase political unit
area eradication Consolidation Attack or program
Total claimed phase phase not yet
(maintenance started
phase)
Argentina ... Bolivia ... Brazil ... Canada ... Chile ... Colombia ... Costa Rica ... Cuba ...
Dominican Republic ... Ecuador ... El Salvador ... Guatemala ... Haiti ... Honduras ... Jamaica ... Mexico ... Nicaragua ... Panama ... Paraguay ... Peru ... Trinidad and Tobago .... United States ... Uruguay ... Venezuela ...
Antigua ... Bahamas ... Barbados ... Bermuda ... British Guiana ... British Honduras ... Dominica ... Falkland Islands ... French Guiana ... Grenada ... Guadeloupe ... Martinique ... Montserrat ... Netherlands Antilles .... Panama Canal Zone ... Puerto Rico... St. Kitts-Nevis-Anguila.. St. Lucia ... St. Pierre-Miquelon .... St. Vincent ... Surinam ... Virgin Islands (U. K.).... Virgin Islands (U. S)...
Total ...
4 024 458 a 1098581 8 513844 9974375 741767 1 138 338 51011 114524 48442 291906 21146 108889 27698 112088 11293 1969367 148000 74470 406752 1381800 5080 9339900 186 926 912 050 280 11396 431 53 215800 22 965 790 11961 86000 344 1779 1102 84 961 1432 9216 396 603 240 389 142 822 174 342 41212265 349 051 824 260 7 338 759
55 287 1 026 433 31 526; 37 376; 39 000 152 86x2
19 300 80 364 18 984 87 389 9 919 1 147 564 132 385 68 497' 406 752 943 200 5 080 2 255 890
600000
430
215 800 22 965 152 86 000 104 1 136 300 1 432 9216 580 142 752 16 110745 40 100 437 059 55287 2255890
432 44 0d
430 15800 104 821 300 9216 580
3 248 027
51 896 b 297489 482727 37 418 21979 33113 5489 9 919 855979 102 556 74 200 5080 54103 22 965 152 315 1432f 4350
2 061 162
100989 526771 1 853 996
949015 9 547 37 376 39000 152862 19300 47251 18 984 81900 291585 29829 68 497 869000
113 457
200000
86000e
(f)
138402
5633761
h h i h h
156 066
4 564 977
40 000 c
406 752
(e)
5167795
- None
CD14/16 (Eng.) Page 8
Table 5
PERCENTAGE DISTRIBUTION OF POPULATION AND AREA IN THE AMERICAS, 1962 BY STATUS OF MALARIA ERADICATION
Percentage distribution Status
Population Area
Total ... 100. 0 100. 0
Non malarious areas ... 64. 1 60. 9
Originally malarious areas ... 35. 9 39. 1
Preparatory phase ... 3. 4 12. 5
Attack phase ... 11.5 13.6
Consolidation phase ... 7.1 5.1
Maintenance phase ... 13. 9 7. 9
C. Field Operations
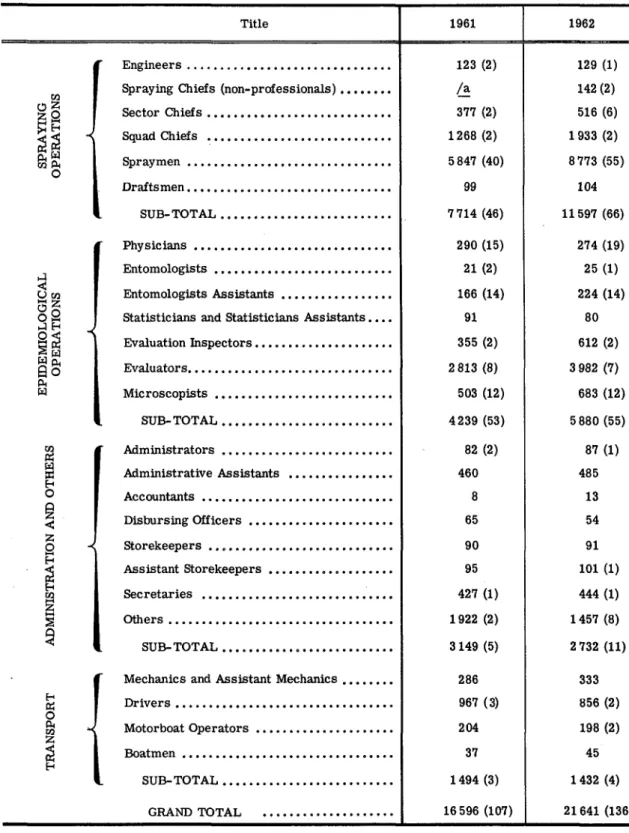
Statistics on the personnel employed in malaria eradication programs are presented in Tables 6 to 10. Table 6 shows the personnel employed in broad categories of spraying operations, epidemiological operations, administrative and others, and transport during the last 2 years. The increase in personnel in spraying operations is a reflection of the 27% increase in population in the attack phase, plus some instensification of spraying effort, and the increase in personnel working in epidemiological evaluation is also due to larger population inthe consolidation phase plus intensified efforts. Reductions have been made in administrative and transport personnel.
Tables 7 through 10 show the personnel employed in each country for the year 1962 in the 4 broad categories listed, and in each sub-class of workers.
The types of vehicles and numbers of each are shown by country for the year 1962 in Table 11. There has not been much change from year to year, but with increasing epidemiological evaluation and drug distribution activity, there is increasing need for single passenger transport, and increasing use of motorcycles and bicycles is foreseen for these types of personnel. The ex-perimental use of motorcycles in Guatemala has shown their utility and economy, and proved that in the hands of responsible and well-trained personnel they can carry the evaluator or inspector through difficult terrain on the average as effectively though less confortably than 4-wheel vehicles. Transportation remains an absolute essential in all programs, and the Organization continues its advisory service in this field.
The work done in spraying operations is shown in Tables 12 and 13, by countries, for each cycle since the beginning of the program. Table 12 shows the absolute work performed in total, and per man/day of effort, while Table 13 shows the relative completeness of the spraying operations and reasons for not spraying some of the houses. Again, the Bush Negro population in the interior of Surinam (18, 000 persons) presented an exceptional proportion of refusals and absences, (more than 50% in some sectors) but great improvement has already been made through the changing from DDT to dieldrin (the latter is preferred by the people), and intensive health education efforts are in progress to win their cooperation. Malaria has disappeared wherever good spraying has been achieved.
Case detection data are separated into two parts, data for the attack phase, and data for the consolidation phase.
CD14/16 (Eng.) Page 9
bias in the percentage for the country as a whole. In several countries, sampling of small but highly malarious problem areas was far above that of the rest of the country. For example, in the worst two cantons of Costa Rica, the sampling rate for the Vth year of coverage was 190 and 123% of the population per year, whereas 10% is the usual. In an epidemic area in Honduras, among 5, 667 persons, 2,025 slides were taken in the last 3 months of 1962. Of these, 42% were positive. This 143% (per year) sampling rate in a bad area has a profound effect on the average positivity rate for the country as a whole when these figures are mixed with the vast majority of the country which has few or no cases, but which is sampled at 10% or less per year.
The current attack phase in Ecuador is considered to have begun in January 1961, and is much more complete than previous cycles.
There are several countries where sizeable groups of population have been removed from the attack phase and placed under consolidation. This has the net effect of reducing the apparent speed of improvement seen in parasite rates in Table 14 by taking away from the total population measured, those groups who have the least malaria. In Guatemala and Mexico, for example, the deletion of the population that went into consolidation would more than account for the reversal of the downward trend. In Mexico, this apparent upward trend in the attack area has continued for 2 years, each year more positive slides obtained from fewer slides taken. But in each year the group from which the slides were drawn has grown smaller, and the search for cases more intense among those "more malarious" persons remaining in the attack phase. These two factors consti-tute the major elements in the trend seen, a stabilizing in the problem areas, no further advance, but at the same time, no evidence of slipping back, even in the face of the data presented.
In Honduras and British Guiana, however, there were major outbreaks in quite limited areas which accounted for the large majority of the cases in the whole country, and the general trend in the rest of the attack areas remained very favorable. In the second semester of 1962, 62% of the cases in Honduras occurred in 2 departments, highly concentrated in 2 municipios. Eliminating these two municipios would practically wipe out the rise noted in 62-63, although there was another force artificially pushing rates upward, i. e. 1/3 of the healthiest groups of population were in fact taken out of calculation for the 9 months July 62-March 63, and put into consolidation.
The analysis of Table 15 is considerably simpler. The reductions in population in the consolidation phase in Venezuela, and Guadeloupe are due to passage of large sections into the maintenance phase. One significant column is the percentage of population sampled, which was generally adequate or improving. In this respect, areas with unstable malaria or seasonaltrans-mission are not required to have 10% sampling. The number of cases was properly low in most instances and the indigenous cases very low or absent. Mexico and Guatemala have difficult prob-lems with extensive migration from the cleared areas to the problem areas and back again. In Me-xico, this more often results in secondary transmission, so some of the areas have been put back under attack. In Guatemala, the consolidation areas so far are at altitudes with relativelylow trans-mission potential. As consolidation areas expand, the risk of indigenous cases following imported cases will rise,and requires a more vigorous surveillance organization.
Table 16 presents the comparative results of active vs. passive case detection The latter, as frequently noted in the past, is more productive of positives per slide examined, and requires much less paid personnel to maintain it. Passive notification posts have been seen to be most effective and most valuable when they consist of or exist in hospitals, health centers and clinics. Not only is it important that sick persons be given a test for malaria at the time when they are sick, but in the maintenance phase, all detection activity will have to be done by the health department. Plans have been made for further stimulation of cooperation between these two agencies in every country.
The steady growth in size of case-finding activity in malaria eradication is seen in the hemispheric figures of Table 17, and its importance will increase in the future as more and more areas enter into consolidation.
CD14/16 (Eng.)
Table 6 Page 10
PERSONNEL EMPLOYED IN MALARIA ERADICATION PROGRAMS IN THE AMERICAS 31 DECEMBER 1961 AND 1962 BY CATEGORY
(Part-time personnel in parenthesis)
Title 1961 1962
Engineers ... 123 (2) 129 (1)
Spraying Chiefs (non-professionals) ... /a 142 (2)
5
2
Sector Chiefs ... 377 (2) 516 (6)~ ¢Squad Chiefs ... 1268 (2) 1933 (2)
En P Spraymen ... 5 847 (40) 8 773 (55)
O
Draftsmen ... 99 104
SUB-TOTAL ... 7... 7714 (46) 11597 (66)
Physicians ... 290 (15) 274 (19)
Entomologists ... 21 (2) 25 (1)
U Entomologists Assistants ... 166 (14) 224 (14)
0 - Statisticians and Statisticians Assistants .... 91 80
Evaluation Inspectors ... 355 (2) 612 (2)
O Evaluators ... 2813 (8) 3982 (7)
Microscopists ... 503 (12) 683 (12)
SUB-TOTAL ... 4239 (53) 5880 (55)
0n Administrators ... 82 (2) 87 (1)
Administrative Assistants ... 460 485
O Accountants ... 8 13
Disbursing Officers ... 65 54
Z
o
Storekeepers ... 90 91Assistant Storekeepers ... 95 101 (1)
co ..Secretaries .427 (1) 444 (1)
Others ... 1922 (2) 1457 (8)
SUB-TOTAL ... 3 149 (5) 2 732 (11)
Mechanics and Assistant Mechanics ... 286 333
Drivers ... 967 (3) 856 (2)
MP4 Motorboat Operators ... 204 198 (2)
Boatmen ... ... 37 45
SUB-TOTAL ... 1494 (3) 1432 (4)
GRAND TOTAL ... 16 596 (107) 21 641 (136)
a a
CD14/16 (Eng.)
Page 11 Table 7
PERSONNEL EMPLOYED IN SPRAYING OPERATIONS IN MALARIA ERADICATION PROGRAMS IN THE AMERICAS - 31 DECEMBER 1962
(Part-time personnel in parentheses)
Sanitarians
Country or other Total Engineers or Sector Squad Chiefs Spraymen Draftsmen
political unit Spraying Chiefs
Chiefs
Argentina ... 172 2 6 10 29 121 4
Bolivia ... 47 5 8 - 9 25
Brazil (excl. Sao Paulo) 4 013 23 - 189 679 3122
Brazil (Sao Paulo) .... 660 8 - 18 111 505 18
Colombia ... 863 7 30 45 59 705 17
Costa Rica ... 61 1 1 6 10 42 1
Cuba ... 458 2 4 19 71 360 2
Dominican Republic.. 455 3 - 18 68 366 ...
Ecuador ... 614 (24) 7 1 27 (4) 106 472 (20) 1
El Salvador ... 7 1 - - 1 4 1
Guatemala ... 444 2 4 15 59 361 3
Haiti ... 777 6 6 23 116 618 8
Honduras ... 196 - 4 9 32 151
-Jamaica ... 99 - 4 16 43 36
-Mexico ... 1156 49 65 51 258 715 18
Nicaragua ... 203 1 3 8 34 156 1
Panama ... 289 1 5 10 47 225 1
Paraguaya ... 33 3 - 2 18 4 6
Peru ... 469 7 - 19 81 352 10
Trinidad and Tobago .. 15 _ - - 1 10 4
Venezuela ... 411 1 - 20 65 317 8
British Guiana ... 16 - ; 1 5 10
-Dominica ... 1 - - -
-French Guiana ... 25 (15) - - - 9 16 (15)
-Guadeloupe ... 37 - - 1 6 30
Panama Canal Zone... (27) (1) , (2) (2) (2) (20)
Surinam ... 76 - - 9 16 50 1
Total ... 11597 (66) 129(1) 142 (2) 516 (6) 1933 (2) 8 773 (55) 104
... No information.
- None.
Table 8
PERSONNEL EMPLOYED IN EPIDEMIOLOGICAL EVALUATION IN MALARIA ERADICATION PROGRAMS IN THE AMERICAS, 31 DECEMBER 1962
(Part-time personnel in parentheses)
Statisticians Microscopists
Country or other Entomologists and Evaluation and Laboratory
Total Physicians Entomologists Evaluators
political unit Assistants Statisticians Inspectors Personnel
Assistants
Argentina ... 156 8 1 3 2 18 99 25
Bolivia ... 208 6 - 6 6 30 138 22
Brazil (excl. Sao Paulo).. 1001 40 8 18 - 155 643 137
Brazil (Sao Paulo) ... 238 14 1 11 1 31 126 54
Colombia ... 625 32 1 7 5 60 468 52
Costa Rica ... 88 1 - 2 1 4 69 11
Cuba ... 32 8 1 3 3 - 9 8
Dominican Republic ... 29 3 - 2 - 2 15 7
Ecuador ... 150 10 1 9 - 13 87 30
El Salvador ... 110 3 - 2 2 6 78 19
Guatemala ... 108 3 1 11 4 4 62 23
Haiti ... 72 8 1 9 9 6 24 15
Honduras ... 104 2 1 2 2 7 68 22
Jamaica ... 70 2 - - - 1 48 19
Mexico ... 1825 89 1 30 2 194 1407 102
Nicaragua ... 95 4 1 4 8 3 59 16
Panama ... 47 1 2 3 5 - 25 11
Paraguay a ... 60 7 - 7 5 7 25 9
Peru ... 236 14 1 5 20 17 137 42
Trinidad and Tobago .... 152 2 - 60 2 1 75 12
Venezuela ... 366 15 2 25 - 48 244 32
British Guiana ... 25 (1) (1) - - 2 - 20 3
British Honduras ... 14 1 - - 1 1 9 2
Dominica ... 6 (1) (1) - - - _ 5 1
French Guiana ... 2 (4) (4) - 2 - -
-Grenadab ... 8 (1) (1) - - - 1 6 1
Guadeloupe ... 11 (4) 1 1 1 - - 5 (4) 3
Panama Canal Zone ... (42) (10) (1) (14) - (2) (3) (12)
St. Luciac ... 4 (1) (1) - - - - 3 1
Surinam ... 38 (1) (1) 1 2 - 3 28 4
Total ... 5 880 (55) 274(19) 25 (1) 224 (14) 80 612 (2) 3 982 (7) 683 (12)
(c) In maintenance phase - None.
(a) Program suspended in March 1961. New program being planned. (b) In maintenance phase since March 1962. since January 1963.
~d
0a &
W G
Table 9
PERSONNEL EMPLOYED IN ADMINISTRATIVE SERVICES AND OTHERS IN MALARIA ERADICATION PROGRAMS IN THE AMERICAS, 31 DECEMBER 1962
(Part-time personnel in parentheses)
UQ M 'r
4M
Country or other Adminis- Admin Disbursing
Cpoltical unit Total trators trative Accountants DOsfic e e Storekeepers Secretaries Others
political unit trators Assistants Officers ssistants
Argentina ... 132 4 64 - _ 5 7 3 49
Bolivia ... 35 6 8 _- - 7 14
Brazil (excl. Sao Paulo) ... ... ... ...
Brazil (Sao Paulo) ... 426 15 83 - 9 7 13 299a
Colombia ... 350 1 8 - 20 19 9 88 205
Costa Rica... 17 1 6 - - 1 1 1 7
Cuba ... 24 2 1 - _ 2 - 4 15
Dominican Republic ... 7 1 3 - - 1 1 1
Ecuador... 72 8 6 4 6 7 2 8 31
El Salvador ... 100 1 2 - 1 1 1 7 87
Guatemala ... 135 - 11 - - 2 1 6 115
Haiti ... 120 3 3 2 1 1 - 22 88
Honduras ... 33 1 8 1 - - - 8 15
Jamaica ... 32 2 - - - 1 3 3 23
Mexico ... 478 13 201 - 15 14 24 120 91
Nicaragua ... 79 2 - - - 9 5 63
Panama ... 34 1 5 - 1 10 4 13
Paraguayb ... 53 1 28 - _ 1 2 5 16
Peru ... 135 - 39 6 1 7 6 18 58
Trinidad and Tobago ... 13 1 2 - - 2 3 5
Venezuela... 404 21 3 - 1 16 5 125 233
British Guiana ... 19 1 - - - 1 1 - 16
British Honduras ... 4 1 - - - 1 - _ 2
Dominica ... 1 (1) (1) - - - _ I 1
French Guiana... 1 1
Grenada c ... 1 (1) 1 - _- - (1)
-Guadeloupe ... 6 (6) 1 - - - 1 4 (6)
Panama Canal Zone ... (2) - - - (2)
St. Luciad ... 1 (1) (1) 1
Surinam ... 20 1 2 - - 1 3 1 12
Total ... 2 732 (11) 87 (1) 485 13 54 91 101 (1) 444 (1) 1457 (8)
. .. No information. - None
(a) Some personnel of Chagas disease control, included. (b) Program suspended in March 1961.
CD14/16 Eng.) Page 14 Table 10
PERSONNEL EMPLOYED IN TRANSPORT SERVICES IN MALARIA ERADICATION PROGRAMS IN THE AMERICAS - 31 DECEMBER 1962
(Part-time personnel in parentheses)
Mechanics
Country or other and Drivers Motorboat
political unit assistant operators
Mechanics
Argentina ... .... 61 25 36
Bolivia ... 19 6 13 -
-Brazil (excl. Sao Paulo) ... ... ... ... ...
Brazil (Sao Paulo) ... 238 36 199 3
Colombia ... .... 347 67 119 121 40
Costa Rica ... 11 2 9
-Cuba ... 13 3 10
Dominican Republic ... 40 ... 40a /a ...
Ecuador ... 58 9 40 9
-El Salvador ... 34 5 28 1
Guatemala ... 54 2 51 1
Haiti ... 65 16 49
-Honduras ... .... 53 3 49 1
Jamaica ... .. 36 4 32
Mexico ... 122 85 26 11
-Nicaragua ... 60 - 56 4
-Panama ... 11 6 5
Paraguay b. 22 - 21 - 1
Peru ... 66 17 31 18
Trinidad and Tobago ... 5 4 1
-Venezuela ... 53 32 15 6
British Guiana ... 14 - 6 4 4
British Honduras ... 3 2 1
Dominica ... 1 - 1
French Guiana ... 3 3 3
Grenada ... 2 2 2
Guadeloupe ... 6 2 4
-Panama Canal Zone ... (4) - (2) (2)
Surinam ... .. 35 7 9 19
Total ... 1 432 (4) 333 856 (2) 198 (2) 45
i h
... No information. None.
'd 0
cn r (M
tll
vq
'R-::
Table 11
MEANS OF TRANSPORT IN MALARIA ERADICATION PROGRAMS IN THE AMERICAS, 1962
Trucks Automobiles
Country or other Trucks and and Motor
political unit (3 tons or "Pick-up" Jeeps station Motorcycles Bicycles boats without and pack Other
more) (less than wagons motor animals
3 tons) wagons
Argentina ... 6 83 12 10 1 27 4 4a
Bolivia ... 3 31 29 1 - 27 22 - 176
Brazil (excl. Sao Paulo) . 44 302 611 28 - - 34 3 509 lb
Brazil (Sao Paulo) ... 9 152 46 13 - 1 9 2
-Colombia ... 18 208 96 29 - 74 78 110 1076
Costa Rica ... 1 13 10 4 - 52 19 6
-Cuba ... 16 - 30 41 - - - - 160
Dominican Republic ... 3 75 25 2 - - -
-Ecuador ... 8 56 52 13 - 11 43 5 314
El Salvador ... 2 52 16 7 - 1 1 -
-Guatemala ... 1 43 6 20 31 - 15
-Haiti ... 4 64 22 20 - - - 4c
Honduras ... 2 38 30 5 - - 1 - 105
Jamaica ... 1 30 23 12 - - - -
-Mexico ... 16 432 349 10 - - 17 - 1680d
Nicaragua ... 2 26 34 10 - 1 10 1
-Panama ... 1 48 18 9 - - 14 - d
Paraguay ... - 10 15 4 3 2 9 2 13
Peru ... 7 126 67 1 - 1 64 15
-Trinidad and Tobago .... 3 1 10 1 - -
-Venezuela ... 3 69 63 25 6 191 97 - 588 1 7e
British Guiana ... 1 2 3 - - - 4 4 d
British Honduras ... - 5 8 - - 3 1 1
-Dominica ... - 1 2 - 3 - -
-French Guiana ... 1 3 1 - _ 1
-Grenada ... 2 - 1 - 2 - -
-Guadeloupe . ... 3 1 4 - 2 -
-Panama Canal Zone ... _ 2 - - -
2f-St. Lucia ... - 1 3 - 2
-Surinam ... - 4 6 - 2 - 26 -
-- None.
(a) Tank trucks. (b) Airplain. (c) Repair shop trucks. (d) Rented. (e) Foging machines. (f) Part-time.
CD14/16 (Eng.)
Table 12 Page 16
SPRAYING OPERATIONS OF MALARIA ERADICATION PROGRAMS IN THE AMERICAS AT THE END OF 1962
Houses sprayed Insecticide used Average
Year of Total per house No. of
total Date D. D. T. Dieldrin number of (grams technical) houses
coverage sprayings sprayed
Number Number per
Cycle sprayed Cycle Number in year DDT Dieldrin sprayma
sprayed
sprayedman-day
ARGENTINA. Total coverage began 1 August 1959
55849 a
Ist 2146b 263 ...
1st Aug. 59-Jun. 60 2146b 146074
2nd 6909 b0255 ...
78487a
3rd 4305 ...
2nd Jul. 60-Jul. 61 421 - 161920
4th 2803b 334 ...
73682a
3rd Aug. 61-Jun. 62 2052b - 148761 3
6th 73027 a 349
4th Jul. 62-Dec.62 7th 63967 63 967 353
BOLIVIA. Total coverage began 1 September 1958
1st Sep. 58-Aug.59 t 1st 10910 256601 362 18.315
_ _ 4th 142536 129119 2nd22nd 331 1. 0
2nd Sep. 59-Aug.60 3rd2nd 12268 291405 319 118 7
4th 142536 309 7. 2
3rd Sep. 60-Aug.61 6th 1341739952 294125 33129 7. 6
7th 124623 353 7.9.
4th Sep. 61-Sep. 62 8th 128898 253521 359 8. 6
BRAZIL. Total coverage in some areas began August 1959
(c) Jan. 61-Nov.61l 814475e - 814475
(c) Jan. 62-Sep. 621 2 327 498 e 2327498 424
BRAZIL. (SAO PAULO STATE) Total coverage began 4 January 1960
1st 455 219 433 8. 4
1st Jan. 60-Jan. 61 2st 455219 - - 914145 4
2nd 458 926 404 9.8
3rd 436048 416 9. 4
2nd Feb. 61-Jan. 62 3rd 436048 86752112 9. 4
4th 431473 867 '1 4 1 2 |9. 416 9.77
3rd Feb. 62-Jan. 63 5th 380623 764 340
6th 383717 420 9.8
COLOMBIA. Total coverage began 29 September 1958
1st 1181235 466 6. 6
1st Oct. 58-Sep. 59 2nd 1176392 3 - 2 357 627 466 6.
_ _ _ _ _ _ _ _ _ _ 1 76 392 425 - 8. 9
2nd Oct. 59-Sep. 60 3rd 1196930 - 2358989 409 9. 4
|_ Oct. _9_Sep. 6_ |_ 4th _ 1162059 2358 989 394 - 9. 7
5th 1 181557 397 9.7
3rd Oct. 60-Sep. 61 6th 888 459 a - 2127058 402 9. 3
... No information
- Nada.
CD14/16 (Eng.)
Page 17 Table 12 (Continued)
SPRAYING OPERATIONS OF MALARIA ERADICATION PROGRAMS IN THE AMERICAS AT THE END OF 1962
COLOMBIA. (Cont.)
662352a
7th 76 1 0 7b 408 8.9
4th Oct. 61-Sep. 62 6 5 4 0 9 9a - - 1 431 774
8th 3 9 2 1 6b 420 8.8
388 985
5th Oct. 62- Feb.62 9th 17 9 d - - 491 649 437 8. 3
5 051e
COSTA RICA. Total coverage began 15 July 1957
1st Jul. 57-Aug.58 2nd 1st 53 297 58 624 111921 464 419 7.45. 1
2nd Sep. 58-Sep. 59 4th 3rd 60800 63063 123863 465 531 7.16.9
5th 63884 512 8.6
3rd Oct. 59-Sep. 60 6th 6th 66 961 66961- 130845 475 939. 3
7th 66242 473 9.4
4th Oct. 60-Sep. 61 8th 68277 - 134 519 485 9 2
9th 58 910 492
5th Oct. 61-Dic. 62 9th 30 684° 89 594 492
10th 30 684 508 9.4
CUBA. Total coverage began January 1962
1t |Jan 62Dec62 | 1st 383 948
1st Jan. 62-Dec.62 2ndC 101271 - - 485219 435
DOMINICAN REPUBLIC. Total coverage began 16 June 1.958
1st Jun. 58-Jun. 59 - - 1st 395 597 395 597 - 102 11. 4
2nd Jul. 59-Feb.60 - 2ndf 236597 236597 119 0. 5
3rd Mar.60-Mar.62 1st 332 944 - 537 475 472
-2nd 204 531 472 8. 4
3rdg 72499 424 8.4
4th Apr.62-Jan. 63 4thd c 4th c 138 138 1 72 - 210 637 458 458 8.8. 4
ECUADOR. Total coverage began 28 March 1957
1st Mar.57-Mar.58 lst+2nd 63 284 1st 257 697 320981 590 114 8. 0
2nd Apr.58-Mar.59 3rd 50089 2nid 271417 404524 436 145
4th 83 018 436 8. 5
3rd Apr.59-Mar.60 5th 72370 3rd 271729 441889 39122 9
6th 978790 403 8.8
(h) Apr.60-Dec. 60 (h) 227411 - - 227411 424 8.9
4th Jan. 61-Dec. 61 8th 6thg 412008 412008 - 806254 4502 502 | 8.58.
5th Jan. 62-Dec. 62 9th 428 269598
10th 428329 585 - 8.0
... No information.
- None.
(a) Sprayed twice a year. (b) Sprayed once a year. (c) Cycle not yet finished. (d) Sprayed three times a year. (e) Sprayed four times a year. (f) Cycle suspended due to shift of insecticide. (g) Cycle suspended.
CD14/16 (Eng.)
Table 12 (Continued) Page 18
SPRAYING OPERATIONS OF MALARIA ERADICATION PROGRAMS IN THE AMERICAS AT THE END OF 1962
Houses sprayed Insecticide used Average
Total per house No. of
Year of D. D. T. Dieldrin number of (grams technical) houses
total Date sprayed
- sprayings per
coverage in year
Cycle Number Cycle Number DDT Dieldrin
sprayman-sprayed sprayed day
EL SALVADOR. Total coverage began 1 July 1956
1st 260035 454 8.5
1st Jul. 56-Jul. 57 st 2176537 1st 128 839 562411 454 158 8.8
2nd 173 537 621 8.8
2nd Aug.57-Jul. 58 3rd 12632 2nd 202 728 440783 469 162
4th 111726 450 9.3
5th 273788 493 8.6
3rd Aug.58-Jul. 59 6th 270719544 507 8
6th 270719 527 8. 9
7th 265 361 573 7.7
4th Aug.59-Jul. 60 8th 8th 276 050 276050 - 541411 545 7 77.7
9th 279481 528 7.6
5th Aug.60-Jun. 61 10th 10th 371715 371715 651196 526 526 7.8. 9
6th Jul. 61-Jul. 62 1th 377551 - 763645 546 9.2
12th 386094 562 9.5
(a) Aug.62-Dec.62a (a) 3816 - - 3816 809 6. 7
GUATEMALA. Total coverage began 1 August 1957
1st Aug.56-Aug. 57 - 1st 306 306 306 306 - 117 8. 4
2nd Sep.57-Sep. 58 - 2nd 331090 331090 117 8. 5
1st 301 329 427
3rd Oct. 58-Oct. 59 2st 2nd 357 104 357 104 658 433 542 542 - 7. 58
4th
Nov.59-Nov.60 3rd 368 269 541 7. 1
4th Nov. 59-Nov. 60 4th 378636- 746 905
4th 378 636 560 8. 1
5th 386737 588 7.8
5th Dec.60-Dec.61 6th 6th 386737 393 090 779827 557 7.87.9
6th Jan. 62-Dec.62 thb 238718 606853 553 7.5
8thb 238718 594 7.5
HAITI. Total coverage began 1 January 1962
1st Jan. 62-Dec.62
I1st
874 933 1st 10016 1791795 220 61 14.31s J2nd 906846 196 16. 6
HONDURAS. Total coverage began 15 July 1959
1st 236 963 406 9. 8
1st Jul. 59-Jun. 60 2nd st 236963 242059 - 479022 368 368 11.411.4
2nd Jul. 60-Jun. 61 3rd 254699 - 520524 419 - 1 8
4th 265825 419 10. 9
3rd Jul. 61-Jun. 62 6th th -27794 285 394 - 563 335 362 1111. 3
290 056 _
4th Jul. 62-Mar.63
8th
103954 - 394010 384JAMAICA. Total coverage began 2 January 1958; ended 15 December 1961 --- -~~~~~~~~~~~~~~~~~~~~~~~~~~~~~~~~~~~~~~
- None.
CD14/16 (Eng.) Page 19
Table 12 (Continued)
SPRAYING OPERATIONS OF MALARIA ERADICATION PROGRAMS IN THE AMERICAS AT THE END OF 1962
MEXICO. Total coverage began 1 January 1957
1st Jan. 57-Dec. 57 143 023 t 678726 5120 701 495 99 9 3
2nd 2 298 952 417 9. 9
3rd 2103570 402 10.3
2nd Jan. 58-Dec. 58 4th 1971557 2nd 1 217 556 5 292 683 4 111 10.5
4th 1 971 557 424 10. 5
5th 3050952 10.8
3rd Jan. 59-Dec. 593219340 3rd 292301 6562593 114 10.4
6th 3 219 340 434 10. 4
4th Jan. 60-Dec. 60 8th th 2869093 4th 22390 5 918 572 387 939 11.t
9th 1 582 503 356 11.2
5th Jan. 61-Dec. 61 10th 10th 852 852 287, 50 - 2 434 790 414 414 1510. 5
390 351a
11th 93 514 8.6
6th Jan. 62-Dec. 62 386 76 - - 1608 142
-12th 8087 825 087 517 8.9
NICARAGUA. Total coverage began 10 November 1958
1st 205 930 401 9.2
1st Nov. 58-Dec. 59 1st 205930 - - 424 575 01 2
2nd 218 645 325 10. 3
3rd 230 478 367 9.4
2nd Jan. 60-Dec. 60 4th 234076 - - 4697554 396 89
4th 239076 396 8. 9
3rd Jan. 61-Dec. 61 5th 239 375 490912d 403 9
6th 249 068 397 9. 1
4th Jan. 62-Dec. 62 7th 259743 - 435155e 409 9 6
8th 164 623 440 9. 3
-PANAMA. Total coverage began 19 August 1957
1st Aug. 57-Aug. 58 - - 1st 155 963 155 963 - 119 6. 5
2nd Sep. 58-Aug. 59 - 2nd 154 638 154 638 - 145 6. 9
3rd Sep. 59-Aug. 60 - - 3rd 131270 131 270 - 129 7. 3
4th Sep. 60-Apr. 62 - 4th 1 265 9 9 138 6. 8
5th May 62-Mar.63 1st 174 779 5th 2 293 337 390 490 77 8 1
2ndf 160 318 510 8. 8
PARAGUAY. Total coverage began 30 October 1957
1st Nov. 57-Oct. 58 - - 1st 148 626 148 626 - 105 10. 9
2nd Nov. 58-Oct. 591 - 2nd 161261 161261 - 111 14.3
3rd Nov. 59-Oct. 60 - - 3rd 171086 171086 - 118 11. 7
4th g Nov. 60-Mar. 61 - - 4th g 56 656 56 656 - 138 8. 1
... No information.
- None.
CD14/16 (Eng.) Page 20 Table 12 (Concluded)
SPRAYING OPERATIONS OF MALARIA ERADICATION PROGRAMS IN THE AMERICAS AT THE END OF 1962
Houses sprayed Insecticide used Average
Total per house No. of
Yetotal Date D. D. T. Dieldrin number of (grams technical) houses
sprayings sprayed
coverage
in year per
Cycle Number Cycle Number
sprayman-sprayed sprayed day
PERU. Total coverage began 17 November 1957
1st Nov. 57-Oct. 58 st + 2nd 286764 1st 121666 478 696 ... ... 7. 8
2nd Jan. 59-Dec.59 (c) 271065 2nd 341804 612869 424 118 8.4
3rd Jan. 60-Dec.60 c 447 848 3rd 234 643 682491 468 95 8. 4
4th Jan. 61-Dec.61 (c) 5 3 4 0 3 7d 4th 25 005 559042 410 109 7.9
5th Jan. 62-Dec.62 (c) 627 527 d - 627 527 465 8. 7
TRINIDAD AND TOBAGO. Total coverage began 2 January 1958; ended December 1961
VENEZUELA. Total coverage began 1945
.. Jan. 62-Dec.62 ... 493781 .23706e 523563 156 f 232 7.0
BRITISH GUIANA. Total coverage began April 1946
... Jan. 62-Dec.62 . 13 3591a 24026 183 l 8.3
BRITISH HONDURAS. Total coverage began 4 February 1957; ended 10 August 1962
DOMINICA. Total coverage began 8 June 1959; ended October 1962
GRENADA. Total coverage began 12 February 1957; ended January 1960
ST. LUCIA. Total coverage began 1 January 1956; ended September 1959
SURINAM. Total coverage began 5 May 1958
1st May 58-Apr.59 st 31 299 lstg 7 484 78 994 310 53 5.
_ __
2nd 40211 318 6. 9
2nd May 59-Apr.60 4th 37563 2ndg 13331 88 339 274 59 8.
____4th 37 445 250 7.8
5th 36 861 263 6. 2
3rd May 60-Jun. 61 6th 16298 3rd 5 565 58 724 23 56 6.
4th Jul. 61-Jun. 62 7th 15533 4th 1320 .211 54 5.7
8th ... . ...
5th Jul. 62- 'th 5th .. . ....
10th ... - I...
(a)
No information. None.
CD14/16 (Eng.) Page 21
Table 13
SPRAYING ACHIEVEMENTS OF MALARIA ERADICATION PROGRAMS IN THE AMERICAS AT THE END OF 1962
Number of houses not sprayed a
Year of Number of Per cent
total Date of houses
coverage sprayings Not Refused entry to Closed not sprayed
Total not sprayed
sprayable spraymen
ARGENTINA. Total coverage began 1 August 1959
1st Aug. 59-Jun. 60 146074 5 328 22 1819 7 169 4. 7
2nd Jul. 60-Jul. 61 161920 5550 68 2 607 8 225 4. 8
3rd Aug. 61-Jun. 62 148 761 4 295 83 2 531 6 909 4. 4
4th Jul. 62-Dec.62 63967 1547 35 1 686 3 268 4. 9
BOLIVIA. Total coverage began 1st September 1958
1st Sep. 58-Aug.59 256601 12482 862 19 094 32438 11. 2
2nd Sep. 59-Aug.60 291405 17 039 438 14 322 31799 9. 8
3rd Sep. 60-Aug. 61 294 125 18 892 463 9 382 28 737 8. 9
4th Sep. 61-Sep. 62 253 521 14134 420 7197 21751 7. 9
BRAZIL. Total coverage in some areas began in August 1959
(b) Jan. 61-Nov.61c 814475 . ...
I
5620 0. 7(b) Jan. 62-Sep. 62 2 327498 ... ... I ... 1 290610 11.1
BRAZIL (SAO PAULO STATE). Total coverage began 4th January 1960
1st Jan. 60-Jan. 61 914145 45164 1 8410 24379 77953 7.9
2nd Feb. 61-Jan. 62 867 521 39 363 5 848 10 991 56202 6. 1
3rd Feb. 62-Jan. 63 764 340 34 386 i 2801 6111 43298 5. 4
COLOMBIA. Total coverage began 29 September 1958
1st Oct. 58-Sep. 59 2 357 627 82822 85476 57804 226 102 8.8
2nd Oct. 59-Sep. 60 2 358989 70006 28155 88588 186749 7.3
3rd Oct. 60-Sep. 61 2 127 058 43 393 30737 67 448 144 578 6. 4
4th Oct. 61-Sep. 62 1431774 20833 29 286 51099 101218 6. 6
5th Oct. 62- Feb. 63 491649 5 370 12168 15 642 33180 6. 3
COSTA RICA. Total coverage began 15 July 1957
1st Jul. 57-Aug.58 111921 0 0 0 0 0
2nd Sep. 58-Sep. 59 123863 0 0 0 0 0
3rd Oct. 59-Sep. 60 130845 0 0 0 0 0
4th Oct. 60-Sep. 61 134519 0 0 0 0 0
5th Oct. 61-Dec.62 89594 0 0 0 0 0
DOMINICAN REPUBLIC. Total coverage began 16 June 1958
1st d | Jun. 58-Jun. 59 395 597 l ... | ... | ... l 5706 1. 4
2nd Jul. 59-Feb.60 236579 7908 916 8059 16833 6. 6
3rd Mar.60-Mar.62 537475 16463 2 780 18 288 37531 6. 5
4th Apr. 62-Jan. 63 210 637 ... ... ... .. ...
... No information.
(a) When follow-up spraying is done, the figures represent the net number of houses unsprayed at the end of the spraying cycle. (b) Owing to different spray cycle timing in different regions, these data refers to the calendar year. (c) Data refers to the State of Ceara, Rio Grande do Norte, Paraiba, Alagoas and Sergipe.
CD14/16 (Eng.) Page 22 Table 13 (Continued)
SPRAYING ACHIEVEMENTS OF MALARIA ERADICATION PROGRAMS IN THE AMERICAS AT THE END OF 1962
Number of houses not sprayed a
Year of Number of Per cent
sprayings Not
total Date sprayings Not Refused of houses
coverage sprayable entry to Closed Total not sprayed
spraymen
ECUADOR. Total coverage began 28 March 1957
1st Mar. 57-Mar. 58 320981 .. .. .
2nd Apr. 58-Mar. 59 404 524 3 168 4 112 9 618 16 898 4. 0
3rd Apr. 59-Mar. 60 441889 2430 1587 5 123 9140 2. 0
(b) Apr. 60-Dec. 60 227 411 753 1069 2518 4 340 1. 9
4th Jan. 61-Dec. 61 806 254 3184 4 394 11008 18 586 2. 3
5th Jan. 62-Dec. 62 856 598 3 762 8 250 17 833 29 845 3. 4
EL SALVADOR. Total coverage began 1 July 1956
1st Jul. 56-Jul. 57 562411 ... ... ... 218 0.04
2nd Aug. 57-Jul. 58 440783 0 0 0 0 0
3rd Aug. 58-Jul. 59 544507 0 101 355 456 0. 1
4th Aug. 59-Jul. 60 541411 0 510 1426 1936 0. 4
5th Aug. 60-Jun. 61 651196 0 974 1989 2 963 0. 5
6th Jul. 61-Jul. 62 763 645 0 3 221 4 553 7 774 1. 0
(c) Aug. 62-Dec. 62 3816 0 52 10 62 1. 6
GUATEMALA. Total coverage began 1 August 1956
1st Aug. 56-Aug. 57 306 306 ... ... ... 758 0. 2
2nd Sep. 57-Sep. 58 331090 ... ... ... 1518 0. 5
3rd Oct. 58-Oct. 59 658 433 ... .. .. 6 541 1. 0
4th Nov. 59-Nov. 60 746905 0 783 6379 7162 0.9
5th Dec. 60-Dec. 61 779 827 0 6 846 14 928 21928 2. 7
6th Jan. 62-Dec. 62 606 853 0 12 100 18 508 30 608 4. 8
HAITI. Total coverage began 1 January 1962
1st Jan. 62-Dec. 62 | 1791795 79206 1259 7 145 87610 4.7
HONDURAS. Total coverage began 15 July 1959
1st Jul. 59-Jun. 60 479022 6519 391 1812 8 722 1. 8
2nd Jul. 60-Jun. 61 520524 436 601 3 132 4 169 0. 8
3rd Jul. 61-Jun. 62 563 335 0 605 3 562 4 167 0. 7
4th Jul. 62-Mar. 63 394 010 0 488 2 231 2 719 0. 7
JAMAICA. Total coverage began 2 January 1958; ended 15 December 1961
MEXICO. Total coverage began 1 January 1957
1st Jan. 57-Dec. 57 5 120 701 77 537 7 1 6 1 9d 149156 2. 8
2nd Jan. 58-Dec. 58 5 292683 167483 1 5 4 4 7 9d 321962 5.7
3rd Jan. 59-Dec. 59 6562593 203597 2 1 5 0 0 7d 418604 6.0
4th Jan. 60-Dec. 60 5 918572 164492 248212d 412704 6.5
5th Jan. 61-Dec. 61 2434790 45544 7 9 7 6 3d 125307 4.9
6th Jan. 62-Dec. 62 1 608142 10 297 5 0 5 2 3d 60820 3. 6
(a)
No information.
CD14/16 (Eng.)
Page 23 Table 13 (Continued)
SPRAYING ACHIEVEMENTS OF MALARIA ERADICATION PROGRAMS IN THE AMERICAS AT THE END OF 1962
Number of houses not sprayeda
Year of Per cent
total Date Refused of houses
coverage sprayings sprayable Nal spraymenentry to Closed Total not sprayed
NICARAGUA. Total coverage began 10 November 1958
1st Nov. 58-Dec. 59 424 575 6 802 2 099 7 288 16183 3. 7
2nd Jan. 60-Dec. 60 469 554 12 487 2 102 4 841 19 430 4. 0
3rd Jan. 61-Dec. 61 490 912 13 640 1417 6 619 21676 4.2
4th Jan. 62-Dec. 62 435 155 12175 1177 6093 19445 4. 5
PANAMA. Total coverage began 19 August 1957
1st Aug. 57-Aug. 58 155 963 ... ... ... 5047 3. 1
2nd Sep. 58-Aug. 59 154 638 2 247 267 5 857 8 371 5. 1
3rd Sep. 59-Aug. 60 131270 1825 530 6738 9093 6. 5
4th Sep. 60-Apr. 62 199 265 1494 2113 10172 13 779 6. 5
5th May 62-Mar.63 337 390 381 1 237 5 905 7 523 2. 2
PARAGUAY. Total coverage began 30 October 1957
1st Nov. 57-Oct. 58 148 626 0 0 651 651 0. 4
2nd Nov. 58-Oct. 59 161261 0 90 1022 1112 0. 7
3rd Nov. 59-Oct. 60 171086 0 28 981 1009 0. 6
4thb Nov. 60-Mar. 61 56656 0 0 494 494 0. 9
PERU. Total coverage began 17 November 1957
1st Nov. 59-Oct. 58 478 696 522 72 42 201 42795 8. 2
(c) Jan. 59-Dec. 59 612869 16373 2163 22120 40656 6.2
(c) Jan. 60-Dec. 60 682491 12433 1479 13 661 27 573 3. 8
(c) Jan. 61-Dec. 61 559042 7 241 1138 7 884 16 263 2. 8
(c) Jan. 62-Dec. 62 627 527 6 624 1419 7 932 15 975 2. 5
TRINIDAD AND TOBAGO. Total coverage began 2 January 1958; ended December 1961
VENEZUELA. Total coverage began in 1945
... I Jan. 62-Dec. 62 523563 0 5132 8403 13535 2.5
BRITISH GUIANA. Total coverage began April 1946
... | Jan. 62-Dec. 62 24026 571T 56 1755 2382 9.0
BRITISH HONDURAS. Total coverage began 4 February 1957; ended 10 August 1962
DOMINICA. Total coverage began 8 June 1959; ended October 1962
... No information.
CD14/16 (Eng.) Page 24 Table 13 (Concluded)
SPRAYING ACHIEVEMENTS OF MALARIA ERADICATION PROGRAMS IN THE AMERICAS AT THE END OF 1962
Number of houses not sprayeda
Year of Per cent
total Date Refused of houses
coverag Dsprayings Not entry to Closed Total not sprayed
sprayable spraymen
GRENADA. Total coverage began 12 February 1957; ended January 1960
ST. LUCIA. Total coverage began 16 January 1956; ended September 1959
SURINAM. Total coverage began 5 May 1958
1st May 58-Apr. 59 78 994 196 124 4 980 5 300 6. 3
2nd May 59-Apr. 60 88 339 166 1126 3 838 5 130 5. 5
3rd May 60-Jun. 61 58 724 408 2083 10 865 13 356 18. 5
4th Jul. 61-Jun. 62 ... ... ... ... ...
5th Jul. 62 ... ... ... ... ...
... No information.
CD14/16 (Eng.) Page 25
Table 14
CASE DETECTION DURING THE ATTACK PHASE IN MALARIA ERADICATION PROGRAMS IN THE AMERICAS
No. of No. of positive slides
Year of inhabitants No. of
total Date directly slides Per cent
coverage protected examined P. falci- positive
by spraying P. vivax P. malariae Total
parum
ARGENTINA. Total coverage began 1 August 1959
Ista Aug. 59-Jun. 60 535 922 70 700 6 2491 0 2497 3. 53
2ndb Jul. 60-Jul. 61 609 387 96 991 4 3 876 0 3 880 4.00
3rd Aug. 61-Jun. 62 539 804 107 926 1 5 080 0 5 081 4. 71
4th Jul. 62-Dec. 62 229437 48 821 0 884 0 884 1. 81
BOLIVIA. Total coverage began 1 September 1958
1st Sep. 58-Aug. 59 7 5 4 6 3 5C 50 980 273 1 268 302 1843 3. 62
2nd Sep. 59-Aug. 60 1 295 044 99 241 124 803 179 1106 1. 12
3rd a Sep. 60-Aug. 61 1278 038 126 384 90 615 30 735 0. 58
4th a Sep. 61-Sep. 62 1 049 991 174 800 214 758 10 982 0. 56
5th a Oct. 62-Dec. 62 55 321 54 094 174 185 1 360 0. 67
BRAZIL. Total coverage by steps
(d) Jan. 62-Dec.62 513767 I 22683 45683 5 68371 13.31
BRAZIL (SAO PAULO STATE). Total coverage began 4 January 1960
1st Jan. 60-Jan. 61 3817084 124525 72 9 005 1 9 078 7.29
2nd Feb. 61-Jan. 62 3638449 219841 262 6817 3 7 082 3.22
3rd Feb. 62-Jan. 63 3153419 381413 228 3082 4 3314 0.87
COLOMBIA. Total coverage began 29 September 1958
1st Oct. 58-Sep. 59 13089121 205 343 731 1877 18 2 626 1. 28
2nd Oct. 59-Sep. 60 12701683 542570 3564 4 923 42 8 529 1.57
3rd Oct. 60-Sep. 61 11049985 515 395 8 730 5 822 39 14 591 2.83
4th Oct. 61-Sep. 62 7158013 640720 9873 7716 34 17623 2.75
5tha Oct. 62-Jan. 63 1910650 229103 3013 2586 11 5610 2.45
COSTA RICA. Total coverage began 15 July 1957
1st Jul. 57-Aug. 581 550 660 24 773 115 1661 10 1786 7. 21
2nd Sep. 58-Sep. 59 596007 52697 135 2081 6 2 222 4.22
3rd Oct. 59-Sep. 60 622215 66721 91 1888 1 1980 2.96
4th Oct. 60-Sep. 61 628 204 81977 32 1798 0 1830 2. 23
5th Oct. 61-Dec. 62 423 397 155 909 6 1772 1 1779 1. 14
6th Jan. 63-Feb. 63| 34 893 17 535 2 116 0 118 0. 67
CUBA. Total coverage began 1 January 1962
1st Jan. 62-Dec. 62 ' 100 247 31 3484 0 3515 3.51
DOMINICAN REPUBLIC. Total coverage began 16 June 1958
1st Jun. 58-Jun. 59 2015214 29718 1522 1537 1 3060 10.30
2nd Jul. 59-Feb.60 1202301 19362 2453 1751 10 4 214 21.76
3rd Mar. 60-Mar. 62 2797071 39534 3 934 2899 8 6841 17.30
4th Apr. 62-Jan. 63 638 106 20 634 175 226 2 403 1.95
(a) Data for entire country; not separated by attack phase and consolidation phase. (b) Data for both attack and and consolidation phases July-Dec. 1960; attack phase only Jan. -July 1961. (c) January-August 1959. (d) Data
CD14/16 (Eng.) Page 26 Table 14 (Continued)
CASE DETECTION DURING THE ATTACK PHASE IN MALARIA ERADICATION PROGRAMS IN THE AMERICAS
No. of No. of positive slides
Year of inhabitants No. of Per cent
total Date directly slides positive
coverage protected examined P.
falci-by spraying parum P. vivax P. malariae Total
by spraying parum
ECUADOR. Total coverage began 28 March 1957
1st Mar.57-Mar.58 1777 566 47 993 1169 1086 3 2 258 4. 70
2nd Apr. 58-Mar. 59 2171079 69 085 2 361 2437 4 4802 6.95
3rd Apr. 59-Mar. 60 2 080 775 108 041 2454 3833 4 6 291 5.82
(a) Apr. 60-Dec. 60 918151 92 510 2761 4 912 19 7 692 8. 31
4th Jan. 61-Dec. 61 3795 248 213169 1489 8 243 1 9 733 4. 57
5th Jan. 62-Dec. 62 3 880 000b 269 004 658 4 868 5 5531 2. 06
EL SALVADOR. Total coverage began 1 July 1956
1st Jul. 56-Jul. 57 2845568 11829 774 1510 0 2 284 19.31
2nd Aug. 57-Jul. 58 2102503 42 216 4 212 4891 5 9108 21. 57
3rd Aug. 58-Jul. 59 2 570 500b 59463 4 384 9136 0 13 520 22. 74
4th Aug. 59-Jul. 60 2 534 965 75177 3061 9 566 0 12 627 16. 80
5th Aug. 60-Jul. 61 3010514 75053 3168 7620 3 10791 14. 38
6th Aug. 61-Jun. 62 3470797 145501 2343 9655 6 12004 8.25
(c) Jul. 62-Dec. 62 19719 139 645 1997 9 210 0 11207 8. 03
GUATEMALA. Total coverage began 1 August 1956
1st Aug. 56-Aug. 57 712788d 22965 1255 3858 3 5116 22.28
2nd Sep. 57-Sep. 58 1501742 47945 3909 6174 1 10084 21.03
3rd Oct. 58-Oct. 59 2854461 124519 3734 9300 0 13034 10.47
4th Nov. 59-Nov. 60 3 099 988 126 667 400 2 967 0 3 367 2. 66
5th Dec. 60-Dec. 61 3 448 877 230 702 865 3 485 6 4 356 1. 89
6th Jan. 62-Dec. 62 2503160 275 003 1 539 4 224 20 5 783 2. 10
HAITI. Total coverage began 29 January 1962
1st IJan. 62-Dec. 62 I 111142 3441 | 20 572 4033 | 3.63
HONDURAS. Total coverage began 15 July 1959
1st Jul. 59-Jun. 60 2 254 385 82673 2 925 3 649 1 6 575 7. 95
2nd Jul. 60-Jun. 61 2 672662 137025 1506 3716 1 5 223 3.81
3rd Jul. 61-Jun. 62 2 820 098 190 209 481 3198 0 3679 1.93
4th Jul. 62-Mar.63 1 908 510 177 281 825 5 795 0 6620 3. 73
JAMAICA. Total coverage began 2 January 1958; ended December 1961
1st Jan. 58-Dec. 58 1054894 56266 199 0 6 205 0. 36
2nd Jan. 59-Sep. 59 1037284 27 953 280 0 15 295 1. 06
3rd Oct. 59-Sep. 60 1964453 111039 180 1 14 194 0. 17
4th Oct. 60-Dec. 61 1 176114 190 094 30 0 8 38 0. 02
CD14/16 (Eng.) Page 27
Table 14 (Continued)
CASE DETECTION DURING THE ATTACK PHASE IN MALARIA ERADICATION PROGRAMS IN THE AMERICAS
No. of No. of positive slides
Year of inhabitants No. of
total Date directly slides Per cent
coverage protected examined P. falci- positive
coverage by prayingotecteda spraying parum m iP. vivax P. malariae Total
-MEXICO. Total coverage began 2 January 1957
1st Jan. 57-Dec. 57 23399463 175080 514 3856 17 4387 2. 51
2nd Jan. 58-Dec. 58 23744095 399124 487 2779 24 3290 0.82
3rd Jan. 59-Dec. 59 29119920 815038 443 2705 54 3202 0.39
4th Jan. 60-Dec. 60 25 782 965 1208 712 245 3 251 73 3569 0. 29
5th Jan. 61-Dec. 61 10 070 335 828 360 337 8 283 115 8735 1.05
6th Jan. 62-Dec. 62 6 376 914 727 262 145 9 605 52 9802 1.35
NICARAGUA. Total coverage began 10 November 1958
1st Nov. 58-Dec. 59 2 352191 38 966 619 1256 0 1875 4. 81
2nd Jan. 60-Dec. 60 2535535 74 074 4 217 3 311 0 7 528 10. 16
3rd Jan. 61-Dec. 61 2 547 299 109 293 3 001 5 721 0 8 722 7.98
4th Jan. 62-Dec. 62 2142 689 162733 3428 7772 0 11 200 6. 88
PANAMA. Total coverage began 1 August 1957
1st Aug. 57-Aug. 58 670000a 69 429 1717 ... ... 5 634 8. 11
2nd Sep. 58-Aug. 59 667 095 93 338 720 4196 5 4 921 5.27
3rd Sep. 59-Aug. 60 562 514 76 984 751 4479 2 5 232 6. 80
4th Sep. 60-Apr. 62 836 229 160 620 1660 4155 2 5817 3. 62
5th May 62-Mar. 63 1343908 135 627 505 2446 0 2951 2. 18
PARAGUAY. Total coverage began 30 October 1957
1st Nov. 57-Oct. 58 747541 13526 3 496 1 500 3.70
2nd Nov. 58-Oct. 59 805 232 11963 3 618 0 621 5. 19
3rd Nov. 59-Oct. 60 844 515 42396 5 1028 0 1033 2.44
4thb Nov. 60-Dec. 61 280 982b 34452 9 1735 1 1745 5.07
Jan. 62-Dec. 62 - 48184 313 5443 0 5756 11.95
PERU. Total coverage began 17 November 1957
1st Nov. 57-Oct. 58 1867 208 ... 77 526 27 649 c
(d) Jan. 59-Dec. 59 2 775 694 148 413 302 4 265 51 4 658 c 3. 14
(d) Jan. 60-Dec. 60 3 345 726 344 507 256 3 559 88 3 903 1. 13
(d) Jan. 61-Dec. 61 2 210 988 410 380 185 2 804 66 3 055 0.74
(d) Jan. 62-Dec. 62 2 283960 389616 78 2 019 80 2 177 0. 56
TRINIDAD AND TOBAGO. Total coverage began 2 January 1958; ended December 1961
1st Jan. 58-Sep. 58 571953 26499 1 318 58 0 3 7 6e 1.41
2nd Jan. 59-Dec. 59 726681 101039 63 28 1 92 0.09
3rd Jan. 60-Dec. 60 1 176907 91 388 9 2 0 11 0. 01
4th Jan. 61-Dec. 61 1 192 989 89 569 0 0 0 0 0
... No information. - None.