regional committee
PAN AMERICAN
HEALTH
ORGANIZATION
WORLD
HEALTH
ORGANIZATION
XIX
Meeting
Washington, D. C.
September-October 1969
XXI
Meeting
Provisional Agenda Item 23
CD19/2 (Eng. )
11 August 1969
ORIGINAL: ENGLISH-SPANISH
STATUS OF MALARIA ERADICATION IN THE AMERICAS
TABLE OF CONTENTS
Page
Introduction ...
I.
STATUS OF MALARIA ERADICATION PROGRAMS
A.
General picture ...
1
B.
Current extent of the problem ...
5
C.
Field operations ...
12
D. Budget ...
20
II.
SPECIAL TECHNICAL PROBLEMS
A.
General status ...
108
B.
Activities for solving technical problems
...
108
1.
Use of alternative insecticides ...
108
2.
Larviciding ...
...
108
3.
Additional cycle of DDT ...
...
108
4.
Mass drug distribution ...
109
5.
Intensified case-detection and radical-cure
treatment ...
109
m.
RESEARCH
A.
Evaluation of new insecticide ...
115
B.
Investigations in chemotherapy ...
115
1.
Long-action malaria drugs ...
115
2.
Liquid preparations ...
115
3.
Use of primaquine-pyrimethamine in collective
treatment ...
117
4.
Response of P. falciparum to chloroquine and
other drugs ...
...
117
5.
Radical-cure treatments for P. vivax ...
117
C.
Investigation of the economic effects of malaria ...
118
IV.
INTERNATIONAL COOPERATION ...
118
-i-FIGURES, MAPS AND TABLES
Figures:
Page
1
Number of cases of malaria in the countries of Central America,
1961-1968 ...
11
2
Collective treatment programs with antimalarial drugs, Costa Rica and
El Salvador ...
112
3
Collective treatment programs with antimalarial drugs, Honduras ....
113
4
Collective treatment programs with antimalarial drugs, Guatemala and
Nicaragua ...
114
5
Malaria trends in the OMS-33 sprayed area in E1l Salvador, before and
after spraying, 1964-1968 ...
116
Maps:
1
Status of the malaria eradication program in the Americas,
31 December 1967 ...
2...
2
2
Status of the malaria eradication program in the Americas,
31 December 1968 ...
3...
Tables:
1
Comparison of 1967 and 1968 population and area by phase in
countries with programs active after 1955, and change in per cent ....
4
2
Population of the Americas in areas in maintenance and consolidation
phases, by year,
1960-1968,
and annual per cent of increase ...
5
3
Epidemiological evaluation in areas under maintenance phase in
malaria eradication programs, 1968 ...
...
6
4
Epidemiological evaluation in areas in consolidation phase in malaria
eradication programs, 1968 ...
7...
7
5
Status of malaria eradication in the Americas, by population, 1968 . ..
8
6
Status of malaria eradication in the Americas, by area, 1968 ...
9
7
Personnel employed in malaria eradication programs in the Americas,
31 December 1967 and 1968, by category ...
13
8
Personnel employed in sptraying operations in malaria eradication
programs in the Americas - 31 December 1968 ...
14
9
Personnel employed in epidemiological evaluation operations in
malaria eradication programs in the Americas - 31 December 1968...
15
10
Personnel employed in administrative and other services in malaria
eradication programs in the Americas - 31 December 1968 ...
16
11
Personnel employed in transport services in malaria eradication
programs in the Americas - 31 December 1968 ...
17
12
Means of transport in malaria eradication programs in the Americas,
1968 ...
...
18
-Tables: (Cont. ) Page
13 Summary of case detection in the Americas, 1958-1968 ... 19
14 Comparative results of active and passive case detection in malaria eradication programs in the Americas, 1968 ... 21
15 National expenditures, 1967-1968 and budget 1969 for malaria eradication in the Americas ... 22
16 Estimated requirements for malaria eradication in the Americas .... 23
17 Mass drug programs in the Americas, 31 December 1968 ... 110
18 PAHO/WHO full-time professional and technical staff assigned to country, inter-country and inter-zone malaria eradication programs in the Americas, 1958-1968 ... 119
19 Drugs provided by PAHO to malaria eradication programs in the Americas, 1958-1968 ... 120
20 International contributions to malaria eradication programs in the Americas, 1968 and estimated 1969 ... ... 122
Country tables showing the status of the malaria eradication programs at December 1968 Argentina ... 24
Bolivia ... 28
Brazil ... 31
Colombia ... 36
Costa Rica ... 39
Cuba ... 42
Dominican Republic ... ... ... ... 45
Ecuador ... 48
El Salvador ... 51
Guatemala ... 54
Guyana ... 57
Haiti ... 60
Honduras ... 63
Jamaica ... 66
Mexico ... 68
Nicaragua ... 71
-Country tables: (Cont.)
Page
Panama ...
74
Paraguay ...
77
Peru ...
80
Trinidad and Tobago ...
84
Venezuela
...
86
British Honduras ...
90
Dominica ...
92
French Guiana ...
...
94
Grenada and Carriacou ...
97
Guadeloupe ...
99
Panama Canal Zone ...
101
St. Lucia ...
103
Surinam ...
105
10...
-REPORT ON THE STATUS OF MALARIA ERADICATION IN THE AMERICAS
XVII REPORT
Introduction
The Director of the Pan American Sanitary Bureau has the honor to present to the
XIX Meeting of the Directing Council the XVII Report on the Status of Malaria Eradication in the
Americas.
The report has four chapters. The first chapter contains information and discussion of
the status of the program in general, numerical and graphical country-by-country presentations
showing the history and present condition of each program. The second chapter relates to special
technical problems which have arisen and the measures which are being applied to overcome them.
Research currently in progress is treated in the third chapter. The last chapter concerns with
inter-national cooperation in malaria eradication programs.
Data presented in this report are taken from answers received from each country to a
detailed annual questionnaire, and from periodic statistical reports submitted to the Pan American
Sanitary Bureau by most of the programs, supplemented by data from plans of operation and from
special technical reports concerning research projects.
I. STATUS OF MALARIA ERADICATION PROGRAMS
A. General Picture
Of the 484, 600, 000 inhabitants that constitute the population of the Americas, 174,704,000
(36%) live in the originally malarious areas. Of the latter, 118,247, 000 (67. 7%) reside in the areas
in consolidation and maintenance phases, leaving 56, 234, 000 persons (32. 2%) still exposed to this
disease in the area in attack phase. Because of the difficulties in access to their places of
resi-dence, 217, 000 persons (0. 1%) continue to have no protection at all from malaria infection.
Considering the Continent by its sub-regions, North America is entirely in maintenance
phase. In Middle America, 56% of the population living in the originally malarious area is now in
consolidation and maintenance phases, and 44% in attack phase. In South America, one half of the
population in the originally malarious area now live in areas in consolidation and maintenance phases
and the other half in area in attack phase. The changes observed since 1967 have been favorable:
4,200, 000 inhabitants were freed from the risk of infection and their area of residence was passed
from attack to consolidation phase, and in 1968, for the first time, the entire originally malarious
area was brought under attack phase with the application of attack measures, except for the area of
47, 000 km
2with 217, 000 inhabitants as previously mentioned.
CD19/2 (Eng.)
Page 2
ISLANDS
AND CAICOS ISLANDS
AND TOUAG0
HONDURAS mnnuollpc
Uv aII
lENCH GUIANA ECUMAD
EL SALI
Sao Paulo State
URUGUAY
ARGENTINA
AREAS IN WHICH MALARIA HAS DISAPPEARED OR NEVER EXISTED
AREAS WHERE MALARIA HAS BEEN ERADICATED
AREAS IN THE CONSOLIDATION PHASE
AREAS WHERE THE CONSOLIDATION PHASE HAS NOT BEEN REACHED AND WHERE MALARIA EXISTS
STATUS OF THE MALARIA ERADICATION PROGRAM IN THE AMERICAS, 31 DECEMBER 1967.
il
CD19/2 (Eng. ) Page 3
IS AND CAICOS ISLANDS
RMUDA IRGEN ISLANDS UI..) wVISGEN ISLANDS I1.S.1
' ANGUILLA
MEXI(
CUBA
i VENEZUELA'
COLOMBIA
zC --- TRINIDAD AND TOBAGO SURINAM
tn;- FRENCH GUIANA
PERU
BOLIVIA
CHILE
AREAS IN WHICH MALARIA HAS DISAPPEARED OR NEVER EXISTED
M 3!AREAS
WHERE MALARIA HAS BEEN ERADICATEDI
AREAS IN THE CONSOLIDATION PHASED
AREAS WHERE THE CONSOLIDATION PHASE HAS NOTBEEN REACHED AND WHERE MALARIA EXISTS
PARAGUAY
URUGUAY
ARGENTINA
MAP 2
Jcu.
CD19/2 (Eng.)
Page 4
In 1968 the American malaria eradication programs passed a point of considerable
historic interest -they achieved the state of having the population of practically all the
origi-nally malarious areas of the Americas under protection. The 3.3 million square kilometers which have
been in preparatory phase in Brazil, and the whole malarious area of Paraguay which was also in
this phase since 1961, were brought into attack phase in the latter part of the year, leaving no
ma-larious areas without program activities, save tiny enclaves in Colombiainwhichitis
tempo-rarily impossible to work because of civil unrest.
Some of the areas in Argentina, Brazil, Cuba, Dominican Republic, and Peru were passed
from attack phase to consolidation phase, and other areas in Argentina, Dominican Republic, and
Peru from consolidation to maintenance phase.
Table 1
COMPARISON OF 1967 AND 1968 POPULATION AND AREA BY PHASE
IN COUNTRIES WITH PROGRAMS ACTIVE AFTER 1955, AND CHANGE IN PER CENT
Phase
1967
1968
Percentage
change
A. Population in thousands:
1. Malaria eradication claimed or registered
13 220
14 059
+
6. 3
2. Consolidation phase ...
41 581
45 812
+ 10. 2
3. Attack phase ...
44 766
56 234
+ 25.6
4. Preparatory phase or not yet started ...
12 834
217
- 98. 3
B. Area in km
21. Malaria eradication claimed or registered
828 832
720832
- 13. 0
2. Consolidation phase ...
2 162 540
2 112 056
-
2. 3
3. Attack phase ...
6599251
10444843
+ 58.3
CD19/2 (Eng. )
Page 5
Table 2
POPULATION OF THE AMERICAS IN AREAS IN MAINTENANCE AND CONSOLIDATION
PHASES, BY YEAR, 1960-1968, AND ANNUAL PER CENT OF INCREASE
Population in thousands
Year
Malaria
Annual % of increase
eradication
Consolidation
claimed or
phase
Malaria
Consolidation
achieved
eradication
phase
claimed
1960
50 741
1991
-
-1961
53 357
13 879
5.2
597.1
1962
55 397
25 914
3.8
86.7
1963
56 546
33 901
2. 1
30. 8
1964 57 414 32 277 1. 5 - 4.8
1965
60 975
34 731
6. 2
7. 6
1966
69 760
36128
14.4
4. 0
1967
70720
41581
1.4
15. 1
1968
72 441
45 806
2. 4
10. 2
B. Current Extent of the Problem
In analyzing the programs from technical, operational and administrative view points, it
was considered that of the 113, 222, 000 persons living in the area with active malaria eradication
campaign, exists the probability of achieving malaria eradication in very short period of time in 5%;
with good prospects in 54%, with certain technical and operational problems in 17%, with serious
ad-ministrative difficulties (although some of them being solved) in 13% and with very serious technical
problems in the rest 11%. The progress of the campaign of the last group depends not only on
ade-quate financial support, but also on complementary
attack measures which may alter the current
strategy completely. The greater part of this 11% corresponds to Central America.
In the area in maintenance phase, which spread over 13 political units, 2,868 malaria
cases were found, of which 91. 0% were from the United States of America. Only 33 cases were
originated in the area. In Venezuela, the situation was considerably improved in comparison with
that in previous years (See Table 3).
The area in consolidation phase includes 17 political units with a total area of 2, 112, 056
km
2and a total population of 45, 812, 000. In this area, 20, 202 malaria cases were found, giving an
Annual Parasite Incidence (API) of 0. 4 per 1, 000 inhabitants. Considering the area by countries, 8
have an API of 0. 5 or less, and 9 have more than 0. 5 which indicates that some of the area in
con-solidation phase should not have been in this phase. El Salvador has an API of 8. 5,
and for
this reason it was recommended to pass the area from consolidation phase to attack phase in 1969.
(See Table 4).
Detailed figures of population and area by phase of program for each country and
terri-tory of the Americas are presented in Tables 5 and 6, and the main features of activites and results
from the initiation of operations through 1968 are given for each active program in the country tables,
to facilitate the proper interpretation of the current condition.
Table 3
EPIDEMIOLOGICAL EVALUATION IN AREAS UNDER MAINTENANCE PHASE IN MALARIA ERADICATION PROGRAMAS, 1968
Species of parasite Origin of infections
Number Total
Unclassi-Country or other of Noitve P. falci- P. malar- Autoch- from Intro fed or
abroad within
investi-_ investi-_ investi-_ investi-_ investi-_ investi-_ investi-_investi-_ investi-_ investi-_c o u n tr y g a te d
Argentina ... 103958 35 _ 35 _ 27 7 I 1
Brazil ... 19690 a) 10 - 10 - - -_ -_ 10
Dominican Republic 55 007 3 2 1 i 1 2
-Guyana ... 23153 17 7 10 _- - 17
Jamaica ... 99581 2 1 1 - - _ 2
Peru ... a31829 6 - 5 1 - - - 1 1 - 4
Trinidad and Tobago.... 65 757 5 4 - 1 - 1 4
-United States of
Americab) ... 1 4 9 4c 261 0d) 344 2 125 32 - - 2 598 5 7
Venezuela ... 325885 .. ... 180 20 155 5 16 0 42 87 2 32 1
Dominica ... . 5197
19
- - - --Grenada and Carriacou 218- _
Guadeloupe ...
1..
14018-St. Lucia ... 6 77 1 -
-Total ... 752558 2 86 8d) 378 2342 39 43 2 2 648 122 3 37 13
a) Up to October. b) Including Puerto Rico.
c) Includes only those slides examined at NCDC.
Table 4
EPIDEMIOLOGICAL EVALUATION IN AREAS IN CONSOLIDATION PHASE IN MALARIA ERADICATION PROGRAMS, 1968
Species of parasite Origin of infections
Total Imported
Country or other Population No. of of API API Au-
Unclassi-political unit (thousands slides Total Total P. falci- P. malar Relaps- from Induced Intro- fled
(hu dexamined positive (a) iae tparum- ing from areas duced or not
.cases - nous abroad within
investi-country gated
Argentina ... 423 75 300 126 0. 3 0.2 - 126 - 101 - 8 6 - - 11
Bolivia ... 1245 89 639 828 0. 7 0.4 184 644 - 499 13 7 52 - - 257
Brazil (Excl. Sao Paulo).. 5 926 537 34 7c 1 148C 0. 2 0. 04 591 556 1 261 11 4 542 3 17 310
Brazil (Sao Paulo) ... 51 5 2d, 123 277 578 0. 1 0. 01 261 317 - 99 1 4 426 1 1 46
Colombia ... 7 803 381 362 2 464 0. 3 0. 05 1166 1294 4 419 5 22 1609 2 14 393
Costa Rica ... 156 26140 35 0. 2 0.1 - 35 - 11 5 - 10 - 8 1
Cuba ... 2 734 834 107 4 0. 0 - 4 - - - 4 -
-Dominican Republic ... 3 321 386 692 1 0. 0 - - - 1 - - - -
-Ecuador ... 1376 151 392 4 660 3. 4 0.1 318 4 342 - 190 3 - 1369 - 8 3 090
El Salvador ... 505 112 640 4 305 8. 5 1. 0 55 4 250 - 487 592 47 773 - - 2 406
Honduras ... 1 124 22 5 022 2 329 2.1 0. 9 384 1 945 - 1 015 147 31 242 - - 894
Mexico ... 13574 988165 3554 0. 3 0.1 4 3535 15 2128 407 3 380 15 8 613
Peru ... 2184 85 336 34 0. 01 0. 0 1 31 2 10 6 1 9 1 - 7
British Honduras ... 48 1581 - 0.0 - - -
-French Guiana ... 13 5117 22 1.7 0. 3 16 6 - 4 - 8 10 -
-Panama Canal Zone ... 50 22 367 89 1. 8 1. 4 5 84 - 70 8 10 - - - 1
Surinam ... 178 13055 25 0.1 0.0 24 1 - - - 4 17 - - 4
Total ... 45812 4 058 539 20202 0.4 0.1 3009 17 170 23 5 294 1199 153 5445 22 56 8 033
a) Total number of cases founded in the area, by 1,000 inhabitants. c) Up to October. d) 1967 figures.
b) Number of cases originated in the areas (autochthonous and introduced), by 1, 000 inhabitants.
o0(.
-PZ
CD19/2 (Eng.)
Page 8 Table 5
STATUS OF MALARIA ERADICATION IN THE AMERICAS, BY POPULATION, 1968 (Population in thousands)
Population of originally malarious areas
~~~~~Malaria
~Prep.
phaseCountry or other Total eradication Consolidation Attack or program
political unit population Total claimed phase phase not yet
(maintenance started
phase)
Total
%
Total%
Total%
Total%
Total. . . . . r I
Argentina ... 23 040a) 2 943 12.8 1631 55.4 423 14.4 889 30.2
Barbados ... 2 4 8a) 248 100.0 248 100.0 - -
-Bolivia ... 4700 1491 31.7 - - 1245 83.5 246 16.5 -
-Brazil ... 88102b) 37291 42.3 780 2.1 11078 29.7 25433 68.2
Canada ... 2 0 7 7 2b) )
Chile ... 93 5 1 ) 1 5 a) 159a) 100.0 - - -
-Colombia ... 20131 11222 55.7 - - 7803 69.5 3 202 28.5 217 2.0
Costa Rica ... 1648 510 30.9 - 156 30.6 354 69.4
-Cuba ... 8 074 2734 33.9 - - 2 734 100.0 - -
-Dominican Republic ... 4029 3 995 99.2 208 5.2 3 321 83.1 466 11.7
-Ecuador ... 5 417 2 941 54.3 - - 1376 46.8 1565 53.2
-El Salvador ... 3215 2180 67.8 - 505 23.2 1675 76.8
-Guatemala ... 4 8 5 8c) 2 214 43.6 - - - - 2 214 100.0
-Guyana ... 702 702 -100.0 658 93.7 - - 44 6.3
Haiti ... 4 674 3 500 75.0 - - - - 3500 100.0
-Honduras ... 2 325 2 029 87.3 d 1124 55.4 905 44.6
-Jamaica ... 1913 1 530 80.0 15 3 0d) 100.0 -
-Mexico ... 45176 22 398 49.6 - - 13 574 60.6 8824 39.4
Nicaragua ... 1818 1818 100.0 - - - 1818 100.0
-Panama ... 1372 1317 96.0 - - 1317 100.0
-Paraguay ... 2 331 2101 90.1 - - - - 2101 100.0
-Peru ... 12778 4460 34.9 1 1 12d! 25.0 2184 49.0 1164 26.0
Trinidad and Tobago .... 1036 885 85.4 885 ) 100.0 - - -
-United States ... 199 861e) 55 549 27.8 55549 100.0 -
-Uruguay ... 2 8 1 8 -
-Venezuela ... 9 307 6 933 74.5 6 5 4 5f ) 94.4 - - 388 5.6
Antigua ... 6 1....a)
Bahamas ... 144a)
Bermuda ... 51a ) -
-British Honduras ... 119 119 100.0 - 48 40.3 71 59.7
Dominica ... 70 18 25.7 18d) 100.0 - - -
-Falkland Island ... 2 - - - -
-French Guiana ... 41a) 4 1a) 100.0 2 5a) 61.0 13a) 31.7 3a) 7.3
Grenada and Carriacou .. 104 34 32.7 3 4d) 100.0
-Guadeloupe ... 330 289 87.6 289 100.0
-Martinique ... 3 3 3a) 2 0 7a) 62.2 2 0 7a) 100.0
-Montserrat ... 15a -
-Netherland Antilles ... 2 1 2a) - - -
-Panama Canal Zone .... 50 50 100.0 - - 50 100.0 -
-Puerto Rico ... 2 747a) 2 416 88.0 2 416 100.0 - -
-St. Kitts-Nevis-Anguilla ; 61- _ .
-St. Lucia ... 112 96 85.7 9 6d) 100.0
-St. Pierre-Miquelon .... 5a) - -
-St. Vincent ... . 9 3a) - -
-Surinam ... 358 233 65.1 - _ 178 76.4 55 23.6
Virgin Islands (U. K. )... 9a) - - -
-Virgin Islands (U. S. )... 5 1a) 51 100.0 5 1a) 100.0 - - -
-Total ... 484 664 174704 36.0 72441 41.5 45 812 26.2 56234 32.2 217 0.1
- None.
a) 1967 figures. b) Figures from "Monthly Bulletin of Statistics" United Nations, Feb. 1969. c) Estimated by Government, July 1968. d) Population in areas where eradication of malaria has been certified by PAHO.
CD19/2 (Eng.)
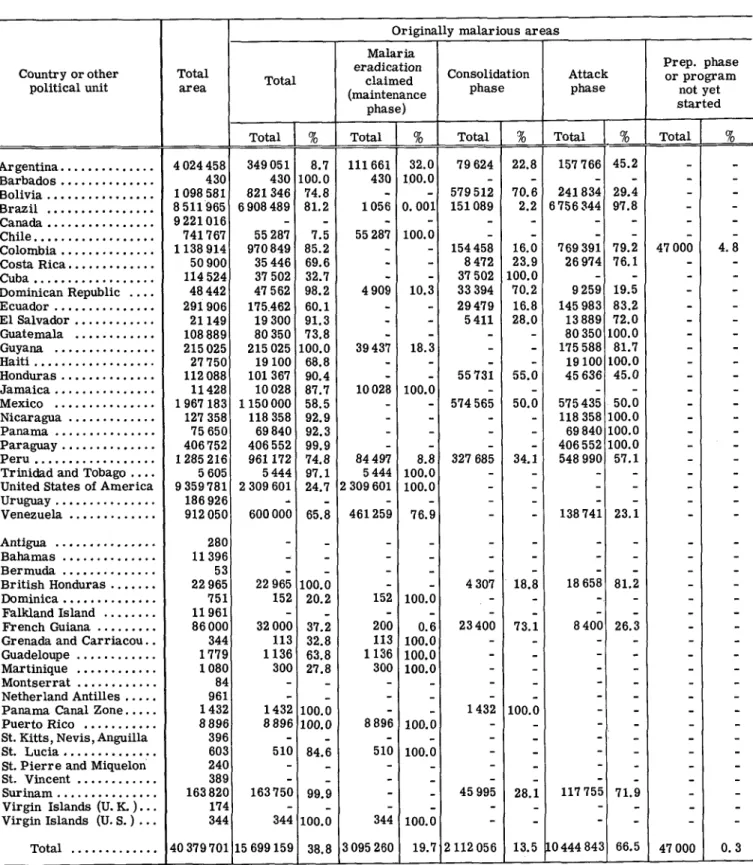
Table 6 Page 9
STATUS OF MALARIA ERADICATION IN THE AMERICAS, BY AREA, 1968 (Area in km2)
Originally malarious areas Malaria
~~~~eradication
~Prep.
phaseCountry or other Total Total claimed Consolidation Attack or program
Total claimed
political unit area (maintenance phase phase not yet
phase) started
Total
I
% Total | % Total[
%
Total!
Total rtArgentina ... 4024458 349051 8.7 111661 32.0 79 624 22.8 157 766 45.2 -
-Barbados ... 430 430 100.0 430 100.0 - - -
-Bolivia ... 1098 581 821346 74.8 - - 579512 70.6 241834 29.4
Brazil ... 8511965 6908489 81.2 1056 0.001 151089 2.2 6756344 97.8 -
-Canada ... 9221016 - - -
-Chile ... 741767 55 287 7.5 55 287 100.0 - - -
-Colombia ... 1 138 914 970849 85.2 - - 154458 16.0 769391 79.2 47 000 4.8
Costa Rica ... 50900 35446 69.6 - - 8 472 23.9 26974 76.1 -
-Cuba ... 114524 37 502 32.7 - - 37 502 100.0 -
-Dominican Republic .... 48 442 47 562 98.2 4 909 10.3 33 394 70.2 9259 19.5 -
-Ecuador ... 291906 175.462 60.1 - - 29479 16.8 145983 83.2 -
-El Salvador ... 21149 19 300 91.3 - - 5411 28.0 13889 72.0 -
-Guatemala ... 108889 80 350 73.8 - - - - 80 350 100.0 -
-Guyana ... 215 025 215 025 100.0 39 437 18.3 - - 175588 81.7 -
-Haiti ... 27750 19100 68.8 - - - - 19100 100.0
-Honduras ... 112088 101367 90.4 - - 55731 55.0 45636 45.0 -
-Jamaica ... 11428 10028 87.7 10028 100.0 - -
-Mexico ... 1967183 1150000 58.5 - - 574565 50.0 575 435 50.0
-Nicaragua ... 127 358 118 358 92.9 - - - - 118 358 100.0
Panama ... 75 650 69840 92.3 - - - 69840 100.0
Paraguay ... 406752 406552 99.9 - - - - 406552 100.0
Peru ... 1 285 216 961172 74.8 84 497 8.8 327 685 34.1 548990 57.1
Trinidad and Tobago .... 5 605 5444 97.1 5 444 100.0 - - -
-United States of America 9359781 2 309 601 24.7 2 309 601 100.0 -
-Uruguay ... . 186 926 -
-Venezuela ... 912 050 600000 65.8 461259 76.9 - - 138 741 23.1
Antigua ... 280
Bahamas ... 11396 -
-Bermuda ... 53 -
-British Honduras ... 22 965 22 965 100.0 - - 4 307 18.8 18 658 81.2
Dominica ... 751 152 20.2 152 100.0 - - -
-Falkland Island ... 11961 - - -
-French Guiana ... 86000 32000 37.2 200 0.6 23400 73.1 8400 26.3
Grenada and Carriacou.. 344 113 32.8 113 100.0 - - -
-Guadeloupe ... 1779 1136 63.8 1136 100.0
Martinique ... 1080 300 27.8 300 100.0
Montserrat ... 84 - -
-Netherland Antilles ... 961 -
-Panama Canal Zone ... 1432 1432 100.0 - - 1432 100.0 - -
-Puerto Rico ... 8896 8896 100.0 8896 100.0o -
-St. Kitts, Nevis, Anguilla 396-
-St. Lucia ... 603 510 84.6 510 100.0 - -
-St. Pierre and Miquelon 240 _ - -
-St. Vincent ... 389 - - -
-Surinam ... 163820 163750 99.9 - - 45995 28.1 117755 71.9 -
-Virgin Islands (U. K. )... 174 - _ -
-Virgin Islands (U. S. ) ... 344 344 100.0 344 100.0 - - _
CD19/2 (Eng.)
Page 10
In Central America, great progress was made in bringing the situation under control in
the problem areas, through the coordinated intensified attack phase initiated in late 1967. The number
of cases of malaria in total in the five countries in which intensified attack was begun,was reduced to
only 51% of the number in 1967, despite greater case-detection activity; the percentage of
blood-smears examined, which were found to be positive for malaria, fell from 7.4% in 1967 to 2.9% in 1968.
Honduras experienced the least reduction in incidence, because of an outbreak in an attack- phase
area, which heralded the advent of DDT-resistance in this section, where A. albimanus had
previ-ously been DDT-susceptible. Agricultural spraying as a result of the introduction of cotton
culti-vation into the area is considered to be the reason for the development of resistance. The area of
the outbreakhasa populationof some 20,000 persons; thelimitsof the new area of vector resistance
to DDT are being investigated through susceptibility testing. The progress of the individual country
programs, which were implementing intensified coordinated attack during 1968 in Central America, is
shown graphically in Figure 1. Despite the fine progress shown, there is concern aboutthe rising
rate of refusals by thepopulationto accept collective treatment with antimalarial drugs, a primary
attack measure in areas with DDT and dieldrin resistant vectors.
British honduras also made excellent progress, finding only 38 cases during the year.
In Panama, eventhough the three-year coordinated attack phase was not fully implemented because of
delays in funding and administrative arrangements, the level of cases was sharply reduced.
The Colombian program has had difficulties in the normal developments of its activities
in the many colonization areas which are rapidly filling up with population, and impossibility of
pene-tration in some well defined areas.
Innovations in attack methods are devised to meet the demands
of the local situation in the colonization areas. It is expected that the next two-year attack measures
can be applied in the area with social problems.
Ecuador's campaign improved its financial problem during the year and was able to bring
its field activities into full operation late in the year.
In the Peruvian program the financial problem forced some reduction of the operating
level. In this program also, supplementary attack measures are designed to meet the particular
problems posed by such gruops as indigenous forest-dwelling people whose housing does not present
adequate surfaces for a full action by residual insecticide. (See Chapter II). Progress was made by
passing some areas from attack phase to consolidation, and some areas from consolidation phase to
maintenance during 1968.
In the maintenance area, a few malaria cases imported from other malarious areas of
the same country continued to be controlled.
The Government of Peru requested and received the
visit of an evaluation team during 1968, which recommended an increase in vigilance activity levels
in the maintenance areas and development of equivalent capabilities in an area with a population of
410,000, now in consolidation phase, which is ready for passage to maintenance when minimum
cri-teria for vigilance activities can be met by the general health services. Table 3 presents
informa-tion on case-detecinforma-tion and positive blood smears encountered in areas in maintenance phase during
1968.
In Bolivia some deterioration occurred in the malaria situation, a result of restricted
surveillance activities forced by insufficient budget.
This campaign faces no technical problems
and has shown its ability to solve operational difficulties and clear even difficult areas, but needs
more financial support. The Tomina river area in Chuquisaca, cleared after considerable effort through
the use of collective treatment and seasonal spraying, was reinfected during 1968, and several small
foci were discovered in the consolidation phase area of La Paz. An area of persistent transmission
on the Pilcomayo river was put under collective treatment on two-week cycles and has ceased
pro-ducing cases of malaria.
CD19/2 (Eng. ) Page 11
FIGURE 1
NUMBER OF CASES OF MALARIA IN THE COUNTRIES OF CENTRAL AMERICA
1961-1968
-COSTA
RICA
-EL
SALVADOR
...
GUATEMALA
-- '-HONDURAS
---NICARAGUA
1966
1967
1968
1961
1962
LIJ
IL.
Z
C
oc
ui 2
U-Co Q2
1964
1965
CD19/2 (Eng.)
Page 12
In Surinam the medicated salt distribution improved, with better acceptance by the
popu-lation, although on the uppermost part of Surinam River there is still some reluctance. The result
of the wider use of the salt was in clear evidence in the lower malaria incidence figures. This
program continues to have administrative and personnel problems.
In French Guiana, medicated salt was used along the river bordering Surinam, and this
coordinated attack with that of the Surinamese program produced good results.
In Venezuela some small areas were returned from consolidationphase to attack, because
of transmission evidenced in recent periods. The general level of incidence remained relatively
un-changed.
Brazil, as noted above, brought almost all its remaining preparatory-phase areas, with
a population of some 10 million persons, into attack phase at mid-year. The setting-up of operating
headquarters, planning of itineraries, and other necessary prerequisites have been performed and
attack measures, have been initiated, although in some parts, particularly in the Amazon basin areas
truly full coverage will need time for development and greater depth of entomological knowledge and
of the habits of the human population is necessary before attack measures can be made satisfactorily
effective.
This information will be acquired with operations in the area and through continued study of
the vectors. The areas which were already in attack phase showed good progress, and some of them
were passed to consolidation phase. A small area in consolidation phase was found reinfected and
reverted to attack.
A lengthy period of planning and negotiation was satisfactorily concluded in Paraguay and
the entire malarious area of the country (which includes nearly the entire country) entered attack
phase in October. The plan of operations calls for a four-year attack phase with semi-annual cycles
of DDT in the high-incidence area, a shorter attack period of not more than three years in
thelow-incidence areas, and spraying along river courses in the south.
There is excellent popular and
governmental support for the program.
In Argentina new areas were added to maintenance phase and other advanced to
conso-lidation phase, The campaign still suffers from inadequate financing, which has prevented faster
progress and permitted the appearance of small outbreaks in maintenance areas. These outbreaks
were controlled during the year.
The Dominican Republic program was able to pass most of its malarious area, with 2,500, 000
inhabitants into consolidation phase, keeping a small area in the frontier with Haiti in attack on the
basis of recommendations of an evaluation team which assessed the program. An area of 5, 000 km
2with a population of 208, 000 was passed from consolidation to maintenance phase.
Cuba was able to pass all its malarious area from attack phase to consolidation during
1968.
In addition, the Malaria Eradication Service has been integrated into the General Health
Services.
In Haiti an evaluation team recommended DDT-spraying in some areas, DDT and mass
drugs in others, and passive case-detection only in some. Mass drug administration was initiated
before the transmission season on the basis of previous incidence level rather than as a focal- attack
measure. Results were good over-all but were impaired in two areas which experienced localized
outbreaks with considerable number of cases. Spraying activities were curtailed near the end of the
year for operational and budgetary reasons, but will be reinitiated in 1969.
C. Field Operations
CD19/2 (Eng.) Page 13
Table 7
PERSONNEL EMPLOYED IN MALARIA ERADICATION PROGRAMS IN THE AMERICAS 31 DECEMBER 1967 AND 1968, BY CATEGORY
(Part-time personnel in parentheses)
Title 1967 1968
Engineers ...
Spraying Chiefs (non-professionals) ...
Sector Chiefs ... Squad Chiefs ...
Spraymen ... Draftsmen ...
SUB-TOTAL ...
Physicians ... Entomologists ... Entomologist Assistants ...
Statisticians and Statisticians' Assistants ... Evaluation Inspectors ...
Evaluators ...
Microscopists ... SUB-TOTAL ...
Administrators ... Administrative Assistants ... Accountants ... Disbursing Officers ... Storekeepers ... Storekeepers' Assistants ... Secretaries ... Others ...
SUB-TOTAL ...
Transport Chiefs, Mechanics and Assistant Mechanics Drivers ...
Motorboat Operators ... Boatmen ...
SUB-TOTAL ...
GRAND TOTAL ...
96 (1) 282 (2) 705 2053 8961 (7 1)a)
141 12238 (74)
233 (21) 46 (2) 215 (2) 311
1 144 (2)a)
7 2 13a)
989 (14) 10151 (41)
160 1 197 35 92 109 174 338 1430 (1) 3535 (1)
771 1470 (2)
339 (2) 329 2 909 (4)
28 833 (120)
96 (1) 350 (2) 611 1923 13048 (8 0)a)
214 16242 (83)
256 (7) 38 (16) 212 (3) 249 943 (1)a)
6 84 3a)
1064 (88) 9605 (115)
222 1250 76 100 114 391 379 (2) 1684 (1) 4216 (3)
709 1838 (2)
485 (2) 318 3 350 (4)
33413 (205)
a) Includes personnel with same category from the mass drug treatment program. Up,
0 2
0
m P
So
0 p
-z
S RI
0 p4
Ed
CD19/2 (Eng.) Page 14
Table 8
PERSONNEL EMPLOYED IN SPRAYING OPERATIONS IN MALARIA ERADICATION PROGRAMS IN THE AMERICAS - 31 DECEMBER 1968
(Part-time personnel in parentheses)
Sanitarians
Country or other or Sector Squad praymen Draftsmen
Total Engineers Chiefs Chiefsmen
political unit Spraying Chiefs Chiefs
Chiefs
Argentina ... 140 2 3 7 27 86 15
Bolivia ... 49(60) - 9 a) 2 4a) 1 15(60)
Brazil ... 8 309 37 228 106 707 7177 54
Colombiab) ... 1152 7 22 68 271 768 16
Costa Rica ... 164 - 2 29 34 96 3
Dominican Republic ... 70 1 2 - 10 57
-Ecuadorb)... b)428 2 4 37 61 322 2
El Salvador ... 457 1 5 20 82 347 2
Guatemala ... 576 - 6 18 92 456 4
Guyana ... 32 - - - 6 26
-Haiti ... 220 1 14 22 31 148 4
Honduras ... 257 - 8 8 39 201 1
Mexico ... 2 406 35 - 158 279 1 9 1 6c) 18
Nicaragua ... 338 1 7 23 56 2 4 9d) 2
Panama ... 243 1 2 9 43 187 1
Paraguay ... 471 2 7 21 86 350 5
Peru ... 197 4 1 6a) 29a) 33 109 6
Trinidad and Tobago ... 119 - 1 1 2 8 8d) 27
Venezuela e) ... 472 2 _ 27 40 350 53
British Honduras ... 25 - 1 - 4 20
-French Guiana ... 71 - 12 - 8 51
Panama Canal Zone ... (23) (1) (2) - _ (20) d)
Surinam ... 46 - 1 4 11 29 1
Total ... 16 242 (83) 96(1) 350 (2) 611 1 923 13 048 (80) 214
... No information.
- None.
Table 9
PERSONNEL EMPLOYED IN EPIDEMIOLOGICAL EVALUATION OPERATIONS IN MALARIA ERADICATION PROGRAMS IN THE AMERICAS - 31 DECEMBER 1968
(Part-time personnel in parentheses)
Statisticians Microscopists
Country or other Total Physicians Entomologists Assistant and Evaluation Evaluators and laboratory
political unit Entomologists Statisticians' Inspectors personnel
Assistants
Argentina ... 215(1) 6(1) 2 2 2 26 151 26
Bolivia ... 111 8 - 2 6 3 79 13
Brazil ... 2.289 83 7 42 102 151 1 636 268
Colombia a) ... 966 12 3 1 3 122 767 58
Costa Rica ... 155 2 - 2 2 7b) 1 25b) 17
Cuba ... 346 - - - 4 48 238 56
Dominican Republic ... 216 2 1 3 5 25 c) 143 37
Ecuador a... 178 10 - 5 4 124 35
El Salvador ... 637 8 1 10 7 34b) 52 2a) 55
Guatemala ... 517 3 1 15 6 2 3b) 4 37b) 32
Guyana ... 29 1 - - 3 1 20 4
Haiti ... 1 109 9 1 12 13 17 5b) 81 7b) 82
Honduras ... 487 3 - 5 16 5 9b) 3 45b) 59
Jamaica ... 78(1) 13(1) - 1 14 35 14
Mexico ... 254 59 10 13 14 33 (d) 125
Nicaragua ... 685 4 1 6 13 8 6b) 5 34b) 41
Panama ... 50(3) 1 1 3 5 - 28 12(3)
Paraguay ... 76(6) 1 2(6) 7 13 - 36 17
Peru ... 288 6 4 16 18 29 1 7 9b) 36
Trinidad and Tobago ... 123 2 1 39 1 1 70 9
Venezuela e) ... 697 21 2 16 9 85 506 58
British Honduras ... 12(1) (1) - - - 1 10 1
Dominica ... 5(1) (1) - - 2 2 1
French Guiana ... 6 1 1 2 _ 2
Grenada ... 24(1) - - 10 - 14 - (1)
Guadeloupe ... 7(4) 1 (1) (1) _ - - 6 (2)
Panama Canal Zone ... (17) (1) (1) (3) -- - (12)
Puerto Rico ... (78) - (8) _ - - - (70)
St. Lucia ... 3(1) - - - (1) 3
Surinam ... 42(1) (1) - - 2 4 30 6
Total ... 9 605(115) 256(7) 38(16) 212(3) 249 943(1) 6843 1 064(88)
Pd 0
CD A
UC.;
I-_ ,n
'R
... No Information.- None.
a) October. b) Includes personnel with same category from drug distribution program. c) Performing supervision for spraying operations also.
Table 10
PERSONNEL EMPLOYED IN ADMINISTRATIVE AND OTHER SERVICES IN MALARIA ERADICATION PROGRAMS IN THE AMERICAS - 31 DECEMBER 1968
(Part-time personnel in parentheses)
Country or other Adminis- minis- Disbursing Storekeepers'
Assistants
po nliticay olr unitht | Total
{
Atdramtionri~s At t sativn A ccountantsI
DO ffiucre~risng F Storekeepers r~tA s s istants Secretaries O thersArgentina ... 136 7 73 - 5 3 6 1 41
Bolivia... 30 7 3 1 1 1 2 7 8
Brazil ... 1867 144 817 36 43 43 314 35 435
Colombia a) ... 336 18 16 7 16 18 8 81 172
Costa Rica ... 44 2 2 1 5 3 6 6 19
Dominican Republic ... 42 1 5 1 - 2 2 2 29
Ecuador a) .93(1) 5 1 6 5 5 1 17 53(1)
El Salvador ... 370 6 8 1 1 2 4 9 339
Guatemala ... 105 1 4 5 5 1 4 21 64
Guyana ... 26 - - - - 1 1 1 23
Haiti ... 84 3 5 2 1 4 - 24 45
Honduras ... 57 2 20 1 - 2 2 8 22
Jamaica ... 21 1 2 - - - - 3 15
Mexico... 654 13 244 4 13 13 18 127 222
Nicaragua ... 91 1 13 5 - 5 9 12 46
Panama ... 34 1 10 1 - 1 2 6 13
Paraguay ... 83 1 14 1 4 1 1 3 58
Peru ... 86 6 11 3 - 5 7 11 43
Trinidad and Tobago .. 23 1 1 1 _ 2 2 1 15
Venezuela... (b) (b) (b) (b) (b) (b) (b) (b) (b)
British Honduras ... 3 1 - _ _ _ _ 2
French Guiana ... 3 2 1
Panama Canal Zone ... (2) _- - - (2)
Surinam ... 28 1 1 - 1 2 2 - 21
Total... 4216(3) 222 1250 76 100 114 391 379(2) 1 684(1)
- None.
a) October.
b) Services performed by personnel of the
CD 19/2 (Eng. )
Page 17
Table 11
PERSONNEL EMPLOYED IN TRANSPORT SERVICES IN MALARIA ERADICATION PROGRAMS
IN THE AMERICAS - 31 DECEMBER 1968
(Part-time personnel in parentheses)
Transport
Chiefs,
Country or other
mechanics
Motorboat
political unit
and assistant
Drivers
operators
mechanics
_ _ _ _ _ _ _ _ _ _ _ _ _ _ _ _ _ _ _ _ _ _ _ _ _ _ _ _ _ _ _
e h a i s
I_ _ _ _ _ __I_ _ _ _ _ _ __I_ _ _ _ _ _ _ _ _ _ __I_ _Argentina ...
92
44
48
Bolivia ...
48
9
31 a)
8a)
Brazil ...
1731
227
1 041
203
260
Colombiab) ...
409
97
106
172
34
Costa Rica ... 27 11 16
-Dominican Republic ... 43 20 23
-Ecuador b) ... 65 10 39 7 9
El Salvador ... 156 38 118
-Guatemala ... 70 20 50
-Guyana ... 17 1 5 6 5
Haiti ... 64 29 33 1 1
Honduras ...
79
15
62
2
Jamaica ...
37
4
33
-Mexico ...
141
103
25
13
Nicaragua ...
120
16
80
24
Panama ...
15
8
6
1
Paraguay ...
84
13
71
-Peru ...
77
24
21
32
Trinidad and Tobago ... 10 - 10
-Venezuela ...
(c)
(c)
(c)
(c)
(c)
British Honduras ... 2 2 -
-French Guiana ...
11
1
8
2
Panama Canal Zone ...
(4)
-
(2)
(2)
Surinam ...
52
17
12
14
9
Total ... 3 350(4) 709 1 838(2) 485 (2) 318
- None.
... No information.
a)
Performing duties as drivers and evaluators.
b)
October.
Id .
Table 12
MEANS OF TRANSPORT IN MALARIA ERADICATION PROGRAMS IN THE AMERICAS, 1968
Trucks Automobiles
Country or other Trucks and and Motor Boats
Cpolti cal uit (3 tons or "Pick-up" Jeeps station Motocycles Bicycles without addl Other
political unit more) more) (less than (less than boats motor and pack
3 tons) wagons animals
a b a
a
b a b a a a b a |ai b | bArgentina ... 1 6 88 39 30 7 9 1 - 54 12 2 -
-Bolivia ... ... - - 11 4 34 8 1 1 - 9 25 23 23 10 - - 95 61 d) 1 1d)
Brazil ... 66 - 385 - 951 - 55 - - - 810 - 381 - 83 - 3 000 8
Colombia ... 4 11 53 94 31 120 16 24 1 - 120 6 223 47 - - 1 503
-Costa Rica ... .... - 12 - 17 - 5 - 11 11 90 40 17 - - - -
-Cuba ... - - 12 7 60 9 - - - 177
-Dominican Republic ... 1 - 72 - 2 - 7 - 124 c) - 30 62 - - - - 73
-Ecuador ... ... 2 2 33 4 55 8 6 2 55 9 36 - 83 6 33 - 247 2 e)
El Salvador ... 1 1 58 2 35 2 8 - 125 4 3 - 2 3 - -
-Guatemala ... 2 1 45 18 36 10 30 4 93 55 126 149 5 7 - - - 1 2d) 10d)
Guyana ... I - - 1 1 4 - - - - 10 - 11 - - - 3
-Haitf ... 5 - 59 57 8 - 10 - - - - 2 - - - -
-Honduras ... 1 2 31 18 34 14 7 2 51 18 10 35 3 1 - - 143 1
Jamaica ... 2 - - 12 22 - 2 - - - 2 -
-Mexico ... 14 5 224 209 246 153 14 3 - - - - 13 5 - 2 0 7 0f)_
Nicaragua ... .... 2 - - 39 - 46 - 13 - 80 - 100 25 3 6 2
-Panama ... 2 - 48 6 17 3 8 - 6 - - - 19 12 - - 5
-Paraguay ... 2 - 78 10 - 15 14 3 21 3 3 - 14 - - - 8
Peru ... - - 46 3 16 2 65 1 - - - - 104 12 - -
-Trinidad and Tobago .... 2 2 6 - - -
-Venezuela ... 6 - 137 - 93 - 35 - 18 - 333 - 124 - - - 635 36g)
British Honduras ... - - 4 - 5 3 1 - - - - 3 1 - 6 2 -
-Dominica ... - - - - -_ 1 - 1 2 - - -
-French Guiana ... 1 - 1 - - - 2
2
1 - 5 - --Guadeloupe .. ... - _ 2 1 h)
Panama Canal Zone ... - 2h) - - 2h 2 h) . .
St. Lucfa ... - - - 1 -
-Surinam ... - - - 2 1 - 3 3 17 - 3 2 - 29 - -
-Total... 106 37 1340 515 1743 440 288 70 526 191 1655 432 1055 103 167 6 7959 120 21
- None
CD19/2 (Eng.)
Page 19
In spraying operations, the Central American countries, Brazil, Ecuador, Paraguay and
Haiti show the greatest increases. The increaseddimensionof activity in Brazil, with the addition of
the previous preparatory-phase areas to attack phase, is shown in the increase from 5,035 to 8, 309
persons engaged in sprayingoperations; the initiation of the attackphase in Paraguay is reflected in the
increase from 163 spraymen to 471; the ending of the paralysis of field operations in Ecuador shows
up in the change from 84 spraymen at the end of 1967 to 428 at the end of 1968. The increase are
primarily in the category of spraymen, spraying chiefs and draftsmen. The number of engineers
remained unchanged, although individual programs altered their employment figures.
The number employed in epidemiological operations increased slightly in total but in
some programs it was considerably increased. The number of physicians went up from 233 to 256.
The decrease in entomologists and statisticians and their assistants is sharpest in Mexico.
In all enterprises, increased operations require increased administrative services and
the number of administrators, accountants, storekeepers' assistants and other categories of
adminis-trative personnel has risen in comparison with 1967 levels. Adminisadminis-trative reforms have been
intro-duced in many campaigns to improve the efficiency of the supply chain, the flexibility of the responses
which can be made to changes in field needs, and the promptness of payments.
In transport operations, the increases are primarily in the categories of drivers and
motorboat operators. Brazil and Colombia show large increases in the latter as a result of the
ex-pansion of attack operations to Amazon areas under other fluvial-transport territories.
Brazil
and Paraguay account for the largest increases in drivers, mainly in connectionwith attack operations.
Means of transport continued to be supplied primarily through the generosityof UNICEF.
Since transport is the lifeblood of the malaria eradication operation, which can be carried out only
if it is possible to reach the most remote corners of the interior, this assistance is highlyvalued.
(See Table 12).
UNICEF also continued to supply most of the insecticides, laboratory needs, and
many smaller items. The dollar value and distribution among programs of UNICEF assistance can
be seen in Table 20 in Chapter IV.
In Table 13 is a summary of case-detection which has been done intheAmericas yearly
since 1958. Thedetails program byprogram are presentedinthe country tablesbyphase of program.
Table 13
SUMMARY OF CASE DETECTION IN THE AMERICAS, 1958-1968
Year
Number of slides
Number of slides
Per cent
examined
found positive
positive
1958
1 716 103
56705
3. 3
1959
2749 117
75 612
2. 8
1960
3 955 149
79 998
2. 0
1961
5 341004
99 539
1. 9
1962
7 221 367
177 089
2.4
1963
7 903 156
227 026
2. 9
1964
8 156 290
254 572
3. 1
1965
9 069 950
241462
2. 7
1966
11599783
333245
2. 9
1967
11 609226
369 341
3. 2
CD19/2 (Eng.)
Page 20
In Table 14 the data concerning active and passive case-detection are presented country
by country. The higher likelihood of encountering malaria cases among persons who present
them-selves to the passive case-detection network continues to be apparent, with 4. 66% positivity among
the smears collected as compared with 1. 05% in the smears collected through active case-detection.
D. Budget
Table 15 summarizes 1968 expenditures of the Government and PAHO for malaria
eradi-cation and estimated budgetary requirements for 1969, 1970 and 1971. The table also shows
esti-mated PAHO budgetary and personnel requirements.
Actual expenditures of the Governments for
malaria eradication in 1967 and 1968 and the budgets approved for 1969 are shown program by
program in Table 16. The 18.3% increase in national expenditures on malaria eradication in 1968 as
compared with 1967 is unmistakeable evidence of the determination of the Governments to push
eradi-cation activities to their goal and of their recognition of the need for adequate levels of financing if
this goal is to be reached in the optimum time and at the lowest possible total cost.
The advance of the Brazilian program with the inclusion in attack phase of the tremendous
area previously in preparatory phase marks a major step forward in coordination of activities among
programs, promising to reduce border problems for many South American programs. The increased
expenditures in 1968 reflect this expansion of operations. Paraguay's initiation of full-scale attack
operations will likewise have favorable repercussions for the Argentinian and Brazilian programs.
Central America experienced no financial difficulties during 1968.
The administrative and financial
problems which caused the delay in the initiation of the program in Panama will be solved in the near
future.
It is also expected that Mexico will be able to give new impetus to its program before
the situation on the border with Guatemala becomes of international concern.
Table 14
COMPARATIVE RESULTS OF ACTIVE AND PASSIVE CASE DETECTION IN MALARIA ERADICATION PROGRAMS IN THE AMERICAS, 1968
Active case detection Passive case detection Total
Bloods slides Average
~~~Average
ntfcto.sie Average of Blood slides Average of e Blood slidesCountry or other Average notification slides per
political unit er p number of post month per
number of Exami- per notification producing Exami- Positive Per cent productive
Exami-nedper month posts slides ned notification ned
numb__ _er__ of_
per
month postevalu ators Positive Per cemnth
Argentina ... 132 215466 265 0.12 136.0 998 230 25 393 314 1.24 9.2 240859 579
Bolivia ... 85 147 411 1084 0.74 144. 5 2 603 510 40 224 914 2.27 6. 6 187 635 1998
Brazil (Excl. Sao Paulo) 1 691 1390907 25776 1.85 68.5 15 845 6 882 502 231 54 536 10.86 6.1 1893138 80312
Brazil (Sao Paulo)... 138 146 000 249 0.17 88.2 5 024 770 42 541 763 1.79 4. 6 188 541 1012
Colombia ... 639 550 930 14634 2. 66 71. 8 9109 4 621 307 927 12 699 4. 12 5. 6 858857 27 333
Costa Rica ... 80 127 523 458 0. 36 132. 8 979 274 14 506 733 5. 05 4. 4 142 029 1 191
Cuba ... ... 234129 - - ... ... ... 599978 4 0. 0 ... 834107 4
Dominican Republic... 141 378712 11 0. 0 223.8 4 834 2n931 276490 10 0.0 7.9 655E202 21
Ecuador ... 112 59964 976 1.63 44.6 5552 3050 290219 36067 12.43 7.9 350183 37043
El Salvador ... 95 495 239 6467 1. 31 434.4 2 444 2 001 310072 29 364 9.47 12. 9 805311 35831 Guatemala ... 87 281729 5222 1. 85 270.0 3310 2091 211211 5185 2.45 8. 4 492940 10407
Guyana ... ... 49764 50 0.10 ... ... 32 5453 11 0.20 14. 2 55217 61
Haiti ... 330 948 693 1875 0.20 2 396 7 291 2878 225212 687 0. 31 6. 5 1173 905 2562 Honduras ... 119 326 302 5132 1.57 228.5 2 764 1749 258 394 10533 4.08 12. 3 584696 15666
Jamaica ... ... 20 630 - - ... ... ... 78951 2 0. 0 ... 99581 2
Mexico ... 1 134 2082577 15710 0.75 153.0 42 948 5 018 324 260 10 330 3. 19 5. 4 2406837 26040 Nicaragua ... 144 268373 3 308 1.23 155.3 2 996 1247 143171 4 942 3.45 9. 6 411544 8250 Panama ... 24 57 627 786 1.36 200.1 1861 152 25 584 839 3.28 14. 0 83211 1625 Paraguay ... 17 3 670 240 6.54 18. 0 2 632 881 110100 20503 18.62 10. 4 113770 20743
Peru ... 140 136700 1186 0.87 81. 4 6584 1524 110416 824 0. 75 6. 0 247116 2010
United States a) - - - ... 1 4 9 4b 2610
)
... ... 1494 2610Unit~~~~~~~~ed psttes
Trinidad andTobago.... 75 16 316 4 0.02 18. 1 82 82 49441 1 0. 0 50.2 65 757 5
Venezuela ... 422 339804 4 095 1.21 67.1 2915 580 187649 1 640 0.87 26.9 527453 5735
British Honduras... 8 6140 13 0. 1 64.0 127 72 6131 26 0.42 7. 1 12 271 38
Dominica ... 3 3908 - - 108.6 26 7 1289 - - 15. 3 5197
-FrenchGuiana... 6409 8 0.12 ... 18 7 723 42 5.381 8. 6 7132 50
Grenada ... 1 218 - - 18. 2 - - - 1- 218
-Guadeloupe ... ... 13 968 - - ... ... ... 50 - - 14018
-Panama Canal Zone .... ... 1809 - - ... ... ... 20558 89 0.43 ... 3 22 367 89
St. Lucia ... ... 6771 - - ... I .- - - - 6771
-Surinam ... 28 22131 283 1. 28 65. 9 70 21 13208 1272 9.63 52.4 35339 1555
Total ... 5 645 8 339 820 87832 1. 05 123. 1 121012 37 610 4182 876 194 940 4. 66 9. 3 12 522 696 282 772 ... No information.
a) Including Puerto Rico. 10 0
aqCD t
.I-v,~~
CD19/2 (Eng.) Page 22
Table 15
NATIONAL EXPENDITURES 1967-1968 AND BUDGET 1969 FOR MALARIA ERADICATION IN THE AMERICAS
(In thousands of U. S. dollars)
National Expenditures 1968 National Budget, 1969
National
expenditures Internal Loans Internal Loans
1967 financing AID financing AID
Argentina ... ... 860 921 - 921 923 923
Bolivia ... 323 323 - 323 308 - 308
Brazil ... 13584a) 16 330 1945 18 275 17 129 1785 18 914
Colombia ... 2 854 3114 - 3114 3 090 - 3 090
Costa Rica ... 520b) 466 255 721 491 299 790
Cuba ... 1980 1 128 - 1128 ...
Dominican Republic .. 771 782 - 782 782 - 782
Ecuador .. ... 640 4 49c) 403 852 853 550 1403
E1l Salvador ... 96 4d) 600 803 1403 868 1 0 6 5e) 2 366 )
Guatemala ... 14 83g) 1148 509 1657 977 675h) 1 652
Guyana ... 57 75 - 75 75 - 75
Haiti ... 35 35 1 587i ) 1622 35 1350 1385
Honduras ... 1 238j ) 413 836 1249 750 520 1270
Jamaica ... 8 24k) 744 - 744 825 - 825
Mexico ... 6508 6 508 - 6508 6508 - 6 508
Nicaragua ... 8701) 657 1151 1808 1057 1402 2 459
Panama ... 700 722 - 722 743 591 1 334
Paraguay ... 345 422 70 492 429 603 1032
Peru ... 811 833 - 833 (m) (m) (m)
Trinidad and Tobago.. 409 417 - 417 433 - 433
Venezuela ... 5456 5 245 - 5245 5 245 - 5 245
British Honduras ... 88 102 - 102 86 - 86
French Guiana ... 195 195 - 195 268 - 268
Panama Canal Zone .. 50 50 - 50 50 - 50
Surinam ... 294 275 - 275 294 - 294
Total ... 41859 41954 7 559 49 513 42 219 8 840 51492
- None. ... No information available.
a) Includes $981250 from AID Loan. b) Includes $198 764 from AID Loan. c) Up to November 30, 1968. d) Includes
$363 920 from AID Loan. e) $35 000 from AID Loan approved, $1 030 000 in negotiation. f) Includes a carry-over of
$432 920 from the approved loan for the years 1967 and 1968. g) Includes $653821 from AID Loan. h) $386738 from
AID Loan approved and $288 800 in negotiation. i) AID grant. j) Includes $902 365 from AID Loan. k) Includes
CD19/2 (Eng.) Page 23 Table 16
ESTIMATED REQUIREMENTS FOR MALARIA ERADICATION IN THE AMERICAS a) SUMMARY
1 9 6 8b) 1 9 6 9c) 1 9 7 0c) 1 9 7 1c)
TOTAL COST ... 45851040 50 013 902 66 937 027 64 418 536
GOV. AND OTHER SOURCES 43 057 000 46 789 500 63 725 200 61 327 800
PAHO/WHO PORTION:
Personnel costs and travel 2 399 588 2 484 655 2 533 598 2 468 536
Supplies and equipment.... 305 513 612 533 579 200 525 200
Fellowships ... 15 858 47 400 43 000 41 600
Grants and others ... 73081 79814 56029 55400
SUB-TOTAL PAHO/WHO ... 2 794 040 3 224 402 3 211 827 3 090 736
SOURCES OF PAHO/WHO FUNDING
Source 1 9 6 8b) 1 9 6 9c) 1970c) 1971c)
PAHO-Reg. ... 281 057 679 544 880 772 1 080 581
PAHO-SMF ... 1 372 407 1 799 785 1 556 004 1 236147
WHO-Reg ... 684 705 493 300 500 000 500 000
WHO-MESA... 395 869 205 573 205 751 204 708
WHO-TA ... 60 002 46200 69300 69 300
TOTAL ... 2 794 040 3 224 402 3 211827 3 090 736
PAHO/WHO PERSONNEL Category
971 19701969
196
a) Figures shown include all malaria eradication country projects, AMRO projects, supporting personnel in Zone offices and Malaria Eradication Department, they do not include activities in countries or territories entirely in maintenance phase, nor those of Venezuela.
b) Expenditures. c) Estimated requirements.
Medical Officer ... 40 39 38 37
Sanitary Engineer ... 15 12 12 10
Entomologist ... 12 9 6 5
Parasitologist ... 2 2 2 2
Malariologist ... 1
Epidemiologist ... 3 2 2 1
Economist ... - 1 1 1
Statistician ... 1 1 1 1
Programmer Analyst ... 1 1 2 2
Adm. Methods Officer .... 7 4 4 4
Assistant Engineer ... 1 1 1 1
Assistant Entomologist ... 2
Health Educator ... 2
Laboratory Adviser ... 2 1 1 1
Sanitary Inspector ... 59 41 36 34
Other ... 14 15 15 15
TOTAL ... 162 129 121 114
_.
I
1968 1969
CD19/2 (Eng.) Page 24
ARGENTINA
STATUS OF MALARIA PROGRAM AT DECEMBER 1968
Population Area km2 (thousands)
TOTAL COUNTRY 23040
Non malarious areas 20097
Originally malarious areas
Maintenance phase 1 631
Consolidation phase
Attack phase
4 024 458
3 675 407
111 661
423 79 624
889 157 766
Preparatory phase
Total originally malarious areas 2 943 349051
PERSONNEL
Activity
Spraying operations
Evaluation operations
Administrative and other
Transport
Total
TRANSPORT FACILITIES
Type Spraying Evaluation Mixed or other Total
Operations Operations operations
Four-wheel vehicles 53 67 61 181
Two-wheel vehicles - 64 2 66
Boats 2 - - 2
Animals -
-Other - -
-Total 55 131 63 249 (Part-time personnel in parentheses)
1==
Iiiiiiii
snI
[TV11
-ARGENTINA (Cont.)
SPRAYING OPERATIONS
Houses sprayed Inhabitants directly protected Insecticide used Average houses
Yetotal Date Cycle per house sprayed per
totalge DDT (g. technical)
spray-Planned Sprayed Planned Protected DDT man/day
1st 81 619 5 799 5a 288 768 205189 263
1st Aug. 59-Jun. 60 2nd 92438 8 8 0 7 9a) 347 012 330 733 255 . .
3rd 84 011 84 929a) 323 610 327 209 305
2nd Jul. 60-Jul. 61 4th 84 077 76 991a) 308142 282178 334 ...
5th 81 906 75 734) 303 290 280 425 383
3rd Aug. 61-Jun. 62 6th 96 249 73 027 341780 259 379 349 . . '
7th 97 908 63 967 351098 229 432 353
8th 95 552 54 742a ) 318 288 182 273 329 .
9th 90 333 46 627 317 972 164 420 320
10th 43572 39430 135574 122685 324
11th 50 322 44 972 172 313 153 995 302 ...
12th 43 927 30 236 138 809 95 417 302 15. 7
13th 90 224 48 428 327 495 175 788 416 21. 1
14th 66853 60220 217 492 195 913 366 19. 2
15th 65 304 57 484 227149 199949 403 12.0
16th 65 340 58707 228 690 205 885 462 20. 8
17th 72836 83 306 ... 292874 473 21.5
9th Jul. 67-Jun. 68 18th 82 490 83866 412 000 290444 481 23.0
10th Jul. 68-Dec. 68 19th 55730 54 382 278000 194479 454 23.3
a) Some houses were sprayed once a year.
3 4 5 6 7 8 9 10 11 12 3 14 5 16 17 18 19
1960 1 1961 1 1962 I 1963 1 1964 1 1965 | 1966 1 1967 1 1968
[| ]
X |Inhabitants to be directly protected|\\\\\\\\ | Inhabitants directly protected s
--- - --Houses to be sprayed
Houses sprayed
2o
0 z 0t
Cycle Year Year
ozu Z o
240 i
180 i
120
O-0o~
pa 0
aq }-tD CD
~be
01 "09
of qARGENTINA(Cont. )
EPIDEMIOLOGICAL EVALUATION OPERATIONS, ATTACK PHASE AREAS
Slides examined Species found
Year Positive
Total P. - P. vivax P. malariae
Number
IPercentage
parum1959a ) 12 377 1043 8.4 - 1043
-1960 82 191 2 013 2.4 7 2 006
-1961 93 464 4 524 4.8 4 4 520
-1962 112 477 4 685 4.2 4 685
-1963 96 668 834 0.9 - 834
-1964 102 683 543 0.5 - 543
-1965 57872 213 0.4 - 211 2
1966 89 065 300 0.3 - 300
-1967 111917 1512 1.4 - 1511 1
1968 61 601 418 0.7 - 418
-CONSOLIDATION PHASE AREAS
Date Origin of infections Species of parasite
Estimated No. of %of Total Imported
6 in the area population slides POPU- lation No. of Au-- Relaps- ffrom Intro- Unclassi P. falci- P.vivax malar
(tinua rond sitive tochtho- fo · Induced
M
&
(thousands)sampled
ing from areas duced fied paruiae
(annual cases nous abroad within
rate) country
1959b) (a) 911 9491 2.5 51 - - - 32 - 19 - 51
1960 )1-4 929 14 438 1. 5 26 - - - 14 - 12 -_ 26
1961 b)1-4 1278 44 395 3.5 17 - 2 - 5 - 10 - 17
1962b)1-4 1542 394675 2. 6 23 - 17 20 3
1963 1l-4 1 584 60 742 3.8 11 2 - - 6 2 - 1 - 9 2
1964 1- 2b 1648 41926 5. 1 10 1 - 7 - 1 2 10
-1 3-4 627 24415 7.8 1 1 - - -
-1965 1-4 449 92 658 20. 6 41 20 - 1 8 3 7 2 - 38 3
1966 1-4 454 71346 56 2 1 1 26 1 - - - 51
-19671-4 387 82208 21.2 53 41 1 5 1 - 5 1 52
1st 14813 14. 0 15 10 - 1 2 2 - 1
2nd 20 997 20. 0 26 13 6 3 | - 4 26
1968 3rd 423 19 368 18.2 4 3 - - 1 4
-4th 20122 19. 2 81 751 1 1 - 4 181
a) Augut-December. b) Including maintenance phase area. c) Includes one cryptic cae. -a) August-December. b) Including maintenance phase area. c) Includes one cryptic case.
so
09 r