dregional cornmmittee
PAN AMERICAN
HEALTH
ORGANIZATION
XV Meeting
WORLD
HEALTH
ORGANIZATION
XVI Meeting
Mexico, D. F.
August-September 1964
Provisional Agenda Item 20
CD15/5 (Eng.)
10 July 1964
ORIGINAL: ENGLISH-SPANISH
REPORT ON THE STATUS OF MALARIA ERADICATION IN THE AMERICAS
AND. ESTIMATED REQUIREMENTS FOR THE SPECIAL MALARIA FUND OF
THE PAN AMERICAN HEALTH ORGANIZATION
A. REPORT ON THE STATUS OF MALARIA ERADICATION
IN THE AMERICAS
TABLE OF CONTENTS
Page
Introduction ... 1
I. Status of the Malaria Eradication Program ... 1
A. General Picture ... 1
B. Current Extent of the Problem ... 5
C. Field Operations ... 9
II. Special Technical Problems ... 101
A. General ... 101
B. Physiological Resistance of Anophelines to Insecticides .... 101
C. Irritability ... 101
D. Sorption of Insecticides ... 101
E. Construction of New Houses Between Cycles ... 102
F. Migration ... 102
G. Chloroquine-resistant Plasmodium falciparum . . . ... 102
H. Solutions to Problems of Continuing Transmission ... 102
a) Change to an alternate insecticide ... 102
b) Rescheduling or increasing cycles of DDT ... 103
c) Antilarval measures ... 103
d) Mass Drug Treatment ... 104
e) Chloroquinized salt program ... 105
III. Research on Malaria ... 106
A. Malaria Eradication Epidemiology Team - AMRO-0210... 106
B. Insecticide Testing Team - AMRO-0209 ... 107
C. Resistance of Malaria Plasmodia Strains to Drugs - AMRO-0212 109 D. Pilot Project with DDVP ... 110
E. Antibromeliad Spraying with Calcium Arsenite ... 110
F. Field Tests of Pressure Regulator Disc for Spray Pumps . . . 110
IV. International Cooperation ... 110
ii
MAPS AND TABLES
Maps: Page
1 Status of the Malaria Eradication Program in the Americas,
31 December 1962 . ... , ... ... 2 2 2 Status of the Malaria Eradication Program in the Americas,
31 December 1963 ... ... 3... 3 Tables:
1 Comparison of 1962 and 196:3 Population and Area in various phases of the Malaria Eradication Programs in the Americas, and Percentages
of Change by phase ... . ... 4... 4
2 Progress in Malaria Eradication Programs in the Americas ... 5 3 Status of Malaria Eradication in the Americas, by Population, 1963 ... 6 4 Status of Malaria Eradication in the Americas, by Area, 1963 ... 7 5 Percentage Distribution of Population and Area in the Americas, 1963
By Status of Malaria Eradication ...
6 Personnel Employed in Malaria Eradication Programs in the Americas
31 December 1962 and 1963 by Category ... 10 7 Personnel Employed in Spraying Operations in Malaria Eradication
Programs in the Americas - 31 December 1963 ... 11 8 Personnel Employed in Epidemiological Evaluation in Malaria
Eradication Programs in the Americas - 31 December 1963 ... 12 9 Personnel Employed in Administrative Services and Others in Malaria
Eradication Programs in the Americas - 31 December 1963 ... 13 10 Personnel Employed in Transport Services in Malaria Eradication
Programs in the Americas - 31 December 1963 ... 14 11 Means of Transport in Malaria Eradication Programs in the Americas
- 1963 ... 16
12 National Budgets for Malaria Eradication in the Americas, 1962-1964 . 17 13 Comparative Results of Active and Passive Case Detection in Malaria
Eradication Programs in the Americas, 1963 ... 18 14 Summary of Case Detection in the Americas, 1958-1963 ... 19
Status of Malaria Program at December 1963 Country Tables:
iii
MAPS AND TABLES (Cont.)
Country Table: Page
Brazil (excl. Sao Paulo) ... 26
Brazil (Sao Paulo) ... ... 29
Colombia... 32
Costa Rica ... .. ... ... .. 35
Cuba ... 38
Dominican Republic ... ... 41
Ecuador ... 44
E1 Salvador ... 47
Guatemala ... ... 50
Haiti ... 53
Honduras ... 56
Jamaica ... 59
Mexico ... 61
Nicaragua ... ... 64
Panama ... ... 67
Paraguay ... 70
Peru ... 73
Trinidad and Tobago ... 76
Venezuela ... 78
British Guiana ... 81
British Honduras ... 84
Dominica ... 86
French Guiana ... ... 88
Grenada and Carriacou ... 90
Guadeloupe ... ... 92
Panama Canal Zone ... ... 94
St. Lucia ... 96
iv
MAPS AND TABLES (Cont.)
Tables: Page
15 PAHQ/WHO Full-time Professional and Technical Staff assigned to country, Inter-Country and Inter-Zone Malaria Eradication Projects
in the Americas, 1961. to May 1964 ... 111 16 Personnel Trained in Malaria Eradication Techniques at International
Centers, 1949-1963 and First Semester of 1964 ... 112 17 Fellowships for Study Travel in Malaria Eradication, 1962 and 1963. 113 18 Equipment and Supplies, Excluding drugs, contributed by PAHO to
Malaria Eradication Programs in the Americas, 1958 to December 1963 114 19 Drugs Provided for Malaria Eradication Programs in the Americas
by PAHO, 1958-1963 .115
20 International Contributions to Malaria Eradication Programs in
CD15/5 (Eng.) Page 1
REPORT OF THE STATUS OF MALARIA ERADICATION IN THE AMERICAS
XII REPORT
Introduction
The Director of the Pan American Sanitary Bureau has the honor to present to the XV Meeting of the Directing Council the XII Report on the status of malaria eradication in the Americas.
The report consists of four chapters. The first chapter contains information on the status of the program in general and also country-by-country summaries of progress, depicting the history and present condition of each program in tables and graphs. The second chapter discusses special technical problems which have arisen; the third, field research projects in progress; and the last, international cooperation in the malaria eradication program.
The data presented are from the answers of each country to a detailed annual question-naire and from monthly and quarterly statistical reports submitted to the Pan American Sanitary Bureau by most of the programs. Special technical reports concerning research projects are also presented by the countries when appropriate.
I. STATUS OF THE MALARIA ERADICATION PROGRAM A. General Picture
The progressive movement of areas from attack phase into consolidation and from con-solidation to the goal of completed eradication (maintenance phase) continued satisfactorily during 1963. The situation at the end of 1963 can be readily compared with that at the end of 1962 by in-spection of Maps 1 and 2 and the summary presented in Table 1.
The territory in which eradication is claimed was augmented during 1963 by the addition of new areas in Venezuela, of the last remaining part of the originally malarious area of Guadeloupe, and of the first areas to be placed in maintenance phase in Peru.
Eight million people living in some seven hundred thousand square kilometers of origi-nally malarious territory passed during 1963 from the attack phase into the consolidation phase, an increase of 30.8 per cent in the number of inhabitants of consolidation phase areas.
The population in attack areas has decreased as a result of this progress into consoli-dation phase.
CD15/5 (Eng.) Page 2
ISLANDS
S, TURKS
RMUDA
BRITISH VIRGIN ISLANDS
MEXICO
,CANAL ZONE
VENEZUELA
A.
ECUADOI
BRAZIL
BOLIVIA-"
AREAS IN WHICH MALARIA HAS CHI DISAPPEARED OR NEVER EXISTED
AREAS WHERE MALARIA HAS BEEN ERADICATED
AREAS IN THE CONSOLIDATION PHASE
AREAS WHERE THE CONSOLIDATION PHASE HAS NOT BEEN REACHED AND WHERE MALARIA EXISTS
\- PARAGUAY
IL
ARGENTINA
STATUS OF THE MALARIA ERADICATION PROGRAM IN THE AMERICAS, 31 DECEMBER 1962.
so
MAP
I.
I d (
CD15/5 (Eng.) Page 3
BAHAMA ISLANDS
)
CAICOS, TURKSD
BERMUDAX BRITISH VIRGIN ISLANDS
IEZUELA
ANGUILLA
D ST. KITTS, NEVIS
D ANTIGUA
Q' BARBUDA
' GUADELOUPE
/ DOMINICA MARTINIQUE
/
-
ST. LUCIAO
EST. VINCENT-@ BARBADOS
---- G GRENADA
-UIANA TRINIDAD,
SURINAM TOBAGO
GUIANA
IR.G
'AO PAULO STATE
N
PARAGUAYURUGUAY
AREAS IN WHICH MALARIA HAS
DISAPPEARED OR NEVER EXISTED ARGENTINA
AREAS WHERE MALARIA HAS BEEN ERADICATED
AREAS IN THE CONSOLIDATION PHASE
MAP 2.
AREAS WHERE THE CONSOLIDATION PHASE HAS NOT BEEN REACHED AND WHERE MALARIA EXISTS
STATUS OF THE MALARIA ERADICATION PROGRAM IN THE AMERICAS, 31 DECEMBER 1963.
UNITED STATESEL SAL IRITISH
HONDURAS
=, T
CD15/5 (Eng.) Page 4
Table 1
COMPARISON OF 1962 AND 1963 POPULATION AND AREA IN VARIOUS PHASES OF THE MALARIA ERADICATION PROGRAMS IN THE AMERICAS,
AND PERCENTAGES OF CHANGE BY PHASE 1/
Phase 1962 1963
1
Percentagechange
A. Population in thousands:
1. Malaria eradication claimed or registered 55 397 56 546 + 2.1 2. Consolidation phase ... 25 914 33 901 + 30.8 3. Attack phase ... 49 276 31910 - 35.2 4. Preparatory phase or not yet started .... 23 155 29 664 + 28.1 B. Area in km2
1. Malaria eradication claimed or registered 2810968 2 874 214 + 2.2 2. Consolidation phase ... 1712179 2411815 + 40.9 3. Attack phase ... ... 5 728 032 3 378 932 - 41.0 4. Preparatory phase or not yet started .... 6 087 581 7 663 009 + 25.9
Administrative problems are still among the most serious facing malaria eradication programs in the Hemisphere. In some cases these are primarily matters of increased efficiency of administration required within campaigns; a number of such cases have already found solution or are on the road to it, as in the Dominican Republic, where a thorough administrative reorgani-zation has been carried out with PASB technical assistance and the campaign is now headed by co-directors, one national and one appointede by PASB; in Colombia where administrative revision is in process and Brazil, already mentioned.
The areas in which the primary problem is insufficient funds are still numerous. Fore-most among these are many countries facing technical problems (see below), but others also find themselves unable to prosecute operations to the extent required by the technical circumstances of the program. In Paraguay, where the previous program has been paralyzed since late 1960, attack has still not been begun and is now planned, under a new campaign, to start in 1965. Argentina has not as yet been able to begin attack in the provinces of Chaco and Formosa. The situation in Panama has not improved, the budget for the program being inadequate and provision of funds budgeted being often delayed. Bolivia experienced several serious outbreaks in consolidation areas in early 1964 following sharp curtailment of surveillance operations and reductions in spraying personnel in late 1963 and early 1964, consequent upon reduction by a third of the annual budget (provided by AID) and a cut-off of funds as of the end of February due to delay on the part of the Government in agreeing to increase its share of the malaria program budget for 1964. A new bi-lateral agreement is under negotiation. In Peru activities were deeply cut at the end of 1963 for lack of funds. A minor set-back occurred in Costa Rica in mid-1963, partly because of delay in the provision of funds. In Honduras the program was essentially paralized in the latter part of 1963 due to the cutting-off of AID support. Temporary reduced financing has been provided by AID for the first quarter of 1964 and a new tripartite agreement is under negotiation.
No important additional areas were found during 1963 to have technical problems, but the problem areas already delimited at the beginning of the year still present obstacles to eradication
in a number of countries, in particular some Central American countries and Mexico. Both field trials and basic research were carried out and supported by PAHO during 1963 in pursuit of better
solutions of these problems. (Details in Chapters II and III).
CD15/5 (Eng.) Page 5
A step forward in the coordination of malaria eradication efforts in the countries of Cen-tral America and Panama was made on 6 July 1963 when the Ministers of Health of these countries signed an agreement "ad referendum" for the Organization of a Regional Campaign for Eradication of Malaria in the Isthmus of Central America. PAHO submitted the agreement, based upon recom-mendations of the XVI Panamerican Health Conference and the XIV Meeting of the World Health Organization Regional Committee for the Americas; it calls for unification of the technical and eco-nomic resources devoted to malaria eradication by the Member Governments with those provided by the international and bilateral agencies under the aegis of this Office. The Service, to be known as SEMICA (Servicio de Erradicaci6n de la Malaria del Istmo Centroamericano), will hold evalu-ative and executive responsibility under basic regulations which have already been submitted to the Member Governments for their comments.
B. Current Extent of the Problem
In Tables 1 and 2 can be seen the gradual shifting of malarious areas in the Hemisphere from the attack into the consolidation phase and thence to the maintenance phase with eradication claimed or certified. Details by country are presented in Tables 3 and 4 and an over-all percentage distribution by phase in Table 5. Nearly 50 million people live in areas from which it is claimed that malaria was eradicated before the initiation of the Hemisphere-wide campaign. Apart from these areas, the active eradication campaigns in the Americas are mostly in the age-group which should be entering or passing through consolidation; relatively few have hadtime to complete attack and the required consolidation period. Latest information shows 30 million or 20 per cent in pre-paratory phase (a figure greatly inflated by the temporary redefinition of large areas of Brazil), 32 million (21 per cent) in attack (this also strongly affected by the withdrawal from attack of areas including some 10 million persons in Brazil), 34 million (22 per cent) in areas under the regime of consolidation and nearly 57 million (37 per cent) in areas where eradication is claimed.
Table 2
Population in thousands!/
Malaria Annual % of increase
Year eradication Consolidation Malaria Consolidation
claimed or phase eradication phase
achieved claimed
1960 50 741 1991
-1961 53 357 13879 5.2 597.1
1962 55 397 25 914 3.8 86.7
1963 56546 33901 2.1 30.8
As consolidation areas include more and more people from year to year, with new areas entering the phase but few as yet passing out of it into the maintenance phase, the per cent increase from year to year naturally falls. The reservoir of attack areas diminishes and the areas in which interruptionof transmission is difficult-whether because of technicalproblems or for reasons of difficult access, recalcitrant population, shortage of funds, etc.- form a proportionately larger part of it.
Areas were shifted from attack to consolidation phase in 11 countries, in eight of which considerable areas and populations were affected. Colombia made the greatest contribution to the increase in population in areas in the consolidation phase, adding over two million persons to those already in this phase. Peru and Mexico each had new areas with over a million inhabitants attain-ing consolidation status. Honduras now has about half the population and three-quarters of the area of its originally malarious territory in this phase. In 1963 for the first time Ecuador placed areas in the consolidation phase, including over nine hundred thousand inhabitants, Bolivia more than doubled the number in her consolidation areas and Argentina, Costa Rica and Nicaragua also com-pleted the attack phase and began consolidation in new areas.
CD15/5 (Eng.)
Page 6 Table 3
STATUS OF MALARIA ERADICATION IN THE AMERICAS, BY POPULATION, 1963 (Population in thousands)
Population of originally malarious areas
Country or other Total Malaria Prep. phase
political unit population eradication Consolidation Attack or program
Total claimed
(macaienc phase phase not yet
(maintenance started
phase)
Argentina ... 21100 2 692 1004 580b 359 749
Bolivia ... 3 609 1 307 - 1 179 128
Brazil . ... 77 074 34 916 _ 1256 6 550 27 110c
Canada ... 18 600
-Chile ... 8 050 129 129 -
-Colombia ... .. 15181 9 564 - 5 305 4 009 250
Costa Rica ... 1 338 426 - 262 164 Cuba ... 7 134 1921 - - 1921 Dominican Republic ... 3 348 2 740 - - 2 740 Ecuador ... 4 696 2 550 - 927 1623 El Salvador ... 2 511 1641 - - 1 641 Guatemala ... 4120 1912 - 1234 678 Haiti ... 4439 3449 - - 3 449 Honduras ... 2 008 1892 - 941 951 Jamaica .. ... . 1685 1309 - 1309
Mexico . ... 38 313 20901 - 16830 4 071 Nicaragua . ... 1767 1697 - 668 1 029 d
Panama ... 1164 1121 1- 1121
Paraguay . ... 1864 1551 - - - 1551
Peru ... 11073 3 287 43 2199 1045 Trinidad and Tobago ... 828 828 - 828
-United States ... 188 800 45 800 45 800 -Uruguay ... 2 846
-Venezuela ... 8 093 6048 5 656e 102 290
Antigua ... 62 - -
-Bahamas ... ... 111
-Barbados ... 232 228 228
-Bermuda ... 47 - -
-British Guiana ... 613 613 572 - 41 British Honduras ... 100 100 - 100
-Dominica ... 60 14 _ 14
Falkland Islands ... 2 -
-French Guiana ... 34 34 - - 30 4
Grenada and Carriacou .. 91 37 37f - -
-Guadeloupe ... 290 260 260 - -
-Martinique ... 292 185 185 - -
-Montserrat ... .... 13 ....
Netherlands Antilles .... 200 -
-Panama Canal Zone .... , 47 47 - 46 1
-Puerto Rico ... 2 513 2 513 2 513 - - -St. Kitts-Nevis-Anguilla . 59 - -
-St. Lucia ... 97 82 82f - -
-St. Pierre-Miquelon .... 5 -
-St. Vincent ... 82 -
-Surinam ... 315 190 - 121 69
-Virgin Islands (U. K. ) . 7 -
-Virgin Islands (U S. ) g . . 37 37 37 -
-Total ... 434 950 152 021 56 546 33 901 31910 29 664
- None
(a) Latest available official figures. (b) An area with 206 000 inhabitants in which no antimalaria work was done and no positive cases occurred, is included. (c) Part of this population is partially protected by insecticide
CD15/5 (Eng.) Page 7 Table 4
STATUS OF MALARIA ERADICATION IN THE AMERICAS, BY AREA, 1963 (Area in Km2)
Originally malarious area
Country or other Total Malaria Iolitical Init Prep. phase_
political unit area political eradicationunit cai area Consolidation Attack or program
(macaienc phase phase not yet
(maintenance started
phase)
Argentina ... 4 024 458 349 051 40 100 59 33 6a 93 549 156 066
Bolivia ... 1 098 581 824 260 - 619 540 204 720
-Brazil . ... 8 513 861 7 566 774 - 145 829 360 592 7 060 353b
Canada . ... 9 974 375
-Chile ... 741767 55 287 55 287 -
-Colombia . ... 1 138 338 1026433 - 122 920 863 513 40 000
Costa Rica . ... 51011 31 526 - 23 523 8 003 Cuba . ... 114 524 37 376 - - 37 376 Dominican Republic ... 48 442 39 000 - - 39 000
Ecuador ... 291906 175 462 - 6 394 169 068
El Salvador ... 21149 19 940 - - 19 940
Guatemala ... . 108 889 80 350 - 49 345 31005
Haiti ... ... 27 750 19 100 - - 19100
Honduras . ... ... 112 088 107 035 - 78 703 28 332
Jamaica ... 11428 10 028 - 10 028
-Mexico ... ... 1969 367 1 147 564 - 858 378 289186
Nicaragua . ... ... 139 000 132 385 - 108 527 23 858
Panama ... 74 470 68 497 - - 68 497
Paraguay . ... 406 752 406 590 - - - 406 590
Peru . ... 1381800 943 200 31000 268 200 644 000
Trinidad and Tobago .... 5 605 5 605 - 5 605
-United States ... 9 339 900 2 255 890 2 255 890 -
-Uruguay ... 186 926 - -
-Venezuela . ... 912 050 600 000 4 69 5 52 c 26857 103 591
Antigua ... 280 -
-Bahamas ... 1 1396
Barbados ... 431 430 430
-Bermuda ... 53 - -
-British Guiana ... 215 800 215 800 10 600 - 205 200
British Honduras ... 22 696 22 696 - 22 696
-Dominica ... 790 152 - 152
Falkland Islands ... 11961 - -
-French Guiana ... 86 000 3 2 0 0 0d - _ 32 000 Grenada and Carriacou.. 344 171 1 7 1e _ Guadeloupe ... 1779 1136 1136
-Martinique ... 1102 300 300 -
-Montserrat ... 84 - -
-Netherlands Antilles .... 961 -
-Panama Canal Zone ... 1432 1432 - 1432f (f )
Puerto Rico ... 8896 8 896 8896 -
-St. Kitts-Nevis-Anguila.. 396 -
-St. Lucia ... 603 510 510 -
-St. Pierre-Miquelon .... 240 -
-St. Vincent ... 389 -
-Surinam ... 142822 142 752 - 4 350 138 402
Virgin Islands (U.K.) .... 174 - - -
-Virgin Islands (U. S) ... 342 342g 342g
-Total ... 41203 408 16327970 2 874 214 2411815 3 378 932 7 663 009 - None
CD15/5 (Eng.) Page 8
Table 5
PERCENTAGE DISTRIBUTION OF POPULATION AND AREA IN THE AMERICAS, 1963 BY STATUS OF MALARIA ERADICATION
Percentage distribution Status
Population Area
Total ... ... 100.0 100.0
Non malarious areas ... 65.1 60.4
Originally malarious areas ... 34.9 39.6
Preparatory phase ... 6.8 18.6
Attack phase ... 7.3 8.2
Consolidation phase ... 7.8 5.8
Maintenance phase ... 13.0 7.0
In some countries, areas were returned to attack, for example in Mexico and Nicaragua, as adjustments were made to borders between problem and consolidation areas, but these movements are not apparent in the country totals since larger areas were concurrently shifted from attack to consolidation phase.
In addition to the three countries which claimed eradication in new territories -Peru, Venezuela and Guadeloupe- the entire originally malarious areas of Grenada and Carriacou and St. Lucia were registered by PAHO as having achieved eradication at the end of 1962. The Virgin Islands (U. S. ) for the first time,have officially given information indicating the eradication of mala-ria. Previously these have been reported as being non-malarious.
As mentioned above, areas with technical problems are still confronted with serious diffi-culties despite encouraging results obtained. with many of the attack measures tried.
A catalogue of problem areas is being developed, and will be presented next year. This will include the data as to population and areas where technical problems exist.
Some of the problems of Nicaragua have been attacked during 1963 by mass drug programs, spraying with malathion, and larviciding techniques,all giving good results when applied in appropri-ate situations. The remainder of the area with vectors resistant to insecticide is in recess from DDT spraying, and no attack measures were carried out there. Financing for the extension of the methods tested to more areas is the "sine qua non" of timely eradication. In its absence outbreaks occurred in consolidation areas, where insecticide residues left from previous years' attack measures are diminishing and cases imported from problem areas continually seed new trans-mission.
CD15/5 (Eng.) Page 9
The problem areas of E1l Salvador have been attacked using mass drug treatment, with excellent results. Only one-fourth of the problem area has been included in the drug program how-ever, and money is still lacking for extending this measure, and others which have been investi-gated, to the remaining areas.
Problem areas in Mexico have experienced no substantial improvement and new methods of attack are being sought. The experimental mass drug program initiated in 1962 with PAHO fi-nancing gave promising results, but the gains made were not held since funds were lacking to carry on the treatment and reinfection from surrounding areas took place. In a considerable number of localities special entomological studies have been carried out throughout the problem areas in an effort to find new solutions. Gains have been made in Mexico in non-problem areas.
Technical problems have also handicapped the campaign in another quarter of the Hemi-sphere, where a chloroquine-resistant strain of P. falciparum in a district in the interior of British Guiana has reduced the effectiveness of the medicated-salt program in operation in the interior of the country. House spraying has been instituted and appears effective. About 100 cases of actinic dermatitis resulting from chloroquinated salt have been discovered but these are self-limiting and have not required a change in the salt-medication program.
It has become clear that technical problems in the Hemisphere fall into a limited number of major categories, even though minor variations are infinite. In each area careful selection from among available antimalaria methods of the appropriate measure or combination of measures, and their application with a high degree of skill and attention are required for the solution of existing problems. In addition, operational research is necessary on many subjects including goodalterna-tive insecticides, optimal procedures for basic residual spraying, evaluation of case detection operations, entomological techniques and longer-lasting antimalaria drugs. Research programs are in progress in some of these fields, as well as numerous supervised field trials (See Chapters
U and III).
C. Field Operations
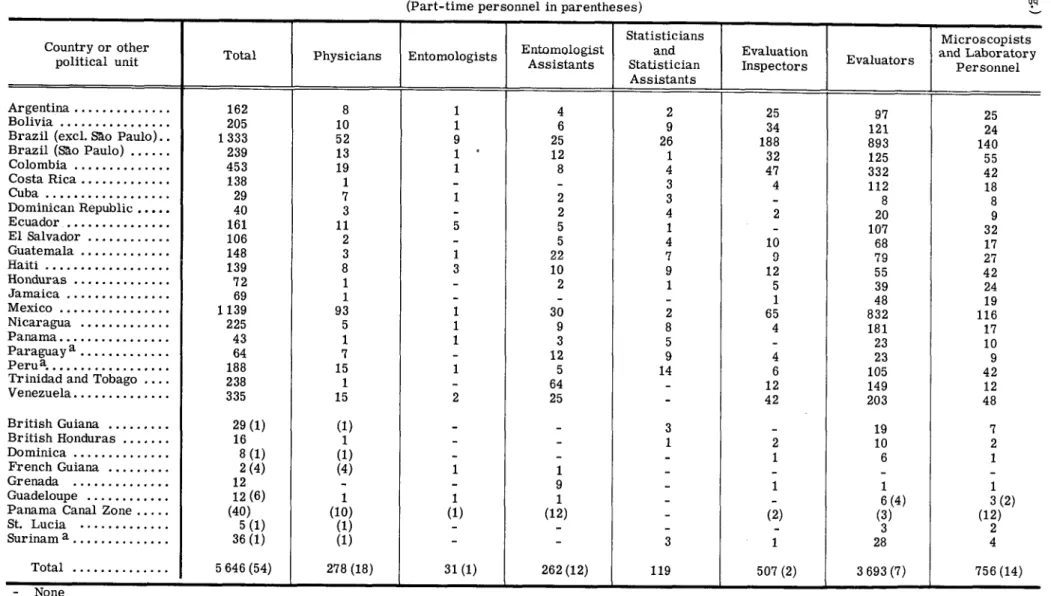
The personnel engaged in malaria eradication activities are shown by type of work and by category of operation in Tables 6 through 10.
Comparisons of numbers engaged at 31 December in 1962 and 1963 by category -spraying operations, epidemiological operations, administration and others, transport- are presented in
Table 6. Details of personnel by country and activity are given in the following tables.
An increase is apparent in personnel in spraying operations, despite the decrease in areas in the attack phase. This results mainly from increases in numbers of spraymen employed in some countries with technical problems, notably Mexico which increased its spraymen from 715 at the end of 1962 to 1,835 at the same date in 1963, and an increase in Brazil where the program is expanding. A number of countries decreased or eliminated spraymen as their need for them was reduced by the progress of their programs. In a few instances reductions were forced by lack of funds, as in Peru where the decrease is partly the result of decreases in attack areas andpartly for financial reasons. The reduction in number of engineers is evidence of progress as some countries no longer need to carry out extensive spraying operations and thus can cut down on professional direction.
The decrease in total epidemiological personnel arises entirely from a decrease in the number of evaluators and their inspectors, primarily in Mexico, where financial stringencies caused a reduction in this category in order to permit the increases already mentioned in other personnel required for problem areas. A sizeable reduction was also made in Colombia. In Brazil, the number of evaluators rose by 250 as the program made efforts to increase evaluation operations to the required level, and Nicaragua also made a major expansion in its staff of evaluators, which
CD15/5 (Eng.)
Page 10 Table 6
PERSONNEL EMPLOYED IN MALARIA E]RADICATION PROGRAMS IN THE AMERICAS 31 DECEMBER 1962 AND 1963 BY CATEGORY
(Part-time personnel in parentheses)
Title
1962
|
19634 _ r
Engineers ... 129 (1) 119 (1) Spraying Chiefs (non-professionals) ... 142 (2) 166 (2)
O S | Sector Chiefs ... 516 (6) 646 (2) Squad Chiefs ... 1933 (2) 1923 (2) s PA Spraymen ... 8773 (55) 9584 (20)
0
Draftsmen... 104 133
SUB-TOTAL ... 11 597 (66) 12 571 (27) Physicians ... 274 (19) 278 (18) Entomologists ... 25 (1) 31 (1)
o
m | Entomologist Assistants ... 224 (14) 262 (12)0o - Statisticians and Statistician Assistants .... 80 119
Q•
X ]Evaluation Inspectors ... 612 (2) 507 (2)pi% |Evaluators ... 3982 (7) 3693 (7) [ Microscopists ... . 683 (12) 756 (14)
SUB-TOTAL ... 5 880 (55) 5 646 (54)
U; { Administrators ... 87 (1) 317 (1)
Administrative Assistants ... ... 485 947
O Accountants ... 13 34
Disbursing Officers ... 54 51
z g Storekeepers ... 91 96
Assistant Storekeepers ... 101 (1) 104 (1) Secretaries ... 444 (1) 351 (1) Others ... 1457 (8) 1852 (56)
SUB-TOTAL ... 2732 (11) 3752 (59)
Mechanics and Assistant Mechanics ... 333 507
Drivers ... 856 (2) 1464 (2)
I d Motorboat Operators ... 198 (2) 223 (2)
Boatmen ... 45 36
SUB-TOTAL ... 1432 (4) 2 230 (4)
(rRANn TOTA ... 21641 (136) 24 199 (144)
CD15/5 (Eng.) Page 11 Table 7
PERSONNEL EMPLOYED IN SPRAYING OPERATIONS IN MALARIA ERADICATION PROGRAMS IN THE AMERICAS - 31 DECEMBER 1963
(Part-time personnel in parentheses) Sanitarians
Country or other Total Engineers or Sector Squad Chiefs Spraymen Draftsmen
political unit Spraying Chiefs
Chiefs
Argentina ... 137 2 6 11 28 86 4
Bolivia ... 60 1 6 4 4 44 1
Brazil (excl. Sao Paulo) . 4 451 23 22a 192 693 3 493 28
Brazil (Sao Paulo) ... 657 8 - 35 130 466 18
Colombia ... 731 3 20 61 22 611 14
Costa Rica ... 44 1 1 6 7 29
Cubab ... 482 1 4 15 75 385 2
Dominican Republic .... 419 2 - 14 67 333 3
Ecuador ... 531 7 _ 35 97 390 2
El Salvador ... 147 1 - - 14 130 2
Guatemala ... 303 2 5 8 38 246 4
Haiti ... 759 6 8 23 120 595 7
Honduras ... 48 - 3 2 6 37
Jamaica ... 46 - 1 16 23 6
Mexico ... 2496 51 58 128 403 1835 21
Nicaragua ... 153 1 7 29 14 99 3
Panama ... 286 - 6 10 45 224 1
bc
Paraguay ... 36 3 7 2 18 - 6
b
Peru . ... 306 6 8 29 53 202 8
Venezuela ... 356 1 - 20 34 293 8
British Guiana ... 19 - 2 1 3 13
French Guiana ... 30 - - - 8 22
Panama Canal Zone .... (27) (1) (2) (2) (2) (20)
b
Surinam ... 74 _ 2 5 21 45 1
Total ... 12 571(27) 119 (1) 166 (2) 646 (2) 1923 (2) 9 584 (20) 133
- None.
Table 8 CI PERSONNEL EMPLOYED IN EPIDEMIOLOGICAL EVALUATION IN MALARIA ERADICATION PROGRAMS
IN THE AMERICAS- 31 DECEMBER 1963 t
(Part-time personnel in parentheses)
Statisticians Microscopists
Country or other Total Physicians Entomologists Entomologist and Evaluation Evaluators and Laboratory
political unit Assistants Statistician Inspectors Personnel
Assistants
I Ii I I
Argentina ... 162 8 1 4 2 25 97 25
Bolivia ... 205 10 1 6 9 34 121 24
Brazil (excl. Sao Paulo).. 1333 52 9 25 26 188 893 140
Brazil (Sao Paulo) ... 239 13 1 12 1 32 125 55
Colombia ... 453 19 1 8 4 47 332 42
Costa Rica ... 138 1 - - 3 4 112 18
Cuba ... 29 7 1 2 3 - 8 8
Dominican Republic ... 40 3 - 2 4 2 20 9
Ecuador ... 161 11 5 5 1 - 107 32
El Salvador ... 106 2 - 5 4 10 68 17
Guatemala ... 148 3 1 22 7 9 79 27
Haiti ... 139 8 3 10 9 12 55 42
Honduras ... 72 1 - 2 1 5 39 24
Jamaica ... 69 1 - - 1 48 19
Mexico ... 1 139 93 1 30 2 65 832 116
Nicaragua ... 225 5 1 9 8 4 181 17
Panama ... 43 1 1 3 5 - 23 10
Paraguay a ... 64 7 - 12 9 4 23 9
Perua. ... Trinidad and Tobago .... 238 188 15 1 5 14 6 105 42
1 - 64 - 12 149 12
Venezuela ... 335 15 2 25 - 42 203 48
British Guiana ... 29 (1) (1) - - 3 - 19 7
British Honduras ... 16 1 - - 1 2 10 2
Dominica ... 8 (1) (1) - - _ 1 6 1
French Guiana ... 2 (4) (4) 1 1 -
-Grenada ... 12 - - 9 1 1 1
Guadeloupe ... 12 (6) 1 1 1 - 6(4) 3(2)
Panama Canal Zone ... (40) (10) (1) (12) (2) (3) (12)
St. Lucia ... 5 (1) (1) - 3 2
Surinam a ... 36 (1) (1) - - 3 1 28 4
Total ... 5 646 (54) 278 (18) 31 (1) 262 (12) 119 507 (2) 3 693 (7) 756 (14)
- None
Table 9
PERSONNEL EMPLOYED IN ADMINISTRATIVE SERVICES AND OTHERS IN MALARIA ERADICATION PROGRAMS IN THE AMERICAS- 31 DECEMBER 1963
(Part-time personnel in parentheses)
Country or other Adminis- Adminis- Disbursing Storekeeper ecretaries Others
political unit trators Assistantstrative Accountants Officers Assistants
Argentina ... 124 4 61 - - 4 8 3 44
Bolivia ... 52 10 11 5 - - 10 16
Brazil (excl. Sao Paulo).. 1 321 242 423 21 - 24 - 22 589
Brazil (Sao Paulo) ... 406 15 83 - 9 7 13 - 279a
Colombia ... 264 1 8 - 15 12 12 63 153
Costa Rica ... 17 1 7 - - 1 1 2 5
Cubab ... 21 2 3 - _ 2 - 4 10
Dominican Republic ... 20 1 2 - - 1 1 4 11
Ecuador ... 98 6 15 - 7 7 - 25 38
El Salvador ... 91 1 1 - 1 1 4 8 75
Guatemala ... 49 - 8 - - 1 2 6 32
Haiti ... 141 9 10 2 1 5 3 17 94
Honduras ... 23 1 4 - - - - 7 11
Jamaica ... 28 2 - - - 1 3 3 19
Mexico ... 523 14 217 - 16 14 25 128 109
Nicaragua ... 70 - 4 - - 1 7 10 48
Panama ... 37 1 5 - - 2 10 4 15
Paraguayb ... 53 1 26 - - 1 1 6 18
Perub ... 146 - 55 6 1 7 7 18 52
Trinidad and Tobago ... 13 1 2 - - 2 3 5
Venezuela ... 209 ... ... - ... ... ... ... 209
British Guiana ... 14 1 - - - 1 1 1 10
British Honduras ... 5 1 - - - 2 2
Dominica ... 1 (1) (1) - - -. . 1
French Guiana ... 1 - - - - 1
Grenada ... 1 (1) 1 - - (1) -
-Guadeloupe ... 1(54) 1 - - - (54)c
Panama Canal Zone ... (2) - - - -_ (2)
St. Lucia ... 1 (1) - - - (1) 1
Surinamb. ... 22 1 2 - 1 2 3 1 12
Total ... 3 752 (59) 317 (1) 947 34 51 96 104 (1) 351 (1) 1852(56)
... No information.
- None
CD15/5 (Eng.) Page 14
Table 10
PERSONNEL EMPLOYED IN TRANSPORT SERVICES IN MALARIA ERADICATION PROGRAMS IN THE AMERICAS - 31 DECEMBER 1963
(Part-time personnel in parentheses)
Mechanics
Country or other Total and Drivers Motorboat Boatmen
political unit assistant operators
Mechanics
Argentina ... 56 26 30
Bolivia ... 78 12 47 19
Brazil (excl. Sao Paulo) ... 827 174 627 a 22 4
Brazil (Sao Paulo) ... 281 40 238 3
Colombia ... 256 56 71 107 22
Costa Rica ... 12 2 10 b
Cuba... 13 5 8
Dominican Republic ... 54 16 38
-Ecuador ... 45 11 27 7
El Salvador ... 65 11 53 1
-Guatemala ... 46 3 38 1 4
Haiti ... 75 23 50 2
-Honduras ... 27 3 23 1
Jamaica ... 36 4 32
-Mexico ... 111 78 25 8
Nicaragua ... 64 2 54 8
Panama ... 10 5 5
b
Paraguay ... 24 1 21 _ 2
b
Peru ... 50 14 23 13
Trinidad and Tobago ... 5 4 1
-Venezuela ... 21 ... 17 4
-British Guiana ... 13 - 5 4 4
British Honduras ... 2 2
Dominica ... 1 - 1
-French Guiana ... 4 1 3 Grenada ... 2 c 1 Guadeloupe ... 6 2 4
Panama Canal Zone ... (4) - (2) (2)
-Surinam b ... 46 11 12 23
-Total ... 2 230 (4) 507 1464 (2) 223 (2) 36
... No information. - None.
CD15/5 (Eng.) Page 15
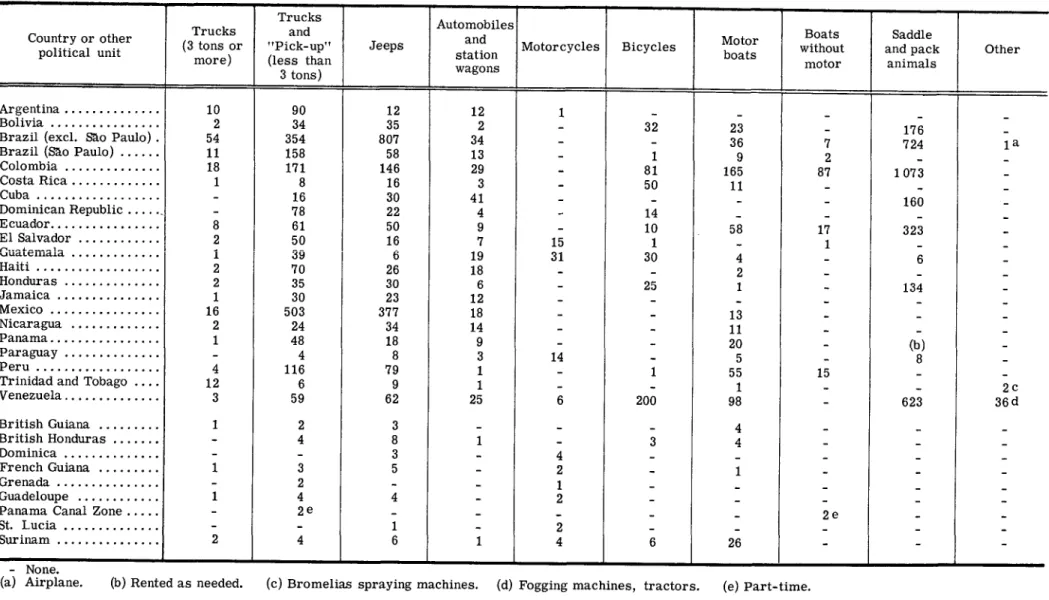
In transport also, data for the Federal Program of Brazil were lacking of 1962. After adjustment for this lack, the total number of transport personnel in malaria eradication programs can be seen to have remained essentially the same, although individual programs have had increases, as in Bolivia, El Salvador, Sao Paulo, or decreases as in Colombia, Honduras and Peru. There is an increasing tendency, encouraged by PAHO, to dispense with drivers for vehicles where one evaluator or supervisor travels singly, and to provide motorcycles instead of jeeps for such persons. This tendency can be seen in Table 11, which gives details of the means of transport used by indi-vidual country programs. The number of motorcycles in use has increased by 58 per cent from 52 at the end of 1962 to 82 in December 1963. Other means of transport have also generally increased in number, the second largest increase being in the number of jeeps, which increased by 19 per cent. Decreases occurred in the number of large trucks, boats without motor and saddle and pack animals.
It can also be mentioned in connection with transport that the services of two transport consultants are now provided by PAHO to aid the national programs, the second having been added during 1963.
Means of transport, both terrestrial and fluvial, have been promptly provided by UNICEF during the year in the quantities recommended by the Organization.
Table 12 presents data concerning the national budgets for malaria eradication, for 1962, 1963, and commitments for 1964, by country, in dollar equivalents. These budget figures may be taken to be adequate in countries whose programs are progressing smoothly, but for many, and especially for those with grave problems which require special supplementary attack measures, the funds which are and can be provided by national governments are seriously inadequate. Such programs are indicated in the table by an asterisk. The need for additional funds to finance attack on all fronts of the problem areas nowbefore neighboring consolidation areas are reinfected to a degree requiring them also to be placed again under attack, is urgent. This need is primarily for additional resources to finance local costs, for which outside sources of assistance in the form of loans are being sought. A loan has been arranged to aid the Federal Program in Brazil, but this is mainly intended to finance imported materials and equipment.
In Table 14 a summary is presented of case detection activities carried out by all programs, by years from 1958 through 1963. The steady increase in slides taken is mainly a result of the gradual progress of malarious areas from early to late attack phase, and thence into consoli-dation. As remaining areas reach consolidation phase this increase will continue. The per cent of slides positive has been considerably affected in recent years by the practice followed in most programs of sampling problem or troublesome areas much more heavily than areas in which trans-mission is being interrupted or consolidation progressing as expected. The percentage of positive slides in these difficult areas being higher, this weighted distribution tends to increase the over-all positivity artificially.
The work done in each program, together with a brief statement of basic data, is shown in a series of tables and graphs for individual countries. Each countrytable begins with a summary of the population and area covered by the program and a map of the distribution of areas within the country, both by phase as of 31 December 1963, a resume of personnel and a table showing the kinds and number of the means of transport available for each major category of operation. The next section presents data relating to the attack areas of the country. Spraying operations since their inception are shown by cycle and a graph covering the data is also presented for quicker ap-preciation of the history and achievements to date. The total population of the attack area for which direct protection is considered necessary and the number of persons actually directly protected by residual spraying are also shown on the graph.
P t':
Table 11 M Un
MEANS OF TRANSPORT IN MALARIA ERADICATION PROGRAMS IN THE AMERICAS - 1963 V
Trucks
Automobiles
Trucks and Boats Saddle
Country or other and Motor
politicaunit(3 tons or "Pick-up" Jeeps an Motorcycles Bicycles ot without and pack Other
political unit m r )station boats
pnmore) (less than aons motor animals
3 tons) wagons
Argentina ... 10 90 12 12 1 - _
Bolivia ... 2 34 35 2 - 32 23 176
Brazil (excl. SAo Paulo) . 54 354 807 34 - - 36 7 724 la
Brazil (Sao Paulo) ... 11 158 58 13 - 1 9 2
Colombia ... 18 171 146 29 - 81 165 87 1073
Costa Rica ... 1 8 16 3 - 50 11 -
-Cuba ... 16 30 41 - - - 160
Dominican Republic ... - 78 22 4 14 _
-Ecuador ... 8 61 50 9 - 10 58 17 323
E1 Salvador ... 2 50 16 7 15 1 - 1 _
Guatemlala .1 .3.9.. ... . . 19 31 30 4 - 6
Haiti ... 2 70 26 18 - - 2 -
-Honduras ... 2 35 30 6 - 25 1 - 134
Jamaica ... 1 30 23 12 - - -
-Mexico ... 16 503 377 18 - - 13 -
-Nicaragua ... 2 24 34 14 - - 11 -
-Panama ... 1 48 18 9 - - 20 - (b)
Paraguay ... 4 8 3 14 - 5 - 8
Peru ... 4 116 79 1 - 1 55 15
-Trinidad and Tobago .... 12 6 9 1 - - 1 - - 2c
Venezuela ... 3 59 62 25 6 200 98 - 623 36d
British Guiana ... 1 2 3 - - _ 4 -
-British Honduras ... _ 4 8 1 - 3 4 -
-Dominica ... - 3 - 4 -
-French Guiana ... 1 3 5 - 2 1 1
Grenada ... 2 - - 1 _
-Guadeloupe ... 1 4 4 - 2
Panama Canal Zone ... - 2 e - - - 2 e
St. Lucia ... - - 1 - 2
Surinam ... 2 4 6 1 4 6 26
- None.
(a) Airplane. (b) Rented as needed. (c) Bromelias spraying machines. (d) Fogging machines, tractors.
h I. _ _ _ _ _ _ _ _ I I I
CD15/5 (Eng.) Page 17 Table 12
NATIONAL BUDGETS FOR MALARIA ERADICATION IN THE AMERICAS, 1982-1964 (in thousands of U. S. dollars)
National Country or other National Budget National Budget Commitments
political unit 1962 1963 1964
I
Argentina ... 576 681 892 *
Bolivia ... - 67*
Brazil (excl. Sdo Paulo) ... 4 120 9878 11 667
Brazil (Sao Paulo) ... 520 979 1 569
Colombia ... 2 383 2 333 2 333 *
Costa Rica ... 276 226 226 *
Cuba ... 1454 1684 1818
Dominican Republic ... *
Ecuador ... 476 698
El Salvador ... 466 366 728
Guatemala ... 511 470 ... *
Haiti ... 50 50 50
Honduras ... 337 320 200
Jamaica ... 355 341 ...
Mexico ... 4965 5 982 6440*
Nicaragua ... a 315 319 485
Panama ... 545 632 644
Paraguay ... 258 296 279
Peru ... 867 888 962
Trinidad and Tobago ... 509 468 470
Venezuela ... 3 406 3593 3593
British Guiana ... 41 47 47
British Honduras ... 35 33 34
Dominica ... 12 9 10
French Guiana ... 96 ...
Grenada ... 8 1 1
Guadeloupe ... 130 146 ...
Panama Canal Zone ... 50 50 50
St. Lucia ... 23 5 ...
Surinam ... 209 188 298
... No information. - None.
~C
aq U
CO V
0s
Table 13COMPARATIVE RESULTS OF ACTIVE AND PASSIVE CASE DETECTION IN MALARIA ERADICATION PROGRAMS IN THE AMERICAS, 1963
Active case detection Passive case detection
Country or other
Blood slides Average Blood slides Average
Average Average Average of slides
numbpolitical Average of unit production number of of notification per month per
evalnumber of Number Per cent per evaluator notification post producing Number Per cent productive
examined positive per month posts slides examined positive notification
per month post
Argentina ... 94 128 789 0.2 114.2 1253 211 28 621 2.2 11.3
Bolivia ... 156 113957 1.5 60.8 2 266 820 62062 1.1 6.3
Brazil (excl.Sao Paulo) 856 370 768 7.0 36.1 17 570 5 721 489 913 17.0 7.1
Brazil (Sao Paulo) ... 148 287 961 0.2 162.1 4 704 1815 97 032 1.8 4.5
Colombia ... 377 329 910 3.2 72.9 8 032 4 963 247 496 3.0 4.2
Costa Rica ... 89 236019 0.3 221.0 646 -121 21801 2.6 15.0
Cuba ... 8 6051 0.5 63.0 867 280 120283 0.7 35.8
Dominican Republic .. 18 69 302 0.3 320.8 600 53 4 050 41 6.4
Ecuador ... 100 105 103 0.3 87.6 3 827 1730 181348 1.9 8.7
El Salvador ... 68 39493 3.2 48.4 1440 1 178 199 298 8.3 14.1
Guatemala ... 117 242 201 2.5 172.5 2 278 1 038 106 665 8.5 8.6
Haiti ... 47 312140 1.5 553.4 639 361 74 517 2.5 17.2
Honduras ... 85 72 064 2.5 70.6 2 182 1369 192 067 2.7 11.7
Jamaica ... 82 63 350 0.0 64.4 711 172 122109 0.0 59.2
Mexico ... 559 1400550 0.7 208.8 22 399 5 323 432001 1.5 6.8
Nicaragua ... 65 124 650 3.7 159.8 1520 873 90 200 7.7 8.6
Panama ... 21 89182 1.2 353.9 1060 282 63716 2.5 18.8
Paraguay ... 37 27 712 0.8 62.4 2130 850 65 094 4.9 6.4
Peru ... 117 354 568 0.3 252.5 9 388 1572 136 359 0.5 7.2
Trinidad and Tobago . 73 108632 0 124.0 83 ... 2 291 0 ...
United States ... ... _ _ _ ... ... 58 87.9
Venezuela ... 422 352029 0.6 69.5 2 285 344 147 915 0.6 35.8
British Guiana ... 19 28 345 a 1.3 124.3 78 7 3 91 0b 2.6 55.8
British Honduras .... 9 4904 0.2 45.4 129 81 8181 0.1 8.4
Dominica ... 5 7 264 0 121.0 26 16 9 511 0 49.6
French Guianac ... - 1227 1.6 _ ... ... 1 421 3.5 ...
Grenada c ... , 1 56 0 4.7 - -
-Guadeloupe c ... 8 17 035 0 177.5 ... ... 135 0.7 ...
Panama Canal Zone.. 3d ... ... 21008 0.1
St. Lucia ... 3 4031 0.1 112.0 88 41 11105 0.0 22.6
Surinam ... 25 62475 0.6 208.2 48 5 5221 28.9 87.0
... No information. - None.
CD15/5 (Eng.) Page 19
Table 14
SUMMARY OF CASE DETECTION IN THE AMERICAS, 1958-1963
Number of slides Number of slides Per cent
examined found positive positive
1958 1716103 56705 3.3
1959 2749117 75612 2.8
1960 3 955 149 79 998 2.0
1961 5 341004 99 539 1.9
1962 7 221 367 177 089 2.4
1963 7 903 156 227 026 2.9
In connection with these figures it should be noted that in many programs, particularly those with technical problems but also those with areas in which attack operations are lagging or transmission persists because of difficulties of access, heavy migration and similar problems, the taking of blood smears is often more intense in the more malarious areas than in areas responding well to attack, and the percentage of positives for the attack area as a whole is distorted, with an upward bias. This effect is present in the data for Mexico from mid- 1960 onwards, for Guatemala, Nicaragua, Honduras, Costa Rica and others.
Changes in the positivity rate for attack areas must also be interpreted in relation to shifts of areas from attack into consolidation phase. The areas of lowest positivity are removed and this tends to increase positivity in the remaining attack area, while at the same time perhaps increasing the parasite incidence rate in the consolidation area to which these new regions are added.
Operations in consolidation phase areas are set out in the following section of the country table. It is considered that populations in consolidation areas should be uniformly sampled by the taking of blood smears at a usual rate of approximately one per cent of the population per month during the transmission season (somewhat less for cities and large towns), and the per cent of positive slides is an indicator of the progress made. This datum also must be interpreted in the light of the adequacy and quality of the slides taken, and also with regard to the origin of the in-fection as determined by careful investigation of each case -whether autochthonous, relapsing, imported, etc. Quarterly data on population of consolidation areas, slides examined, and positives by species and by the origin of the infection are tabulated.
CD15/5 (Eng.) Page 20
Country: ARGENTINA Date attack phase began: 1 August 1959
STATUS OF MALARIA PROGRAM AT DECEMBER 1963
Population Area (thousands)
LZ]J
-lljfTT0ii
ES3
[=21
TOTAL COUNTRY 21100
Non malarious areas 18 408 Originally malarious areas
Maintenance phase 1 004
Consolidation phase
Attack phase
Preparatory phase
4 024 458
3675407
40 100
580 59336
359 93549
749 156066
Total originally malarious areas 2 692 349 051
PERSONNEL
Activity Professional | Non professional
I
TotalSpraying operations 2 135 137
Evaluation operations 13 149 162
Administrative and other - 124 124
Transport - 56 56
Total 15 464 479
TRANSPORT FACILITIES
Type Spraying Evaluation Mixed or other Operations Operations operationstal
Four wheel vehicles 55 49 20 124
Two wheel vehicles - - 1 1
Boats Animals Other
ARGENTINA (Cont.)
SPRAYING OPERATIONS
Houses sprayed Inhabitants directly protected Insecticide used Average No. of
total Date Cycle per house houses sprayed
coverage DDT Planned Sprayed Planned Protected (g. technical) per sprayman/
[overage
DDT
day
55 84 9a
1st 81619 2 1 4 6b 288768 205189 263
1st Aug. 59-Jun. 60 811 7 0a
2nd 92438 6 9 0 9b 347 012 330733 255
78 487 a
3rd 84 011 6 4 4 2b 323 610 327 209 305
2nd Jul. 60-Jul. 61 74188 a ...
4th 84077 2 8 0 3b 308142 282178 334
3rd 5th Aug. 61-Jun. 81906 62 2 0 5 2b 303 290 280425 383
3rd Aug. 61-Jun. 62 5th ...
6th 96 249 7 3 0 2 7a 341780 259 379 349
7th 97 908 63 9 6 7a 351098 229 432 353
8th 95552
3 50b 318288 182273 329
4th Jul. 62-Jun. 63 8th 95 552333 46627 a 317 972 164 420 32
5th Jul. 63-Dec. 63 9th 90 333 46 627 a 317 972 164 420 320
/_ \ A__ _____- L___ HA sT /|5\ Aso~~~~~~~~sqzA Aq~~q q 320 . .
(a) Sprayed twice a year. ul) oprayea onct a year.
120 1 1 1
1 1959 1 1960 1 1961 1 1962 1963 [1
m
Inhabitants to be directly protected ////X// Inhabitants directly protectedHouses sprayed
- - - - Houses to be sprayed
z:
m
rP
0
Od 0
CD U1 te
'R9
C:'r"
o
o
(D
0
0
DO
ARGENTINA (Cont.)
EPIDEMIOLOGICAL EVALUATION OPERATIONS, ATTACK PHASE AREAS
Slides examined Species found
Year of
total Date Total Positive P. falci- . vivax . malariae
P. vivax P. malariae coverage No. Number Number IPercentagePercentage parum
ista Aug. 59-Jun.60 70700 2497 3.53 6 2491
2ndb Jul. 60-Jul. 61 96991 3 880 4.00 4 3876
-3rd Aug. 61-Jun.62 107 926 5 081 4.71 1 5 080
-4th Jul. 62-Jun.63 102418 1572 1.53 - 1571 1
5th Jul. 63-Dec.63 45 147 146 0.32 - 146
-EPIDEMTITO.COTCAT EVATLUTTATION PFP.A'T'TNR CONSOLIDATIONATTfM AND iMATE.T'NTAN('E PHASE A1EAS
10 0 W Ur GQ 0-CD C
E. -" U
Rs
J. LIUVII L.IUII. - IOlle.
(a) Data for entire country; not separated by attack or consolidation phase. (b) Data for attack and consolidation phases, July to December 1960; attack phase only, January to July 1961.
Date Origin of infections Species of parasite
Estimated % Imported
No. of
~~Total
population
popu-population
~sidtes
Nslides o No. ofAu-paua Nato. pofitAu- Relaps- from Inue dcd fed jau -ie
in thearea examined .itive lation tochtho- Relaps- from Induced Intro- Unclassi P. falci- P.vivax P. malar
& (thousands) sampled nous ing from areas duced ied paru - - iae
abroad within country
1959 911 9491 1.0 51 - - - 32 - 19 ... 19 ...
1960 929 14438 1.5 26 - - - 14 - 12 - 26
-1st
12374 3.9 1 -1
- - - _ 1-2nd 13054 4.1 13 - 5 - 8 - 13
-1961 3rd 1 278
8
8222 2.6 2- - I 1 - 2
-4th 10655 3.3 1 - 1 - I
-1st
9011 2.3 1 - 1 - - . - 11962 2nd 8034 2.1 11 - 1 - 3 1 6 - 10 1
1962 3rd 1 542 6545 1.7 4 - 4 .-
- - - - 3 1
4th 16085 4.2 7 - 4 - 2 - 1 - 7
-Ist 13371 3.4 7 2 - - 4 1 - - - 6 1
2nd 17759 4.5 2 - - 1 1 - - 1 1
1 9 63 3rd 1584 12367 3.1 2
-- 1 - - I - 2
-4th 17245 4.3 - - ..
Country: BOLIVIA Date attack phase began:
CD15/5 (Eng.) Page 23
1 September 1958
STATUS OF MALARIA PROGRAMAT DECEMBER 1963
Population (thousands)
TOTAL COUNTRY 3609
Non malarious areas 2 302 Originally malarious areas
Maintenance phase 0
Consolidation phase
Attack phase
Preparatory phase
Area km2
1098581
274 321
0
1 179 619 540
128 204 720
0 0
Total originally malarious areas 1 307 824 260
PERSONNEL
Activity Professional
[
Non professional | TotalSpraying operations 1 59 60
Evaluation operations 16 189 205
Administrative and other 3 49 52
Transport - 78 78
Total 20 375 395
TRANSPORT FACILITIES
Spraying Evaluation Mixed or other Operations Operations operations
Four wheel vehicles 8 56 9 73
Two wheel vehicles 5 25 2 32
Boats 11 10 2 23
Animals 114 62 - 176
Other
Total 138 153 13 304
BOLIVIA (Cont.)
SPRAYING OPERATIONS
Houses sprayed Insecticide used Average
Year of Inhabitants directly per house houses
total Date DDT Dieldrin protected (g. technical) per house sprayed
overage per
Cycle Planned Sprayed Cycle Planned Sprayed Planned Protected DDT Dieldn
spray-I______
~
~ ~ ~
~
~
~
~
~
~
-~
~
~
~
D ____jman/dayI1st 131444 116572 1s627 362 556190 3621 8.3
I Sp 8Ag 9
2nd 1488200 129119 691820 627 210 331 7.0
2nd Sep. 59-Aug. 60 3rd 147 263 136601 695521 634 859 319 118 7. 6
4th 153 514 142536 692274 660185 309 7.2
5th 169 690 159 952 742 902 700 295 331 7.6
3rd Sep. 60-Aug. 61 6th 142 210 134 173 - - - 612356 577 743 329 7.5
7th 129 600 124 623 546005 524 986 353 7.9
4th Sep. 61-Sep. 62 8th 135 474 128898 - - 551785 525 005 359 - 8.6
9th 32 561 34 469 124 643 131962 408 6. 0
5th Oct. 62-Sep. 63 10th 32361 28893 110578 98727 428 5.9
9nn
1. 50
Cycle
Year
1
1958 1 1959 19160 1961 I IA192
0
00
°
400
i
m
200 ,
z7
0
I 19QR I
,-t, uInhabitants to be directly protected /// Inhabitants directly protected
- - - Houses to be sprayed
Houses sprayed
0
['3
V
.800
·
-BOLIVIA (Cont.)
EPIDEMIOLOGICAL EVALUATION OPERATIONS, ATTACK PHASE AREAS
Slides examined Species found
Year of .
total Date Total Positve P. falci- P. vivax P. malariae
coverage No. Number Percentage parum _
1st Sep.58-Aug.59 50980 1843 3.62 273 1 268 302
2nd Sep. 59-Aug.60 99 241 1106 1.12 124 803 179
3rda Sep.60-Aug.61 126384 735 0.58 90 615 30
4th a Sep.61-Sep. 62 174800 982 0.56 214 758 10
5th a Oct. 62-Sep. 63 165200 2026 1.23 803 1222 1
6th a Oct.63-Dec.63 64913 679 1.05 281 398
-EPIDEMIOLOGICAL EVALUATION OPERATIONS, CONSOLIDATION PHASE AREAS
Date Origin of infections Species of parasite
I (thousands) sampled psidese nou ing fr6m areas d fied pP.vivax -aYai - |
Estimated within
tD2S of :1Total
- None.
(a) Data for the entire country, not separated by attack or consolidation phase. (b) January-September. (c) January-August. (a) Data for the entire country, not separated by attack or consolidation phase. (b) January-September. (c) January-August.
09 P Ur
o U ,
CD15/5 (Eng. ) Page 26
Country: BRAZIL (excl. Sao Paulo) Date attack phase began:
STATUS OF MALARIA PROGRAM AT DECEMBER 1963
Population (thousands)
TOTAL COUNTRY
Area km2
63248 8266622
Non malarious areas 31084
Originally malarious areas
Maintenance phase 0
Consolidation phase
Attack phase
Preparatory phase
927 863
0
0 0
5 054 278 406
27 110 7 060 353
Total originally malarious areas 32 164
PERSONNEL
Activity Professional I Non professional Total
Spraying operations 27 4 424 4451
Evaluation operations 60 1 273 1 333
Administrative and other 34 1 287 1 321
Transport 2 825 827
Total 123 7 809 7 932
TRANSPORT FACILITIES
Type Spraying Evaluation Mixed or other Total
Operations Operations operations
Four wheel vehicles 717 276 256 1 249
Two wheel vehicles - -
-Boats 25 11 7 43
Animals 601 123 - 724
Other - 1a 1
Total 1343 410 264 2 017
a) Airplane.
7 338 759 August 1959
E]
I]i
BRAZIL (Excl. Sao Paulo) (Cont.)
SPRAYING OPERATIONS
Houses sprayed Inhabitants directly protected Insecticide used Average houses
Year of Cycle per house sprayed per
total Date DDT Sprayed Planned Protected (g. technical)
spray-coverage Planned Sprayed Planned Protectedman/day
(a) Jan. 61-Nov. 61 (a) 820095 814475b 3399 300c 3 380000c ... ...
Jan. 62-Jun. 62 ... 1 622 052 1 350 566 7 016 997 5 843 075 424
(a) Jul. 62-Dec. 62 ... 2 292 000 1 960 358 9 724 956 8 317 433 420 .
Jan. 63-Jun. 63 ... 2 062 265 1 726 289 8 574 898 7 178 751 407
(a) Jul. 63-Nov. 63 ... 2 045 534 1 790 239 8 493 057 7 432 511 413 7.6
... No information.
(a) Owing to different spray cycle timing in different regions, these data refer to the calendar year. (b) Sprayings. (c) Estimated.
0
tr
o
CD
v-2400
1600
Annn. 1 I ;0000 11[
8000 Z0
6000
4000 O a)
2000
'-0 800
Year 1961 1962 1963
[Z
i
Inhabitants to be directly protected Inhabitants directly protected..- - - - Houses to be sprayed
Houses sprayed
Id .
P U3
Pa to
CD-Is
- Q
I
Pt 0
a
to-11 CJI
~q
BRAZIL (excl. Sao Paulo)
EPIDEMIOLOGICAL EVALUATION OPERATIONS, ATTACK PHASE AREAS
Slides examined Species found
Year of
total Date Total Positive P. falci- P. vivax P. malariae P. vivax P. malariae coverage No. Number Percentage parum
(a) Jan. 61-Dec. 61 230 205 3 6 91 2b 16.03 3 620 32 285 2
(a) Jan. 62-Dec.62 513767 68 371 13.31 22683 45 683 5
(a) Jan. 63-Dec. 63 860681 109 210 12.69 37 502 71 610 98
CD15/5 (Eng.) Page 29
Country: BRAZIL (Sao Paulo) Date attack phase began: 4 January 1960
STATUS OF MALARIA PROGRAM AT DECEMBER 1963
Population Area km2 (thousands)
TOTAL COUNTRY
[ Non malarious a:
Or Maintenance pha
"I l Consolidation ph
\E|
i
-- I
Attack phase | | *Preparatory phl ::- i l13 826
reas 11074
iginally malarious areas
se 0
ase
Lse
247 239 19 224
0
1 256 145829
1496 82186
0 0
Total originally malarious areas 2 752 228 015
PERSONNEL
Activity Professional Non professional Total
Spraying operations 8 649 657
Evaluation operations 13 226 239
Administrative and other - 406 406
Transport 281 281
Total 21 1562 1 583
TRANSPORT FACILITIES
Spraying Evaluation Mixed or other Total Operations Operations operations
Four wheel vehicles 116 112 12 240
Two wheel vehicles - - 1 1
Boats 7 4 - 11
Animals - -
-Other - -
BRAZIL (Sao Paulo) (Cont.)
SPRAYING OPERATIONS
Houses sprayed Inhabitants directly protected nsecticideused Average houses
Yetotal Dateof Cycle per house sprayed per
coverage Planned Sprayed Planned Protected DDT man/day
1st Jan. 60-Jan. 61 1st 481 533 455 219 2 002 214 1892 679 433 8. 4
2nd 475 121 458926 1992182 1924405 404 9. 8
2nd
Feb.61-Jan. 62 3rd 441 104 436 048 1 870 722 1 849 398 416 9.4
4th 436 057 431473 1807892 1789 051 412 9.7
3rd
Feb.62-Jan. 63 5th 381 254 380 623 1 605 079 1 602 444 419 9. 7
6th 385 555 383717 1 558 413 1550975 420 9. 8
4th
Feb.63 Jan. 64 7th 378 922 366817 1525 540 1477 021 424 9.7
8th 324 556 316 221 1 346 907 1312405 433 9.5
.~~~~~~~~
1 1960 1961
I -- - -
~Houses
to be sprayedHouses sprayed
(0
c.-El
2 000
1 600
0o
1200
800 ;
0
400 I
0
o
Cce
Y0
02
M
(0
02
0
02
r.
W02
Cycle Year
Inhabitants to be directly protected
//////X/ /X Inhabitants directly protected
I .AA. ..
BRAZIL (Sao Paulo) (Cont.)
EPIDEMIOLOGICAL EVALUATION OPERATIONS, ATTACK PHASE AREAS
Slides examined Species found
Year of
total Date Total Positive P. falci- vivax P malariae
coverage No. Number
]
Percentage parum1st Jan. 60-Jan. 61 124 525 9 078 7.29 72 9 005 1
2nd Feb.61-Jan. 62 219 841 7 082 3.22 262 6 817 3
3rda Feb.62-Jan. 63 381413 3 314 0.87 228 3082 4
4tha Feb.63-Jan. 64 388 981 2156 0.55 433 1722 1
(a) Data for entire state; not separated by attack or consolidation phase.
,if 0 P tv aq r
(D n
C4 '
,c W
'R;
re
CD15/5 (Eng.) Page 32
Country: COLOMBIA Date attack phase began: 20 September 1958
STATUS OF MALARIA PROGRAM AT DECEMBER 1963
Population Area km (thousands)
TOTAL COUNTRY 15181
Non malarious areas 5 617
Originally malarious areas
Maintenance phase 0
Consolidation phase
Attack phase
Preparatory phase
1 138 338
111905
0
5 305 122 920
4009 863513
250
Total originally malarious areas 9 564
40 000
1026433
PERSONNEL
Activity Professional INon professional | Total
Spraying operations 3 728 731
Evaluation operations 24 429 453
Administrative and other 3 261 264
Transport - 256 256
Total 30 1674 1704
TRANSPORT FACILITIES
Spraying Evaluation Mixed or other
Operations Operations operations Total
Four wheel vehicles - 364 364
Two wheel vehicles - - 81 81
Boats - 252 252
Animals - 1073 1073
Other
Total - 1770 1770
LE3
Eal
__
mEE
COLOMBIA (Cont.)
SPRAYING OPERATIONS
Houses sprayed Inhabitants directly protected Insecticide used Average houses
Year of DCycle per house sprayed per
total Date DDT (g. technical)
spray-coverage Planned Sprayed Planned Protected DDT man/day
1st 1 235 473 1 181 235 6 900 118 6 597 002 466 6. 6
1st Oct. 5-Sep.59 2nd 1 240 810 1 176 392 6 848 030 6 492119 425 8.9
3rd 1 273 295 1 196 930 6 915 265 6 500 325 409 9. 4 2nd Oct. 59-Sep. 60 4th 1228 550 1 162 059 6 556 771 6 201 358 309 9. 7 5th 1 253 594 1 181 557 6 642 794 6 261 680 397 9. 7 6th 1050 556 945 501 a 5 320 016 4 788 305 402 9. 3 7th 796 056 738 459 a 3 997 793 3 708 400 408 8. 9 4th Oct.6 1-Sep. 62 8th 789 399 693 315 a 3 928 049 3 449 630 421 8.8
9th 701762 5 8 6 7 4 0b 3 440 739 2 876 514 435 8. 4 5th Oct. 62-Sep. 63 10th 690 726 576 540 b 3 363 145 2 806 950 459 7. 9 6th Oct. 63-Dec.63 11th c 291 290 d 230851 1405766 1 113 992 440 7. 8
(a) Some houses were sprayed in cycles of once a year. (b) Some houses were sprayed in cycles of one, three and four times a year. (c) Cycle not yet finished. (d) 550 518 houses planned to be sprayed in the complete cycle.
1500
1200
900
600
300
01
IUUU
5600 °
4200
2800
1400 1400 i
0
61 1 1962 1
- - - - Houses to be sprayed
Houses sprayed
c,>
It
aq~
z
In
0n
0
r-Cycle Year