Dimensions of sleepiness and their correlations with
sleep-disordered breathing in mild sleep apnea*
,**
Dimensões da sonolência e suas correlações com os transtornos respiratórios do sono na apneia do sono leve
Denis Martinez, Magali Santos Lumertz, Maria do Carmo Sfreddo Lenz
Abstract
Objective: There are many ways of assessing sleepiness, which has many dimensions. In patients presenting a borderline apnea-hypopnea index (AHI, expressed as events/hour of sleep), the mechanisms of excessive daytime sleepiness (EDS) remain only partially understood. In the initial stages of sleep-disordered breathing, the AHI might be related to as-yet-unexplored EDS dimensions. Methods: We reviewed the polysomnography results of 331 patients (52% males). The mean age was 40 ± 13 years, and the mean AHI was 4 ± 2 (range, 0-9). We assessed ten potential dimensions of sleepiness based on polysomnography results and medical histories. Results: The AHI in non-rapid eye movement (NREM) stage 1 sleep (AHI-N1), in NREM stage 2 sleep (AHI-N2), and in REM sleep (AHI-REM) were, respectively, 6 ± 7, 3 ± 3 and 10 ± 4. The AHI-N2 correlated significantly with the greatest number of EDS dimensions (5/10), including the Epworth sleepiness scale score (r = 0.216, p < 0.001). Factor analysis, using Cronbach’s alpha, reduced the variables to three relevant factors: QUESTIONNAIRE (α = 0.7); POLYSOMNOGRAPHY (α = 0.68); and COMPLAINTS (α = 0.55). We used these factors as dependent variables in a stepwise multiple regression analysis, adjusting for age, gender, and body mass index. The AHI-N1 correlated significantly with POLYSOMNOGRAPHY (β = −0.173, p = 0.003), and the AHI-N2 correlated significantly with COMPLAINTS (β = −0.152, p = 0.017). The AHI-REM did not correlate with any factor. Conclusions: Our results underscore the multidimensionality of EDS in mild sleep apnea.
Keywords: Disorders of excessive somnolence; Sleep apnea syndromes; Sleep, REM; Polysomnography.
Resumo
Objetivo: Há muitas formas de avaliação da sonolência, a qual possui diversas dimensões. Em pacientes com um índice de apneia-hipopneia (IAH, expresso em eventos/hora de sono) limítrofe, os mecanismos da sonolência exces-siva diurna (SED) permanecem apenas parcialmente esclarecidos. Nos estágios iniciais do transtorno respiratório do sono, o IAH pode estar relacionado a outras dimensões da SED ainda não exploradas. Métodos: Revisamos os resultados de polissonografia de 331 pacientes (52% do sexo masculino). A idade média foi de 40 ± 13 anos e o IAH médio de 4 ± 2 (variação, 0-9). Avaliamos dez dimensões potenciais de sonolência com base nos resultados da polissonografia e da história médica. Resultados: O IAH em sono non-rapid eye movement (NREM) estágio 1 (IAH-N1), em sono NREM estágio 2 (IAH-N2), e em sono REM (IAH-REM) foram, respectivamente, 6 ± 7, 3 ± 3 e 10 ± 4. O IAH-N2 se correlacionou significantemente com o maior número de dimensões de SED (5/10), incluindo o escore da escala de sonolência de Epworth (r = 0,216, p < 0,001). Análise de fatores, utilizando-se o alfa de Cronbach, reduziu as variáveis a três fatores relevantes: QUESTIONÁRIO (α = 0,7); POLISSONOGRAFIA (α = 0,68); e QUEIXAS (α = 0,55). Usando esses fatores como variáveis dependentes na regressão múltipla, ajustando para idade, gênero e índice de massa corporal, o IAH-N1 se correlacionou significantemente com POLISSONOGRAFIA (β = −0,173, p = 0,003) e o IAH-N2, com QUEIXAS (β = −0,152, p = 0,017). O IAH-REM não se correlacionou com nenhum fator. Conclusões: Nossos resultados confirmam a multidimensionalidade da SED na apneia do sono leve.
Descritores: Distúrbios do sono por sonolência excessiva; Síndromes da apneia do sono; Sono REM; Polissonografia.
* Study carried out in the Division of Cardiology of the Porto Alegre Hospital de Clínicas, Universidade Federal do Rio Grande do Sul – UFRGS, Federal University of Rio Grande do Sul – Porto Alegre, Brazil.
Correspondence to: Denis Martinez. Serviço de Cardiologia, Hospital de Clinicas de Porto Alegre, Rua Ramiro Barcelos, 2350, CEP 90035-903, Porto Alegre, RS, Brasil.
Tel 55 51 3022-2282. E-mail: [email protected]
Financial support: This study received financial support from the Fundo de Incentivo à Pesquisa e Eventos do Hospital de Clínicas de Porto Alegre (FIPE-HCPA, Porto Alegre Hospital de Clínicas Events and Research Incentive Fund).
Submitted: 5 August 2008. Accepted, after review: 29 December 2008.
OSAHS. It has been suggested that sleepiness has multiple dimensions, which are assessed by different tests, and that there is no gold standard for measuring sleepiness.(16) One recent
study identified three dimensions of sleepiness: perceived daytime sleepiness; subjective sleep propensity in active situations; and subjective sleep propensity in passive situations.(17)
The word “sleepiness” has a variety of mean-ings and interpretations; individuals with OSAHS more often use terms such as “fatigue”, “tired-ness” and “lack of energy”. Defining sleepiness has implications for the differential diagnosis. There are four possible diagnoses for a patient suspected of having OSAHS(18):
• OSAHS, if the AHI is > 5 and the patient reports EDS
• UARS, if the AHI is < 5 and the patient reports EDS
• SDB, if the AHI is > 5 and there is no evidence of sleepiness
• normal, if the AHI is < 5 and there is no evidence of sleepiness
Clinicians face a diagnostic challenge when subjective EDS is difficult to establish. For instance, if the patient complains only of tired-ness in the morning or the ESS score is < 10. The diagnosis can also be complex when borderline polysomnography values are obtained. Examples of such borderline values include an AHI ≈ 5 or a mean sleep latency (as determined by the MSLT)
≈ 10 min.
Kass et al. brought the important clinical problem of borderline SDB to light and initi-ated the search for different causes of EDS in patients with SDB.(8) Although the results
obtained by those authors are in contrast with all subsequent evidence, we can assume that the AHI-REM conveys some type of diagnostic information that was revealed only in their study. Most authors acknowledge the urgent need for evidenced-based data to help define which symptoms influence the diagnostic process, as well as to identify the precise normal limits of polysomnography values. To date, the decisions made by international societies regarding the diagnostic criteria of OSAHS have been largely based on experience rather than on evidence.(19) Because sleepiness seems to be a
multidimensional symptom, we decided to test the hypothesis that readily available polysom-nography data and medical history can explain
Introduction
Obstructive sleep apnea-hypopnea syndrome (OSAHS) is a life-threatening disease that causes various symptoms,(1,2) the most serious
of which is sleepiness due to the increased risk for motor-vehicle accidents.(3-5) The
patho-physiology of OSAHS is complex.(6) One of the
major mechanisms of OSAHS is that of respira-tory arousals, which fragment sleep, resulting in excessive daytime sleepiness (EDS). In popula-tions with OSAHS, however, polysomnographic indices of sleep fragmentation seldom exhibit a strong association with objectively or subjec-tively measured EDS.(7) The gold standard
for assessing sleepiness is the multiple sleep latency test (MSLT), and one of the most useful parameters in evaluating patients suspected of suffering from sleep-disordered breathing (SDB) is the apnea-hypopnea index (AHI), which is expressed as events/hour of sleep. Using the MSLT, Kass et al. found that an AHI during rapid eye movement (REM) sleep (AHI-REM) > 15 is associated with EDS, even in individuals with an overall AHI < 10.(8) This finding suggests that
fragmentation of REM sleep is more important than is overall sleep fragmentation as a source of EDS.(8) Although subsequent studies have
not confirmed this finding,(9,10) the
discrepan-cies could be due to methodological differences related to the use of the MSLT.(11) Upper airway
resistance syndrome (UARS), another cause of EDS,(12) is also characterized by respiratory
arousals, without, however, oxygen desaturation or cessation of breathing. Hypoxemia is asso-ciated with hypersomnia in OSAHS.(13) However,
in individuals with UARS, oxygen desaturation is negligible or absent. Therefore, the sources of EDS in patients with mild OSAHS and UARS remain only partially understood.
In the Sleep Heart Health Study,(14) involving
1,824 individuals, the AHI was found to be significantly associated with EDS, as measured by the Epworth sleepiness scale (ESS), a subjec-tive, self-report measure.(15) Therefore, subjective
1,456 patients. Among those patients, the clinical data were complete for 378, who were therefore eligible for inclusion in the study. We excluded 26 individuals who had not spent at least 30 min in REM sleep and in non-REM (NREM) sleep, as well as 21 individuals who had been taking anxiolytic, antidepressant or psychotropic substances. As can be seen in Table 1, the 331 cases selected presented the following characteristics: suspected OSAHS; AHI < 10; overnight polysomnography; and complete self-report data regarding sleepiness. The study was approved by the Human Research Ethics Committee of the Porto Alegre Hospital de Clínicas.
Polysomnography data were recorded from 11:00 pm to 7:00 am, as described elsewhere,(20)
and scored according to criteria adopted by the Brazilian Sleep Association.(21) Respiratory
param-eters were assessed by calibrated inductance the evolution of sleepiness in the initial phases
of SDB, during which the REM-sleep specific AHI might be associated with other, as yet unex-plored, dimensions of EDS.
Methods
In this retrospective observational study, we stored selected patient and polysomnog-raphy data in computer files. The sample size was defined on the basis of data in the litera-ture.(9) From January of 2000 to June of 2005,
3,973 patients (≥ 18 years of age), suspected of having sleep disorders, underwent clinical eval-uation—including determination of body mass index (BMI)—and overnight polysomnography at the sleep laboratory of the Federal University of Rio Grande do Sul School of Medicine, in Porto Alegre, Brazil. After the desired sample size had been attained, we reviewed the data-base. We found the overall AHI to be < 10 in
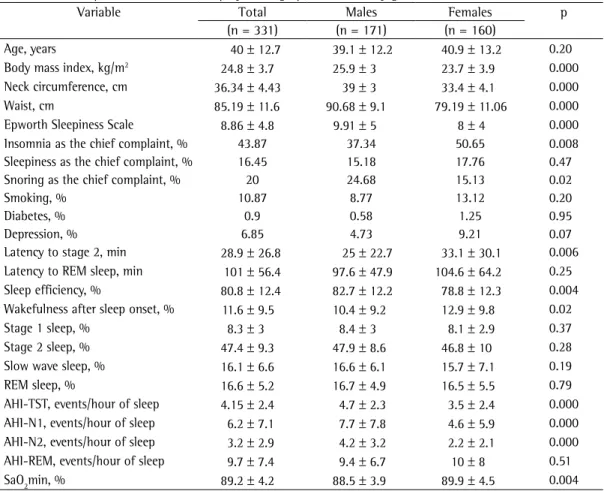
Table 1 - Anthropometric, clinical, and polysomnographic variables by gender.
Variable Total Males Females p
(n = 331) (n = 171) (n = 160)
Age, years 40 ± 12.7 39.1 ± 12.2 40.9 ± 13.2 0.20
Body mass index, kg/m2 24.8 ± 3.7 25.9 ± 3 23.7 ± 3.9 0.000
Neck circumference, cm 36.34 ± 4.43 39 ± 3 33.4 ± 4.1 0.000
Waist, cm 85.19 ± 11.6 90.68 ± 9.1 79.19 ± 11.06 0.000
Epworth Sleepiness Scale 8.86 ± 4.8 9.91 ± 5 8 ± 4 0.000
Insomnia as the chief complaint, % 43.87 37.34 50.65 0.008
Sleepiness as the chief complaint, % 16.45 15.18 17.76 0.47
Snoring as the chief complaint, % 20 24.68 15.13 0.02
Smoking, % 10.87 8.77 13.12 0.20
Diabetes, % 0.9 0.58 1.25 0.95
Depression, % 6.85 4.73 9.21 0.07
Latency to stage 2, min 28.9 ± 26.8 25 ± 22.7 33.1 ± 30.1 0.006 Latency to REM sleep, min 101 ± 56.4 97.6 ± 47.9 104.6 ± 64.2 0.25 Sleep efficiency, % 80.8 ± 12.4 82.7 ± 12.2 78.8 ± 12.3 0.004 Wakefulness after sleep onset, % 11.6 ± 9.5 10.4 ± 9.2 12.9 ± 9.8 0.02
Stage 1 sleep, % 8.3 ± 3 8.4 ± 3 8.1 ± 2.9 0.37
Stage 2 sleep, % 47.4 ± 9.3 47.9 ± 8.6 46.8 ± 10 0.28
Slow wave sleep, % 16.1 ± 6.6 16.6 ± 6.1 15.7 ± 7.1 0.19
REM sleep, % 16.6 ± 5.2 16.7 ± 4.9 16.5 ± 5.5 0.79
AHI-TST, events/hour of sleep 4.15 ± 2.4 4.7 ± 2.3 3.5 ± 2.4 0.000 AHI-N1, events/hour of sleep 6.2 ± 7.1 7.7 ± 7.8 4.6 ± 5.9 0.000 AHI-N2, events/hour of sleep 3.2 ± 2.9 4.2 ± 3.2 2.2 ± 2.1 0.000 AHI-REM, events/hour of sleep 9.7 ± 7.4 9.4 ± 6.7 10 ± 8 0.51
SaO2min, % 89.2 ± 4.2 88.5 ± 3.9 89.9 ± 4.5 0.004
by a technician, who assisted patients in under-standing the questions.
To assess EDS, we utilized ten variables that represented different putative dimensions of sleepiness. Four were parametric variables, and six were binary variables:
Parametric variables – • ESS score
• latency to stage 2(23) • sleep efficiency • years since EDS onset Binary variables –
• sleepiness as the chief complaint
• at least one comorbidity, such as depression,(24-26) diabetes,(24) or current
smoking(25)
• morning/afternoon sleepiness, as defined based on the answer to the question “At what time of day do you feel sleepiest?” (if the subject indicated any morning hour plus any afternoon hour, we classified this as morning/afternoon sleepiness)
• report of having fallen asleep after driving for 1 h or less
• report of having fallen asleep after working seated for 1 h or less
• insomnia as the chief complaint.(27)
Patients were classified as suffering from depression if meeting at least four of the criteria set forth in the Diagnostic and Statistical Manual of Mental Disorders, Fourth edition, or having been previously diagnosed or treated for depression. An ESS score > 10 was considered indicative of EDS.(28)
plethysmography (Respitrace; AMI, Ardsley, NY, USA) or by Respitrace plus a nasal cannula/pres-sure transducer system (EMSA; Rio de Janeiro, Brazil). Arousals were scored according to the criteria established by the American Academy of Sleep Medicine.(22) The AHI was calculated
sepa-rately for total sleep time (AHI-TST), REM sleep (AHI-REM), stage 1 NREM sleep (AHI-N1) and stage 2 NREM sleep (AHI-N2).
A translated (Brazilian Portuguese) version of the ESS was employed. The scale was reviewed
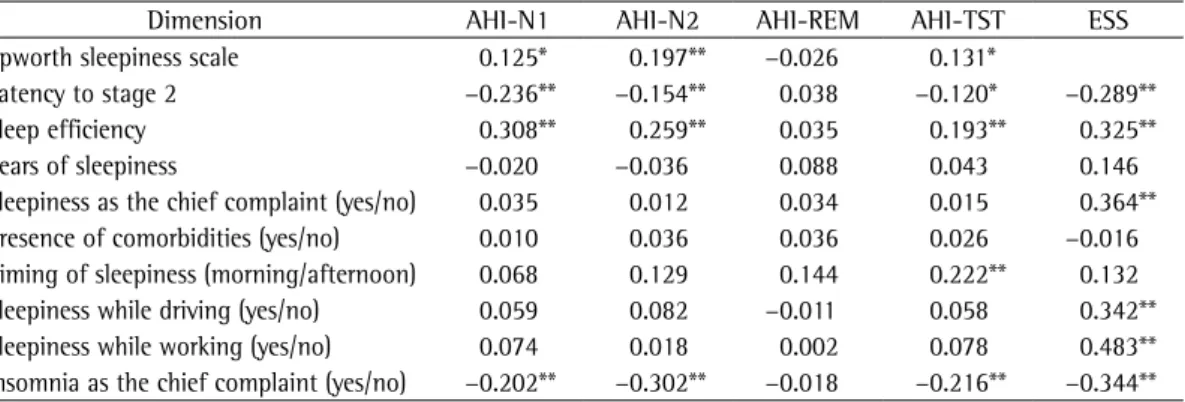
Table 2 - Nonparametric Spearman’s correlation coefficients of sleepiness dimensions with stage-specific apnea-hypopnea indices.
Dimension AHI-N1 AHI-N2 AHI-REM AHI-TST ESS
Epworth sleepiness scale 0.125* 0.197** −0.026 0.131*
Latency to stage 2 −0.236** −0.154** 0.038 −0.120* −0.289**
Sleep efficiency 0.308** 0.259** 0.035 0.193** 0.325**
Years of sleepiness −0.020 −0.036 0.088 0.043 0.146
Sleepiness as the chief complaint (yes/no) 0.035 0.012 0.034 0.015 0.364** Presence of comorbidities (yes/no) 0.010 0.036 0.036 0.026 −0.016 Timing of sleepiness (morning/afternoon) 0.068 0.129 0.144 0.222** 0.132
Sleepiness while driving (yes/no) 0.059 0.082 −0.011 0.058 0.342**
Sleepiness while working (yes/no) 0.074 0.018 0.002 0.078 0.483**
Insomnia as the chief complaint (yes/no) −0.202** −0.302** −0.018 −0.216** −0.344**
AHI-N1: apnea-hypopnea index during stage 1 sleep; AHI-N2: apnea-hypopnea index during stage 2 sleep; AHI-REM: apnea-hypopnea index during rapid eye movement sleep; AHI-TST: apnea-hypopnea index during total sleep time; and ESS: Epworth sleepiness scale. *Level of significance set at 0.05; and **Level of significance set at 0.01.
Table 3 - Structure matrix of factor analysis for seven dimensions of sleepiness.a
Factor Component
1 2 3
1. QUESTIONNAIRE
Sleepiness at work 0.830 Sleepiness while driving 0.802 Epworth sleepiness
scale score
0.701
2. POLYSOMNOGRAPHY
Sleep efficiency 0.869
Sleep urgency 0.846
3. COMPLAINTS
No insomnia −0.823
Sleepiness as chief
complaint −0.787
Cronbach’s alpha 0.7 0.68 0.55 Factor correlations 1. QUESTIONNAIRE
2. POLYSOMNOGRAPHY 0.194 3. COMPLAINTS −0.222 −0.223 aExtraction method: principal component analysis;
Results
In the present study, the mean BMI was higher among men than among women (25.9 ± 3 kg/m2 vs. 23.7 ± 3.9 kg/m2). Men also
more often reported snoring (25% vs. 15%) and were sleepier (ESS score = 10 ± 5 vs. 8 ± 4; p < 0.001). There were 113 patients (34%) with an ESS score > 10. An AHI-REM > 15 did not present a significant association with ESS score > 10 (χ2 = 0.61; p = 0.49).
The bivariate correlations of sleepiness dimensions with stage-specific AHIs and with ESS score are displayed in Table 2. The AHI-TST correlated significantly with four of the puta-tive dimensions of sleepiness, whereas the AHI-N1 correlated significantly with three, the AHI-N2correlated significantly with five, and the AHI-REM correlated significantly only with morning/afternoon sleepiness. The ESS score correlated significantly with six of the nine possible dimensions of sleepiness.
The receiver operating characteristic curve analysis of all AHIs for detecting an ESS score > 10 was significant only for the AHI-N2 (area under the curve = 0.6, p = 0.006), the best accuracy being obtained when the AHI-N2 cut-off value was 2.5 (sensitivity = 54%; specificity = 57%).
In the reliability analysis, three of the puta-tive sleepiness dimensions (years since EDS onset; comorbidities; and morning/afternoon Data are shown as means and standard
deviation. The statistical analysis was performed using the program Statistical Package for the Social Sciences, version 13.0 (SPSS Inc., Chicago, IL, USA). Due to their non-normal distribution, all data related to stage-specific AHIs and sleep efficiency were analyzed using Spearman’s nonparametric correlation test. For linear and logistic regressions, we utilized the square roots of the AHIs. Sleep efficiency also presented non-normal distribution and were therefore converted to a natural logarithm. A receiver operating characteristic curve analysis was used in order to identify an AHI cut-off point that would predict an ESS score > 10.
Chi-square test was used to compare non-parametric variables. To identify interre-lationships among the ten putative sleepiness variables, we employed reliability analysis. Because “sleep latency” and “insomnia as the chief complaint” were negatively correlated with sleepiness, we created the inverse vari-ables “sleep urgency” (1/sleep latency) and “no insomnia”.
To reduce the number of dimensions and to determine which dimensions assessed the same factor, we conducted a factor analysis using principal component analysis as the extraction method and an oblique method of rotation. The Kaiser-Meyer-Olkin measure was used in order to assess sampling adequacy.
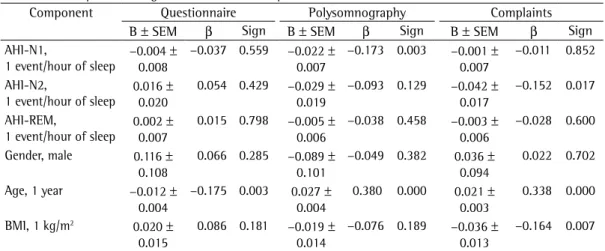
Table 4 - Multiple linear regression model for sleepiness factors.a
Component Questionnaire Polysomnography Complaints
B ± SEM β Sign B ± SEM β Sign B ± SEM β Sign
AHI-N1,
1 event/hour of sleep −0.004 0.008±
−0.037 0.559 −0.022 ±
0.007
−0.173 0.003 −0.001 ±
0.007
−0.011 0.852
AHI-N2,
1 event/hour of sleep 0.016 0.020±
0.054 0.429 −0.029 ±
0.019
−0.093 0.129 −0.042 ±
0.017
−0.152 0.017
AHI-REM,
1 event/hour of sleep 0.002 0.007±
0.015 0.798 −0.005 ±
0.006
−0.038 0.458 −0.003 ±
0.006
−0.028 0.600
Gender, male 0.116 ±
0.108
0.066 0.285 −0.089 ±
0.101
−0.049 0.382 0.036 ±
0.094
0.022 0.702
Age, 1 year −0.012 ±
0.004
−0.175 0.003 0.027 ±
0.004
0.380 0.000 0.021 ±
0.003
0.338 0.000
BMI, 1 kg/m2 0.020 ±
0.015
0.086 0.181 −0.019 ±
0.014
−0.076 0.189 −0.036 ±
0.013
−0.164 0.007
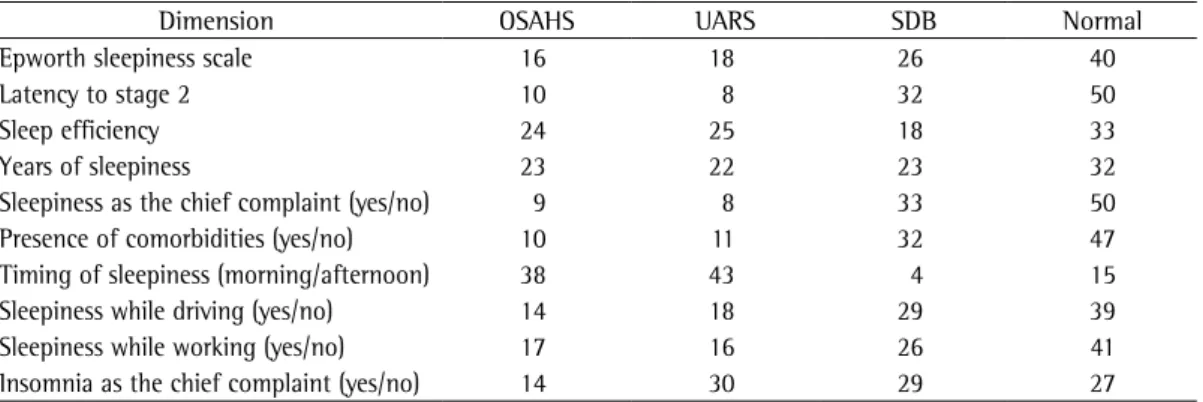
has on the diagnosis of OSAHS. Insomnia was identified based on a diagnostic criterion similar to that used in the identification of sleepiness. Morning/afternoon sleepiness was considered as positive for a diagnosis of OSAHS when it was more prominent in the morning. When utilizing the four parametric variables, sleep efficiency > 85%, latency to stage 2 < 10 min, ESS score > 10 and years since EDS onset > 4 were consid-ered indicative of sleepiness. Using the ten dimensions of sleepiness and the AHIs to define the four possible diagnoses (Table 5), we found that the percentage of cases with OSAHS ranged from 9% to 38%, compared with 8% to 43% for UARS, 4% to 33% for SDB and 15% to 50% for normal.
Discussion
The present study was conducted in order to determine whether a different approach would confirm the Kass et al. finding of an association between objective sleepiness and SDB during REM sleep.(8) We hypothesized that
subjective scales of sleepiness could provide new insights into this issue. However, our findings do not support the proposition that fragmen-tation of REM sleep might be more important than is overall sleep fragmentation in causing EDS, perhaps because our sample was consider-ably larger than that evaluated in the Kass et al. study (n = 331 vs. n = 34).(8)
The retrospective nature of the study could be considered a limitation, as could the fact that we employed indices of somnolence that are both subjective and speculative. Nevertheless, our findings are in agreement with those of two other large-scale studies,(9,10) in which
sleepiness) were excluded due to reasons that will be discussed below. The intraclass correla-tion coefficient was 0.254 (p < 0.001) and the standardized Cronbach’s alpha was 0.715, indi-cating that the seven remaining dimensions are measures of sleepiness.
A factor analysis was performed using the seven sleepiness dimensions included in the reliability analysis. Of the factors derived from those seven variables, three presented an eigen-value > 1 and were therefore included in the analyses. Those three factors explained 72% of the total sample variance. Correlations of the seven variables with each factor are shown in Table 3. The Kaiser-Meyer-Olkin statistic was 0.68, indicating good sampling adequacy. The first factor (QUESTIONNAIRE) correlated with the ESS dimensions “sleepiness at the wheel”, and “sleepiness at work”, with a Cronbach’s alpha of 0.7. The second factor (POLYSOMNOGRAPHY) correlated with the polysomnographic variables: “sleep urgency” (the inverse of latency to stage 2) and “sleep efficiency”, with a Cronbach’s alpha of 0.68. The third factor (COMPLAINTS) correlated with the clinical interview variables “sleepiness as the chief complaint” and “insomnia as the chief complaint”, with a Cronbach’s alpha of 0.55.
The results of the multivariate analysis are shown in Table 4. After adjusting for gender, age and BMI, we found that the AHI-N1 correlated significantly with the factor POLYSOMNOGRAPHY (β = −0.173, p = 0.003), the AHI-N2 correlated significantly with the factor COMPLAINTS (β = −0.152, p = 0.017), and the AHI-REM did not correlate with any factor.
We used 2 × 2 tables in order to determine the impact that changing the sleepiness dimension
Table 5 - Percentage of diagnoses obtained when using different dimensions of sleepiness.
Dimension OSAHS UARS SDB Normal
Epworth sleepiness scale 16 18 26 40
Latency to stage 2 10 8 32 50
Sleep efficiency 24 25 18 33
Years of sleepiness 23 22 23 32
Sleepiness as the chief complaint (yes/no) 9 8 33 50
Presence of comorbidities (yes/no) 10 11 32 47
Timing of sleepiness (morning/afternoon) 38 43 4 15
Sleepiness while driving (yes/no) 14 18 29 39
Sleepiness while working (yes/no) 17 16 26 41
Insomnia as the chief complaint (yes/no) 14 30 29 27
the women. Although depression is a known confounding factor, it was not found to corre-late with any of the sleepiness dimensions or with any of the AHIs in the univariate or the multivariate analysis.
In the most cited study in the sleep literature,(30) 9% of females and 24% of males
had a respiratory disturbance index > 5. Interestingly, only 2% of the women and 4% of the men reported EDS, a prevalence that is lower than that reported in most of the literature. This discrepancy is likely due to the non-vali-dated questions used by the authors to identify sleepiness. It would be interesting to investigate population data using different dimensions of sleepiness. In the present study, the percentage of patients diagnosed with OSAHS ranged from 9% to 38% when different indicators of EDS were used. One point to be considered, however, is that the Portuguese-language version of the ESS has not been formally validated. The use of a translation might have affected the psycho-metric properties of the scale and the use of the score of 10 as normal limit might therefore have been inappropriate. Despite this limitation, the ESS score has been shown to correlate signifi-cantly with the AHI in NREM sleep and in TST.
Our results provide additional insight into the relationship between sleepiness and the AHI in different sleep stages, suggesting that the AHI-REM is not associated with polysom-nographic or patient-reported dimensions of sleepiness.
References
1. Parati G, Lombardi C, Narkiewicz K. Sleep apnea: epidemiology, pathophysiology, and relation to cardiovascular risk. Am J Physiol Regul Integr Comp Physiol. 2007;293(4):R1671-83.
2. Germanowicz D, Lumertz MS, Martinez D, Margarites AF. Sleep disordered breathing concomitant with fibromyalgia syndrome. J Bras Pneumol. 2006;32(4):333-8. 3. George CF. Sleep apnea, alertness, and motor
vehicle crashes. Am J Respir Crit Care Med. 2007;176(10):954-6.
4. Viegas CA, de Oliveira HW. Prevalence of risk factors for obstructive sleep apnea syndrome in interstate bus drivers. J Bras Pneumol. 2006;32(2):144-9.
5. Martinez D. Obstructive sleep apnea: a contagious disease? J Bras Pneumol. 2006;32(2):ix-x.
6. Martins AB, Tufik S, Moura SM. Physiopathology of obstructive sleep apnea-hypopnea syndrome. J Bras Pneumol. 2007;33(1):93-100.
7. Weaver EM, Kapur V, Yueh B. Polysomnography vs self-reported measures in patients with sleep apnea. Arch Otolaryngol Head Neck Surg. 2004;130(4):453-8.
the AHI-REM was not identified as a cause of MSLT-proven EDS. One of those studies involved 342 patients with an AHI-TST < 10 and showed that the AHI-TST is significantly correlated with MSLT, whereas the AHI-REM is not.(9) This is
similar to our finding that five of the ten dimen-sions of sleepiness correlated significantly with the AHI-N1, AHI-N2 and AHI-TST, although not with the AHI-REM. The AHI in REM and NREM sleep correlated differently because we selected patients with an AHI-TST < 10 in order to facili-tate the comparison between our results and those of Kass et al. Most studies investigating SDB in REM vs. NREM sleep have utilized the full range of AHIs and are, therefore, non-com-parable with the present study that follows the unique methodology utilized by Kass et al.(8)
Our data reject the Kass et al. hypothesis that REM-specific SDB is an early or prodromal phase of OSAHS. In view of the numerous reports that the AHI-REM does not correlate with objective or subjective sleepiness, the possibility that SDB in REM sleep does not represent a disease state has to be considered. Various physiological insta-bilities are germane to the REM state. Breathing can be disordered in REM sleep as a reflex of this overall instability rather than of specific respi-ratory control abnormalities. This could explain why the AHI-REMis the only stage-specific AHI that did not correlate with any of the dimensions of sleepiness evaluated in the present study. However, the fact that the AHI-NREM correlated significantly with sleepiness in this initial stage of SDB indicates that EDS is one of the early manifestations of SDB.(12)
Our results show that some putative dimensions of sleepiness correlate with some stage-specific AHIs, although only a few of those correlations remained after being adjusted for gender, age, and BMI in the multivariate analysis. It is of note that we found no gender effect in sleepiness dimensions; nor did we find SDB clustering during REM sleep in women. Interestingly, in the present analysis, the only AHI that was found to be similar in men and women is AHI-REM (Table 1). All these findings are in contrast with those of previous reports.(17,29) This
manual. Westchester: American Academy of Sleep Medicine; 2005.
20. Braga CW, Martinez D, Wofchuk S, Portela LV, Souza DO. S100B and NSE serum levels in obstructive sleep apnea syndrome. Sleep Med. 2006;7(5):431-5. 21. Bittencourt LR, coordinator. Diagnóstico e tratamento
da síndrome da apnéia obstrutiva do sono (SAOS) - Guia prático. São Paulo: LMP; 2008.
22. Iber C, Ancoli-Israel S, Cheeson Jr A, Quan SF. The AASM Manual for the Scoring of Sleep and Associated Events: Rules, Terminology and Technical Specification. Westchester: American Academy of Sleep Medicine; 2007.
23. Chervin RD, Kraemer HC, Guilleminault C. Correlates of sleep latency on the multiple sleep latency test in a clinical population. Electroencephalogr Clin Neurophysiol. 1995;95(3):147-53.
24. Bixler EO, Vgontzas AN, Lin HM, Calhoun SL, Vela-Bueno A, Kales A. Excessive daytime sleepiness in a general population sample: the role of sleep apnea, age, obesity, diabetes, and depression. J Clin Endocrinol Metab. 2005;90(8):4510-5.
25. Chellappa SL, Araújo JF. Excessive daytime sleepiness in patients with depressive disorder. Rev Bras Psiquiatr. 2006;28(2):126-9.
26. Kjelsberg FN, Ruud EA, Stavem K. Predictors of symptoms of anxiety and depression in obstructive sleep apnea. Sleep Med. 2005;6(4):341-6.
27. Sanford SD, Lichstein KL, Durrence HH, Riedel BW, Taylor DJ, Bush AJ. The influence of age, gender, ethnicity, and insomnia on Epworth sleepiness scores: a normative US population. Sleep Med. 2006;7(4):319-26.
28. Johns MW. Sleepiness in different situations measured by the Epworth Sleepiness Scale. Sleep. 1994;17(8):703-10.
29. O’Connor C, Thornley KS, Hanly PJ. Gender differences in the polysomnographic features of obstructive sleep apnea. Am J Respir Crit Care Med. 2000;161(5):1465-72. 30. Young T, Palta M, Dempsey J, Skatrud J, Weber
S, Badr S. The occurrence of sleep-disordered breathing among middle-aged adults. N Engl J Med. 1993;328(17):1230-5.
8. Kass JE, Akers SM, Bartter TC, Pratter MR. Rapid-eye-movement-specific sleep-disordered breathing: a possible cause of excessive daytime sleepiness. Am J Respir Crit Care Med. 1996;154(1):167-9.
9. Chervin RD, Aldrich MS. The relation between multiple sleep latency test findings and the frequency of apneic events in REM and non-REM sleep. Chest. 1998;113(4):980-4.
10. Punjabi NM, Bandeen-Roche K, Marx JJ, Neubauer DN, Smith PL, Schwartz AR. The association between daytime sleepiness and sleep-disordered breathing in NREM and REM sleep. Sleep. 2002;25(3):307-14. 11. Bonnet MH. ACNS clinical controversy: MSLT and
MWT have limited clinical utility. J Clin Neurophysiol. 2006;23(1):50-8.
12. Guilleminault C, Stoohs R, Clerk A, Cetel M, Maistros P. A cause of excessive daytime sleepiness. The upper airway resistance syndrome. Chest. 1993;104(3):781-7. 13. Punjabi NM, O’hearn DJ, Neubauer DN, Nieto FJ,
Schwartz AR, Smith PL, et al. Modeling hypersomnolence in sleep-disordered breathing. A novel approach using survival analysis. Am J Respir Crit Care Med. 1999;159(6):1703-9.
14. Gottlieb DJ, Whitney CW, Bonekat WH, Iber C, James GD, Lebowitz M, et al. Relation of sleepiness to respiratory disturbance index: the Sleep Heart Health Study. Am J Respir Crit Care Med. 1999;159(2):502-7.
15. Johns MW. A new method for measuring daytime sleepiness: the Epworth sleepiness scale. Sleep. 1991;14(6):540-5.
16. Johns M. Rethinking the assessment of sleepiness. Sleep Med Rev. 1998;2(1):3-15.
17. Kim H, Young T. Subjective daytime sleepiness: dimensions and correlates in the general population. Sleep. 2005;28(5):625-34.
18. Sleep-related breathing disorders in adults: recommendations for syndrome definition and measurement techniques in clinical research. The Report of an American Academy of Sleep Medicine Task Force. Sleep. 1999;22(5):667-89.
19. American Academy of Sleep Medicine. The international classification of sleep disorders diagnostic and coding
About the authors
Denis Martinez
Associate Professor in the Department of Internal Medicine. Universidade Federal do Rio Grande do Sul – UFRGS, Federal University of Rio Grande do Sul – Porto Alegre, Brazil.
Magali Santos Lumertz
Resident in Pediatrics. Hospital Santo Antonio, Porto Alegre, Brazil.
Maria do Carmo Sfreddo Lenz