ABSTRACT:Introduction: The global tobacco epidemic has taken pandemic proportions, with about 1.3 billion users and 6 million annual deaths. This study aimed to analyze the trends in mortality from chronic obstructive pulmonary disease (COPD) and lung, lips, oral cavity, pharynx, and esophagus cancer in Brazil between 1990 and 2015. Methods: The study was made possible through a partnership between the Metrics and Health Assessment Institute (IHME), University of Washington, Ministry of Health and the GBD Brazil technical group, using estimates from the Global Disease Charge 2015 study. Results: The mortality rates due to COPD fell; in 1990, it was 64.5/100,000 inhabitants and in 2015, 44.5, a decrease of 31%. For the various types of cancer related to smoking, the decrease was in a lower proportion than for COPD. For lung cancer, rates were 18.7/100,000 inhabitants in 1990 to 18.3 in 2015. For women, there is an upward curve for lung cancer from 1990 to 2015, with an increase of 20.7%. Discussion: The study points to smoking as a risk factor for premature mortality and disability due to COPD and cancer. The signiicant reduction in tobacco prevalence in recent decades could explain reductions in tobacco-related disease trends. The higher mortality from lung cancer in women may express the delayed increase in smoking in this gender. Conclusion: Nationwide actions taken in the last decades have had a great efect on reducing mortality from tobacco-related diseases, but there are still major challenges, especially when it comes to women and young people.
Keywords: Mortality. Tobacco. Pulmonary disease, Chronic Obstrutive. Neoplasms.
Mortality and disability from tobacco-related
diseases in Brazil, 1990 to 2015
Mortalidade e incapacidade por doenças relacionadas
à exposição ao tabaco no Brasil, 1990 a 2015
Bruno Piassi de São JoséI, Ricardo de Amorim CorrêaII, Deborah Carvalho MaltaIII,
Valéria Maria de Azeredo PassosII, Elisabeth Barboza FrançaIV,
Renato Azeredo TeixeiraV, Paulo Augusto Moreira CamargosVI
ISchool of Medicine, Graduate Program in Infectology and Tropical Medicine, Universidade Federal de Minas Gerais – Belo Horizonte (MG), Brazil.
IIDepartment of Clinical Medicine, School of Medicine, Graduate Program in Infectology and Tropical Medicine, Universidade Federal de Minas Gerais – Belo Horizonte (MG), Brazil.
IIIDepartment of Maternal and Child Nursing, School of Nursing, Universidade Federal de Minas Gerais – Belo Horizonte (MG), Brazil.
IVSchool of Medicine, Graduate Program in Public Health, Universidade Federal de Minas Gerais – Belo Horizonte (MG), Brazil. VResearch Group on Epidemiology and Service Evaluation, Universidade Federal de Minas Gerais – Belo Horizonte (MG), Brazil.
VIDepartment of Pediatrics, School of Medicine, Universidade Federal de Minas Gerais – Belo Horizonte (MG), Brazil.
Corresponding author: Bruno Piassi de São José. Universidade Federal de Minas Gerais, Faculdade de Medicina. Programa de Pós-Graduação de Infectologia e Medicina Tropical. Avenida Professor Alfredo Balena, 190, Santa Eigênia, CEP: 30130-100, Belo Horizonte, MG, Brasil. E-mail: [email protected]
Conlict of interests: nothing to declare – Financial support: Bill & Melinda Gates Foundation (GBD Global) and Ministry of Health (GBD 2015 Brazil-states), through the National Health Fund (Process No. 25000192049/2014-14).
José, B.P.s. et al.
INTRODUCTION
Tobacco originated in Latin America and began to spread throughout the world soon after its discovery. The sailors in the first caravels were already smokers. Over the next few centuries, the habit of smoking proliferated throughout Europe and tobacco became an “as valuable as gold” coin. It was unknown at the time that it was the dead-liest of spices. From that period, when Brazil supplied tobacco to European courts, the tobacco leaf remained on the coat of arms of the Federative Republic of Brazil. What also remained was a habit that causes thousands of deaths and great economic cost for
the Brazilian State1.
The global tobacco epidemic has taken pandemic proportions, with about 1.3 billion users and 6 million annual deaths. It involves substantial health care and economic and social costs in all countries. Health risks stem from both direct smoking and passive
expo-sure to tobacco2.
Smoking has inluenced and inluences mortality in the world. A good example is the mortality rate from lung, trachea, and bronchial cancer, which, in the last century, has evolved in an upward curve in the United States. In 1930, it was 4.0/100,000, reaching
20 times higher levels in 19903.
Tobacco contains carcinogenic substances and its use predisposes to various types of
cancer, as well as heart disease, hypertension, and other conditions4-6. Global estimates
suggest that smoking accounts for 71% of lung cancer deaths, 42% of chronic respiratory
RESUMO:Introdução: A epidemia global do tabaco já assumiu proporções de pandemia, com cerca de 1,3 bilhão de usuários e 6 milhões de mortes anuais. Objetivo: Este trabalho teve como objetivo analisar as tendências de mortalidade por doença pulmonar obstrutiva crônica (DPOC) e câncer de pulmão, lábios, cavidade oral, faringe e esôfago, no Brasil, entre 1990 e 2015.Métodos:O estudo foi viabilizado mediante parceria entre o Instituto Métricas e Avaliação em Saúde (IHME), da Universidade de Washington, Ministério da Saúde e o grupo técnico GBD Brasil, utilizando análise de estimativas do estudo Carga Global de Doenças 2015. Resultados: As taxas de mortalidade por DPOC caíram, já que, em 1990, foi de 64,5/100.000 habitantes e, em 2015, 44,5, queda de 31%. Para os vários tipos de câncer relacionados ao tabaco, a queda foi em menor proporção do que a veriicada para DPOC. A mortalidade por câncer de pulmão permaneceu estável, com taxa de 18,7/100.000 habitantes, em 1990, e 18,3/100.000 habitantes, em 2015. Entre as mulheres, observa-se curva ascendente, com aumento de 20,7%.
Discussão: O estudo aponta o tabaco como fator de risco para mortalidade prematura e incapacidades por DPOC e câncer. A importante redução da prevalência do tabaco nas últimas décadas poderia explicar reduções nas tendências de doenças relacionadas com o tabaco. A maior mortalidade por câncer de pulmão em mulheres pode expressar o aumento tardio do tabagismo nesse sexo. Conclusão: Ações nacionais nas últimas décadas têm tido grande efeito na diminuição da mortalidade de doenças relacionadas ao tabaco, mas ainda há grandes desaios, principalmente quando se trata de mulheres e jovens.
diseases, and nearly 10% of cardiovascular diseases worldwide, as well as being a risk factor
for communicable diseases, such as tuberculosis7. The World Health Organization (WHO)
projected that tobacco-related deaths will increase to about 8 million by 2030, or 10% of
global deaths, if no measures are taken to control it4-7.
In 2014, among the 10 leading causes of death in the world responsible for half the deaths, smoking is directly related to 80% of these deaths; ischemic heart disease (irst place in the classiication), stroke (second place), chronic obstructive pulmonary disease (COPD) (third place), lower respiratory tract infections (fourth place), lung, or tracheal
cancer (ifth place)8.
In Brazil, the reality is similar: in 2015, smoking is related to about half of the 10 main causes of death: ischemic heart disease (14.9%), neoplasias (17.4%), and
cerebro-vascular diseases including systemic arterial hypertension (12.4%) and COPD (5.3%)9.
In contrast, the prevalence of smoking has been declining significantly, from the imple-mentation of stricter legislation to anti-smoking campaigns. In 1989, 34.8% of the
pop-ulation aged over 18 years were smokers10.There has been a significant drop in the last
decade, with a prevalence of approximately 10.5% in Brazilian capitals11. Studies have
attributed these achievements to the country’s leadership in the subject, promoting
educational, preventive actions, as well as regulatory actions12-15. It is known, however,
that the impact of the lowering prevalence will reflect on mortality rates in the next
three to four decades16.
This study aimed to analyze the trends in mortality due to COPD and lung, lips, oral cavity, pharynx, and esophagus cancer, both with higher risk of death attributable to
smok-ing in Brazil between 1990 and 201517.
METHODS
This study was made possible through a partnership between Instituto Métricas e Avaliação
em Saúde (IHME), University of Washington, United States, the Brazilian Ministry of Health and the GBD Brazil technical group, using analysis of the estimates of the Global Burden of Disease 2015 study.
The methodology of GBD is described in other publications, and updates procedures
and conceptual principles since the irst publication and others subsequent to it18. The
bur-den of disease was estimated according to the IHME method in 2015, with results accessed
on its webpage19. GBD 2015 used data available on causes of death in 195 countries,
includ-ing data for Brazil and 27 Federative Units20-22.
The main source of mortality data in Brazil was the death registration database of the
Ministry of Health’s Mortality Information System (SIM)23, after adjustments by other
José, B.P.s. et al.
have been previously described24. Later, data modeling was performed to estimate data by
age, sex, country, year, and cause. Cause of Death Ensemble Modeling-CODEm (CODEm) is a software that tests a variety of possible statistical models of causes of death and creates a combined set of models that provides the best predictive performance. DisMod-MR 2.1 software was used to calculate simultaneous estimates of incidence, prevalence, remission,
disability, and mortality25,26.
In this study, the mortality rates and years of life lost (YLL) due to death or disability, or the disability-adjusted life years (DALYs), were used as the metric. DALYs is a composite indicator that integrates premature death (YLL) and damage caused by disease, sequelae, or disability, considering diferent levels of severity of one or more diseases at the same time (years lost due to disability – YLD). This indicator considers the burden of lethal and non-lethal diseases to be equivalent.
In the GBD study, 95% uncertainty intervals (95%UI) are calculated, which provide infor-mation on the variability of estimates resulting from errors due to the sampling process,
and also non-sample errors due to adjustments of data sources and modeling17.
This study analyzed conditions that present a high-risk attributable to smoking: COPD (códigos CID 10 J40-J44.9, J47-J47.9), lung, trachea, and bronchial cancer (C33-C34.92, D02.1-D02.3, D14.2-D14.32, D38.1), esophageal cancer (C15-C15.9, D00.1, D13.0), lip and oral cavity cancer (C0-C08.9, D00.00-D00.07, D10.0-D10.5, D11-D11.9, D37.01-D37.04, D37.09), nasopharyngeal cancer (C11-C11.9, D00.08, D10.6, D37.05), and other types of
pharyngeal cancer (C09-C10.9, C12-C13.9, D10.7)17.
The analyses presented are listed below:
1. Comparisons of the attributable risk of DALY related to active and passive smoking
in 1990 and 2015;
2. Comparisons of mortality rates for these diseases and the percentage of change
between 1990 and 2015;
3. Analysis of trends in standardized rates of mortality, by sex and by age group, for
the world and Brazil, between 1990 and 2015, for the following causes: COPD, lung, trachea, and bronchial cancer; esophageal cancer; lip and oral cavity cancer; nasopharyngeal cancer; and other types of pharyngeal cancer;
4. We also calculated trend analyzes for age-standardized DALYS, by sex, between 1990
and 2015, in the world and in Brazil, for COPD and cancer.
The Global Disease Burden Study - GDB Brasil 2015 was approved by the Research Ethics Committee of Universidade Federal de Minas Gerais (CAAE Project - 62803316.7.0000.5149).
RESULTS
COPD (1.3% of DALYs), and cancer (1.3% of DALYs). The same causes are found in rela-tion to passive exposure to tobacco.
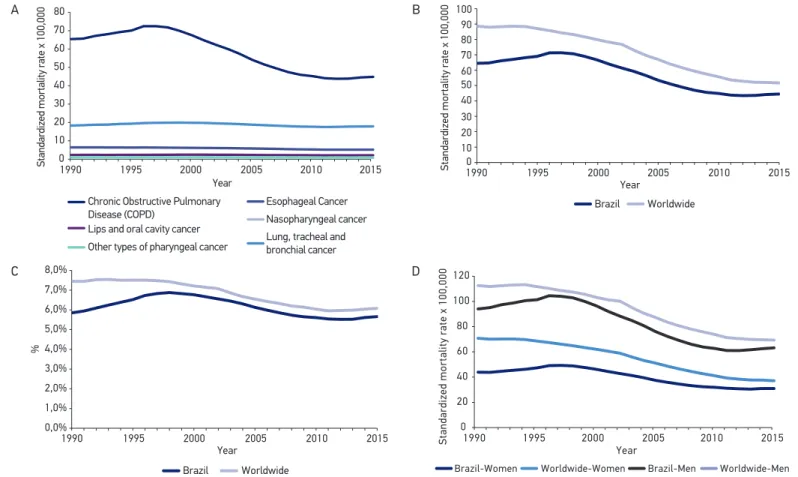
The age-standardized mortality rates for the main tobacco-related death causes and the percentage changes between 1990 and 2015 are shown in Table 1. Figure 2A shows the evo-lution of curves related to the same diseases in Brazil in the 25 years covered by this study.
Table 1. Mortality rate standardized by age for causes of death and percentage change ((2015–1990)/1990), for Brazil, both sexes and by sex. Brazil, 1990 and 2015.
Cause of death per 100,000 inhabitants
Brazil Male Female
1990 2015 Diff erence
% 1990 2015
Diff erence
% 1990 2015
Diff erence %
Chronic obstructive pulmonary disease (COPD)
64.5 44.5 -31.0 94.9 63.9 -32.6 44.5 31.5 -29.2
Lung, tracheal and
bronchial cancer 18.7 18.3 -2.1 29.5 25.9 -12.0 10.6 12.8 20.7
Lips and oral
cavity cancer 2.8 2.7 -5.2 4.7 4.4 -6.4 1.3 1.3 -2.1
Nasopharyngeal
cancer 0.2 0.3 16.9 0.3 0.4 24.1 0.2 0.2 5.4
Other types of
pharyngeal cancer 1.9 1.8 -5.0 3.4 3.3 -2.8 0.6 0.5 -16.0
Esophageal cancer 7.2 6.0 -17.2 12.2 10.5 -14.1 3.3 2.4 -26.8
Figure 1. Standardized rates of DALYs attributable to active and passive smoking in Brazil in 2015.
DALY per 100.000 Smoker
Second-hand smoker
Cardiovascular diseases
Diabetes, urogenital, blood and endocrine diseases Digestive diseases
Neoplasms
Chronic respiratory diseases
Diarrhea, lower respiratory tract infection and other common infectious diseases
HIV/AIDS and tuberculosis
JosÉ, B.p.s. et al.
Figure 2. A) Curves of standardized mortality rate for tobacco-related diseases, for both sexes, in Brazil, between 1990 and 2015. http:// ghdx.healthdata.org/gbd-results-tool?params=querytool-permalink/6e9ff e8afef4e23a38f5f208f5e818d7; B) Curves of the age-standardized mortality rate for COPD, for both sexes, worldwide and in Brazil, between 1990 and 2015. http://ghdx.healthdata.org/gbd-results-tool?params=querytool-permalink/881bf39da47b7b2deacbe205c042a2ea; C) Proportional mortality curves for COPD, for both sexes, worldwide in Brazil, between 1990 and 2015. http://ghdx.healthdata.org/gbd-results-tool?params=querytool-permalink/881bf39da47b7 b2deacbe205c042a2ea; D) Proportional mortality curves for COPD, by sex, worldwide and in Brazil, between 1990 and 2015. http://ghdx. healthdata.org/gbd-results-tool?params=querytool-permalink/fa99f9bf49e901100837d660d0102184.
Standardized mortality rate x 100,000
Chronic Obstructive Pulmonary Disease (COPD)
Esophageal Cancer
Lips and oral cavity cancer Nasopharyngeal cancer Other types of pharyngeal cancer Lung, tracheal and bronchial cancer 80
70 60
50 40 30
20 10
0
1990 1995 2000 2005 2010 2015 Year
Standardized mortality rate x 100,000
100 90 80 70 60 50 40 30 20 10 0
1990 1995 2000 2005 2010 2015 Year
Brazil Worldwide
0,0%
1990 1995 2000 Year
Brazil Worldwide
2005 2010 2015 1,0%
2,0% 3,0% 4,0% 5,0% 6,0% 7,0% 8,0%
%
0 1990
Brazil-Women Worldwide-Women Brazil-Men Worldwide-Men
1995 2000 2005 2010 2015
20 40 60 80 100 120
Standardized mortality rate x 100,000
Year
A B
Death rates standardized by the age of COPD have decreased worldwide. The overall rate in 1990 was 88.6/100,000 (95%UI 93.6 – 83.5) and 51.6/100,000 (95%UI 53.3 – 50.0) in 2015, showing a decrease of 42% (both sexes standardized by age). In Brazil, in 1990, the rate for both sexes was 64.5/100,000 inhabitants (95%UI 66.3 – 62.4) and, in 2015, 44.5/100,000 inhabitants (95%UI 47.0 – 42.3), a decrease of about 31% (Figure 2B).
Mortality due to COPD accounted for 7.4% (95%UI 7.0 – 7.9) of all causes of death in the world in 1990, and, in 2015, 6.0% (95%UI 6.3 – 5.9) with a decrease of 19%. In Brazil, this decrease was lower (3.3%), from 5.8% (5.9 – 5.7) of all deaths in 1990, to 5.5% (5.9 – 5.5), in 2015 (Figure 2C).
When observing a mortality curve for COPD in the last 25 years, in Brazil, there is an upward curve from 1990 to the end of 1997, reaching a rate of 71.3/100,000 inhabitants (95%UI 73.3 – 69.0 ), from a rate of 43.4/100,000 inhabitants (95%UI 45.7 – 41.9) and a growth trend in recent years. The same behavior is observed in the percentage of death curves, with a higher tendency of increase in the last years after reaching a minimum percentage of 5.5% in 2012 (Figure 2B and Figure 2C). When veriied separately by sex, there was a decrease in the rate in both, with a larger decrease for men (from 94.9/100,000 inhabitants to 63.9, 32.6%) in relation to women (from 44.5/100,000 inhabitants to 31.5, 29.2%) (Figure 2).
Figure 3A and Figure 3B show the evolution of mortality by sex and by age group. In the case of women, a peak of mortality is observed in the late 1990s in the highest age groups, from 75 to 79 and over 80 years. Likewise, the mortality rate in men peaked at the same time and in the same age groups, but with values approaching twice the rate of women, about 2,300/100,000 inhabitants in the late 1990s, in the age groups above 80 years.
The DALY for COPD decreased globally and in Brazil. The diference is that the decrease in Brazil from 1,099 to 702/100,000 inhabitants (36.1%) was lower than that observed
glob-ally, from 1,724 to 971/100,000 inhabitants (43.7%)27.
cancer
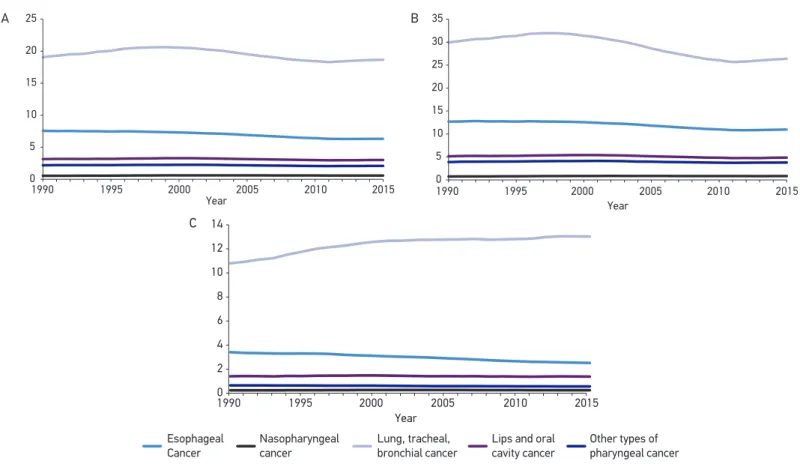
There was a decline in the mortality rate for the various types of cancer related to smok-ing, in a lower proportion than the decrease observed for COPD. Tracheal, bronchial, and lung cancer accounted for 1.7% (1.7% – 1.6%) and 2.3% (2.4% – 2.2%) of deaths in Brazil in 1990 and 2015, respectively. There was a decline of 2.1% in mortality rates — 18.7/100,000 (95%UI 19.2 – 18.1), in 1990, to 18.3/100,000 inhabitants (95%UI 19.4 – 17.3) in 2015.
JosÉ, B.p.s. et al.
Figure 3. A) Brazil’s mortality rate curve, between 1990 and 2015, for males, by age group, for COPD. http://ghdx.healthdata.org/gbd-results-tool?params=querytool-permalink/870c090f5ba e86dd2414eac6c10e93f6; B) Brazil’s mortality rate curve, between 1990 and 2015, for females, by age group, for COPD. http://ghdx.healthdata.org/gbd-results-tool?params=querytool-perm alink/57f02b378e5d96ad1f4c7c8f52a753e4.
A
0
1990 1995 2000
Year
2005 2010 2015
500 1000 1500 2000 2500
Standardized mortality rate x 100,000
B
0 200 400 600 800 1000 1200
Standardized mortality rate x 100,000
1990 1995 2000
Year
2005 2010 2015
40-44 45-49 50-54 55-59
60-64 65-69 70-74 75-79
decrease, all three categories increased in percentage in relation to the other causes of death, in the total mortality rate — oral cavity and lip cancer, from 0.26% to 0.34%; nasopharyngeal cancer, from 0.20% to 0.03%; and other types of pharyngeal cancer, from 0.17% to 0.20%. For women, there is an upward trend in mortality from lung, bronchial, and tracheal cancer from 1990 to 2015, with respective rates of 10.6/100,000 and 12.8/100,000 inhabitants — an increase of 20.7%, showing stability or decrease in mortality from other types of cancer. In men, mortality from lung, bronchial and tra-cheal cancer declined in the years between 1990 and 2010, 29.4/100,000 inhabitants to 25.5/100,000 inhabitants. In the last five years, this mortality rate has shown stability, since 2015 presented the same rate of 2010. Other cancers also showed a decrease or stability in the last 25 years (Figure 4A, Figure 4B, and Figure 4C).
The behavior of the DALY curve for tobacco-related forms of cancer is very similar to
that of the mortality curve27.
DISCUSSION
The study indicates smoking as a risk factor for premature mortality and disability due to cardiovascular diseases, COPD and cancer, among others. The signiicant reduction in the prevalence of tobacco in the last decades, as high as 70%, and consequently the lower exposure to tobacco, could explain reductions in the mortality trends of tobacco-related diseases. The decline in mortality was of approximately one third for COPD in the period studied, but, on the other hand, this rate has been showing a new upward trend in the last three years. New temporal analyses, to be conducted in the future, are needed to deter-mine whether the positive inlection in the COPD mortality curve over the last three years represents a real upward trend.
In relation to tobacco-related cancers, the decline is much less signiicant. Lung, tracheal, and bronchial cancer in women show a steady increase in the last 25 years, difering from the curve for men and those that show other conditions associated with smoking. As underdiag-nosis and underreporting are less common in cancer in relation to COPD, with the prevalence
of smoking decreasing, there is a tendency for these rates to decline in the coming decades16.
cOPD
Among the six leading causes of death related to tobacco, COPD is the irst of which, despite a sharp drop in the last 25 years, is still responsible for more deaths than all forms of tobacco-related cancer combined.
Despite the decline, in recent years, COPD has been rising in the general classiication of deaths in the world and in Brazil. It ranked sixth among all causes of death in 1990, and
JosÉ, B.p.s. et al.
Figure 4. A) Age-standardized mortality rate curve in Brazil between 1990 and 2015, for both sexes, for lung, tracheal and bronchial cancer; esophageal cancer; lip and oral cavity cancer; nasopharyngeal cancer; and other types of pharyngeal cancer. http://ghdx. healthdata.org/gbd-results-tool?params=querytool-permalink/31683ad84a092e4fd2c7d06e88200b7d; B) Age-standardized mortality rate curve in Brazil between 1990 and 2015, for males, lung, tracheal and bronchial cancer; esophageal cancer; lip and oral cavity cancer; nasopharyngeal cancer; and other types of pharyngeal cancer. http://ghdx.healthdata.org/gbd-results-tool?params=querytool-permalink/a58638aa059a98095daae3e577ba4df9; C) Age-standardized mortality rate curve in Brazil, between 1990 and 2015, for females, lung, tracheal and bronchial cancer; esophageal cancer; lip and oral cavity cancer; nasopharyngeal cancer; and other types of pharyngeal cancer. http://ghdx.healthdata.org/gbd-results-tool?params=querytool-permalink/66b81701010adec3423b3bd0f30f5ae9.
0 5 10 15 20 25
Year
1990 1995 2000 2005 2010 2015 0
5 10 15 20 25 30 35
Year
1990 1995 2000 2005 2010 2015
0 2 4 6 8 10 12 14
Year
1990 1995 2000 2005 2010 2015
Esophageal Cancer
Lips and oral cavity cancer Nasopharyngeal
cancer
Other types of pharyngeal cancer Lung, tracheal,
bronchial cancer
A B
Importantly, the increased mortality curve for tobacco-related diseases (or, in other words, smoking-attributable mortality) often occurs after three to four decades in the corresponding increase in smoking prevalence. According to Lopez et al., who described the different stages of the smoking epidemic, the decrease in the mortality curve for COPD, which coincides with that of a decline in the prevalence of smoking, should
begin some years after the onset of the prevalence decline16. This fact may suggest a
decrease in the underdiagnosis of COPD and an increase in reporting, which could justify a drop in the mortality curve earlier than expected. Although the underdiag-nosis of COPD is a well-known fact, there are not yet studies that show its evolution
in the last years29.
As most smokers (70–80%) start smoking before adulthood, smoking is currently considered a pediatric disease and should therefore be part of the overall care of
the child and adolescent30. A study published recently in Brazil, involving students
aged 13–14 years, showed that cigarette experimentation in this group was of 9.6%31.
The results of the National School Health Survey (PeNSE 2015), conducted with 9th grade students, showed that cigarette experimentation was of 18.4%, with the high-est frequency of experimentation observed in the south region (24.9%) and the low-est frequency in the northeast region (14.2%) and 5.6% in the prevalence of regular
smoking in the last 30 days32. Even with the decline in the prevalence of smoking in
Brazil, currently, about 11% of adults are smokers. Thus, it is necessary to maintain the set of public policies to combat tobacco, so that growth does not resume,
espe-cially among adolescents10.
The decrease in the prevalence of smoking in women occurs more slowly than among men. The decrease in the mortality rate in the last 25 years was also lower among women
(29.2%) than men (32.6%)10,33-36. Women and adolescents are the two groups that deserve
greater attention from government actions.
Despite the decline in the mortality rate, worldwide and in Brazil, the DALY in Brazil (36.1%) is lower than the worldwide (43.7%), and it has higher rates than the global ones.
It is known that the low availability of spirometry throughout the country — the essen-tial tool for the deinitive diagnosis — and the low awareness of general practitioners and physicians can contribute to the underdiagnosis of COPD and its consequences, as well as
the non-recognition of COPD as the true cause of death29,37.
cancer
José, B.P.s. et al.
other risk factors for these cancers, mainly alcohol use. Conversely, there was an increase
in nasopharyngeal cancer mortality in 17% (0.2 – 0.3)38.
With population aging and the reduction in mortality due to infectious diseases, demo-graphic and epidemiological transition, it is observed that despite the decrease in mortal-ity rates, all types of tobacco-related cancers have risen in the rank among all causes of death, presenting a greater importance among the main causes of death in Brazil. Lung, bronchial and tracheal cancer represented 1.7 and 2.3% of deaths, respectively, with an increase of 37%; esophageal cancer jumped from 0.66% to 0.76%, that is, an increase of 16%; lip and oral cavity cancer went from 0.26% to 0.34%, with an increase of 33%; naso-pharyngeal cancer, from 0.02% to 0.03%, with a 64% increase; and other types of pha-ryngeal cancer, from 0.17% to 0.22%, corresponding to a 33% increase over the 25-year period studied.
In the last five years, the mortality rate from lung, trachea, and bronchial cancer has been stabilizing, as it was 18.2% in 2009 and 18.3% in 2015 (for both sexes and standard-ized by age). In relation to women, there has been a continuous increase in mortality due to lung, trachea and bronchial cancer in the last 25 years, probably reflecting the
increase in smoking in previous decades, differing from the other diseases analyzed39.
The stabilization of smoking prevalence rates among women and the rate of experi-mentation and subsequent dependence on adolescents may contribute to a new growth in the trend, and these are challenges to be faced by the country, aiming at reducing the burden of these diseases.
TOBaccO anD PUBLIc POLIcIeS
Brazil is a worldwide example in the adoption of policies to ight smoking. A compar-ative study, published in 2012, showed that Brazil had the lowest prevalence of this condi-tion among 16 countries — including China, Russia, Thailand, Bangladesh, Egypt, India,
Mexico, Philippines, Poland, Turkey, Vietnam, and others40.
This is a result of the implementation of cost-efective measures recommended by WHO, such as
• increase of taxes and prices on tobacco products;
• a ban on smoking in public places;
• the inclusion of warnings on the dangers of tobacco consumption and the prohibition
of tobacco advertising, sponsorship and promotion41.
There is ample legislation regulating tobacco products, which was consolidated through
Brazilian Law No. 12.546/201142, on tobacco-free environments, which also expanded tobacco
1. Araújo JA. Manual de condutas e práticas em tabagismo. São Paulo: Ac Farmacêutica; 2012.
2. Asma S, Mackay J, Song SY, Zhao L, Morton J, Palipudi KM, et al. The GATS Atlas. Atlanta: CDC Foundation; 2015. Disponível em: www.gatsatlas.org/ (Acessado em: 7 de janeiro de 2017).
3. Jemal A, Siegel R, Ward E, Murray T, Xu J, Thun MJ. Cancer Statistics, 2007. CA Cancer J Clin 2007; 57(1): 43-66.
4. World Health Organization (WHO). Global status report on noncommunicable diseases 2010. Geneva: World Health Organization; 2011. 176p. Disponível em: http://www.who.int/nmh/publications/ncd_ report2010/en/ (Acessado em: 7 de janeiro de 2017).
5. World Health Organization (WHO). Preventing chronic diseases: a vital investment. Geneva: World Health Organization; 2005. Disponível em: www.who. int/chp/chronic_disease_report/en/ (Acessado em: 7 de janeiro de 2017).
6. World Health Organization (WHO). WHO report on the global tobacco epidemic, 2013. Enforcing bans on tobacco advertising, promotion and sponsorship. Geneva: World Health Organization; 2013. Disponível em: http://apps.who.int/iris/ bitstream/10665/85380/1/9789241505871_eng. pdf ?ua=1 (Acessado em: 7 de janeiro de 2017).
7. World Health Organization (WHO). Global health risks: mortality and burden of disease attributable to selected major risks. Geneva: World Health Organization; 2009. Disponível em: http://www. who.int/healthinfo/global_burden_disease/ GlobalHealthRisks_report_full.pdf (Acessado em: 7 de janeiro de 2017).
8. World Health Organization (WHO). The top 10 causes of death. 2014 May. Disponível em: http:// www.who.int/mediacentre/factsheets/fs310/en/ index.html (Acessado em: 20 de novembro de 2016).
REFERENCES
space occupied by health warnings43. Thus, all the best available evidence was implemented
in the country. Another factor that improved the governance of actions was Brazil’s acces-sion to the 2005 Framework Convention on Tobacco Control.
In addition, Brazil has set as a goal, in the Strategic Action Plan for Coping with DCNT 2011-2022 and in the Global Plan of DCNT, to reduce smoking in the country by 30%
in a decade44-46.
This study is conducted by the GBD 2015 database and is the irst to extract mortality data on tobacco-related diseases. The data presented in this study can be used for planning government actions and for future studies, for example, on the economic impact of the morbidity and mortality of tobacco-related diseases.
CONCLUSION
It is known that smoking has taken the proportion of a worldwide pandemic2. It is the
leading cause of preventable death worldwide according to the WHO47. National actions
in recent decades have had a major effect on reducing mortality, but mortality remains unacceptable. There are still major challenges, especially when it comes to women
and young people. The targeting of global actions by WHO, such as MPOWER48 and
Plain packaging of tobacco products49, can help Brazil and other countries reduce the
José, B.P.s. et al.
9. Institute for Health Metrics and Evaluation (IHME). GBD Compare | Viz Hub. Disponível em http:// ihmeuw.org/3zmr (Acessado em: 7 de janeiro de 2017).
10. Brasil. Ministério da Saúde. Secretaria de Vigilância em Saúde. Vigitel Brasil 2013: vigilância de fatores de risco e proteção para doenças crônicas por inquérito telefônico. Brasília: Ministério da Saúde; 2014. 120p. (Série G. Estatística e Informação em Saúde).
11. Observatório da Política Nacional de Controle do Tabaco. Prevalência de tabagismo. 2016. Disponível em: http://www2.inca.gov.br/wps/wcm/connect/ observatorio_controle_tabaco/site/home/dados_ numeros/prevalencia-de-tabagismo (Acessado em: 20 de novembro de 2016).
12. Monteiro CA, Cavalcante TM, Moura EC, Claro RM, Szwarcwald CL. Population-based evidence of a strong decline in the prevalence of smokers in Brazil (1989-2003). Bulletin of the World Health Organization 2007; 85(7): 527-34.
13. Instituto Brasileiro de Geograia e Estatística. Pesquisa Especial de Tabagismo (PETab). Rio de Janeiro: Instituto Brasileiro de Geograia e Estatística; 2008. Disponível em: http://bvsms.saude.gov.br/bvs/publicacoes/ pesquisa_especial_tabagismo_petab.pdf (Acessado em: 7 de janeiro de 2017).
14. Almeida L, Szklo A, Sampaio M, Souza M, Martins LF, Szklo M, et al. Global adult tobacco survey data as a tool to monitor the WHO Framework Convention on Tobacco Control (WHO FCTC) Implementation: The Brazilian Case. Int J Environ Res Public Health 2012; 9(7): 2520-36.
15. Malta DC, Iser BPM, Sá NNB de, Yokota RT de C, Moura L de, Claro RM, et al. Trends in tobacco consumption from 2006 to 2011 in Brazilian capitals according to the VIGITEL survey. Cad Saúde Pública 2013 Apr; 29(4): 812-22.
16. Lopez AD, Collishaw NE, Piha T. A descriptive model of the cigarette epidemic in developed countries. Tob Control 1994 Sep; 3(3): 242-7.
17. GBD 2015 Mortality and causes of death collaborators. Global, regional, and national life expectancy, all-cause mortality, and cause-speciic mortality for 249 causes of death, 1980-2015: a systematic analysis for the Global Burden of Disease Study 2015. Lancet 2016; 388: 1459-544.
18. Murray CJL, Lopez AD. The global burden of disease: a comprehensive assessment of mortality and disability from diseases, injuries and risk factors in 1990 and projected to 2020. Cambridge: Harvard University Press; 1996.
19. Institute for Health Metrics and Evaluation (IHME). Data Visualization. Disponível em: http://www. healthdata.org/results/data-visualizations (Acessado em: 18 de outubro de 2016).
20. GBD 2015 Risk Factors Collaborators. Global, regional, and national comparative risk assessment of 79 behavioral, environmental and occupational, and metabolic risks or clusters of risks, 1990-2015: a systematic analysis for the Global Burden of Disease Study 2015. The Lancet 2016 Oct 7; 388: 1659-724.
21. Souza MFM, Passos VMA, França E. Novo século, novos desaios: mudança no peril da carga de doença no Brasil de 1990 a 2010. Epidemiol Serv Saúde 2016; 25(4): 713-24.
22. Murray CJL, Vos T, Lozano R, Naghavi M, Flaxman AD, Michaud C, et al. Disability-adjusted life years (DALYs) for 291 diseases and injuries in 21 regions, 1990-2010: a systematic analysis for the Global Burden of Disease Study 2010. Lancet 2012; 380(9859): 2197-223.
23. Brasil. Sistema de Informação sobre Mortalidade (SIM). Brasília: GIAE/Secretaria de Vigilância em Saúde. Disponível em: http://tabnet.datasus.gov.br/ cgi/tabcgi.exe?sim/cnv/ext10br.def (Acessado em: 20 de outubro de 2016).
24. Lozano R, Naghavi M, Foreman K, Lim S, Shibuya K, Aboyans V, et al. Global and regional mortality from 235 causes of death for 20 age groups in 1990 and 2010: a systematic analysis for the Global Burden of Disease Study 2010. Lancet 2012; 380(9859): 2095-128.
25. Forouzanfar MH, Afshin A, Alexander LT, Anderson HR, Bhutta ZA, Biryukov S, et al. Global, regional, and national comparative risk assessment of 79 behavioural, environmental and occupational, and metabolic risks or clusters of risks, 1990–2015: a systematic analysis for the Global Burden of Disease Study 2015. Lancet 2016; 388(10053): 1659-724.
26. Foreman KJ, Lozano R, Lopez AD, Murray CJL. Modeling causes of death. An integrated approach using CODEm. Popul Health Metr 2012; 10: 1.
27. Institute for Health Metrics and Evaluation (IHME). GBD Results Tool. Disponível em: http://ghdx. healthdata.org/gbd-results-tool?params=querytool-permalink/2e5ba4f6ca459ba39a4c647a296b60e6 (Acessado em: 7 de janeiro de 2017).
28. Institute for Health Metrics and Evaluation (IHME). GBD Compare/Viz Hub. Disponível em: http://ihmeuw. org/3zmw (Acessado em: 7 de janeiro de 2017).
29. Jose BP, Camargos PA, Cruz Filho AA, Correa RA. Precisão diagnóstica de doenças respiratórias em unidades de saúde primária Rev Assoc Med Bras 2014; 60(6): 599-612.
31. Fernandes SSC, Andrade CR, Caminhas AP, Camargos PAM, Ibiapina CC.Prevalence of self-reported smoking experimentation in adolescents with asthma or allergic rhinitis. J Bras Pneumol 2016 Mar-Apr; 42(2): 84-7.
32. Instituto Brasileiro de Geograia e Estatística. Pesquisa Nacional de Saúde do Escolar 2015. Rio de Janeiro: Instituto Brasileiro de Geograia e Estatística; 2015. Disponível em: http://www.ibge.gov.br/home/ estatistica/populacao/pense/2015/default_xls.shtm (Acessado em: 07 de janeiro de 2017).
33. Institute for Health Metrics and Evaluation (IHME). GBD Results Tool. Disponível em: http://ghdx. healthdata.org/gbd-results-tool?params=querytool-permalink/881bf39da47b7b2deacbe205c042a2ea (Acessado em: 7 de janeiro de 2017).
34. Costa e Silva VL, Koifman S. Smoking in Latin America: a major public health problem. Cad Saúde Pública 1998;14 (Suppl. 3):99-108.
35. Müller F, Wehbe L. Smoking and smoking cessation in Latin America: a review of the current situation and available treatments. Int J Chron Obstruct Pulmon Dis 2008 Jun; 3(2): 285-93.
36. Mackay J, Amos A. Women and tobacco. Respirology 2003 Jun; 8(2): 123-30.
37. São José BP, Camargos PA, Bateman ED, Botelho CM, de Seixas Maciel JG, Mancuzo EV, et al. Primary care physicians’ ability to diagnose the most prevalent respiratory diseases. Int J Tuberc Lung Dis 2016 Oct; 20(10): 1392-8.
38. Institute for Health Metrics and Evaluation (IHME). GBD Results Tool. Disponível em: http://ghdx. healthdata.org/gbd-results-tool?params=querytool-permalink/31683ad84a092e4fd2c7d06e88200b7d (Acessado em: 7 de janeiro de 2017).
39. Institute for Health Metrics and Evaluation (IHME). GBD Results Tool. Disponível em: http://ghdx. healthdata.org/gbd-results-tool?params=querytool-permalink/66b81701010adec3423b3bd0f30f5ae9 (Acessado em: 7 de janeiro de 2017).
40. Giovino GA, Mirza SA, Samet JM, Gupta PC, Jarvis MJ, Bhala N, et al. Tobacco use in 3 billion individuals from 16 countries: an analysis of nationally representative cross-sectional household surveys. Lancet 2012; 380(9842): 668-79.
41. World Health Organization (WHO). Global status report on non communicable diseases 2010. Geneva: WHO; 2011. Disponível em: http://www.who.int/ nmh/publications/ncd_report_full_en.pdf (Acessado em: 7 de janeiro de 2017).
42. Brasil. Lei n.º 12.546, de 14 de novembro de 2011. Institui o Regime Especial de Reintegração de Valores Tributários para as Empresas Exportadoras (Reintegra); dispõe sobre a redução do Imposto sobre Produtos
Industrializados (IPI) à indústria automotiva; altera a incidência das contribuições previdenciárias devidas pelas empresas que menciona; altera as Leis n.º 11.774, de 17 de setembro de 2008, n.º 11.033, de 21 de dezembro de 2004, n.º 11.196, de 21 de novembro de 2005, n.º 10.865, de 30 de abril de 2004, n.º 11.508, de 20 de julho de 2007, n.º 7.291, de 19 de dezembro de 1984, n.º 11.491, de 20 de junho de 2007, n.º 9.782, de 26 de janeiro de 1999, e n.º 9.294, de 15 de julho de 1996, e a Medida Provisória n.º 2.199-14, de 24 de agosto de 2001; revoga o art. 1.º da Lei n.º 11.529, de 22 de outubro de 2007, e o art. 6.º do Decreto-Lei n.º 1.593, de 21 de dezembro de 1977, nos termos que especiica; e dá outras providências. Diário Oicial da União 2011.
43. Malta DC, Oliveira TP, Luz M, Stopa SR, Silva Junior JB, Reis AAC. Tendências de indicadores de tabagismo nas capitais brasileiras, 2006 a 2013. Ciênc Saúde Coletiva 2015 Mar; 20(3).
44. Monteiro CA, Cavalcante TM, Moura EC, Claro RM, Szwarcwald CL. Population-based evidence of a strong decline in the prevalence of smokers in Brazil (1989-2003). Bulletin of the World Health Organization 2007; 85(7): 527-34.
45. Malta DC, Morais Neto OL, Silva Junior JB. Apresentação do plano de ações estratégicas para o enfrentamento das doenças crônicas não transmissíveis no Brasil, 2011 a 2022. Epidemiol Serv Saúde 2011; 20(4): 425-38.
46. World Health Organization (WHO). Global Action Plan for the Prevention and Control of NCDs 2013-2020. 10ª ed. Geneva: World Health Organization; 2013. 55p. Disponível em: http://www.who.int/ nmh/events/ncd_action_plan/en/ (Acessado em: 7 de janeiro de 2017).
47. World Health Organization (WHO). Who Report on the Tobacco Epidemic, 2011. 2011. Disponível em: http://apps.who.int/iris/bitstream/10665/70680/1/ WHO_NMH_TFI_11.3_eng.pdf (Acessado em: 4 de novembro de 2016).
48. World Health Organization (WHO). MPOWER brochures and other resources. Disponível em: http:// www.who.int/tobacco/mpower/publications/en/ (Acessado em 7 de janeiro de 2017).
49. World Health Organization (WHO). Plain packaging of tobacco products: a review of the evidence. Disponível em: http://www.cancer.org.au/content/ pdf/CancerControlPolicy/PositionStatements/ TCUCCVBkgrndResrchPlainPak270511ReEnd_ FINAL_May27.pdf (Acessado em 7 de janeiro de 2017).
Received on: 02/07/2017