COPING STRATEGIES AND PROFILE VOICE ACTIVITIES
PARTICIPATION IN TEACHERS OF PUBLIC SCHOOLS
WITH AND WITHOUT VOICE DISORDERS
Estratégias de enfrentamento e perfil de participação
e atividades vocais em professoras da rede pública de ensino
com e sem distúrbios de voz
Cristiane Cunha Soderini Ferracciu (1), Luciano Veloso de Amorim Santos (1), Liliane Reis Teixeira (2), Marcia Soalheiro Almeida (2)
(1) Universidade Estadual de Ciências da Saúde de Alagoas-
UNCISAL, Maceió, Alagoas, Brasil.
(2) Centro de Estudos da Saúde do Trabalhador e
Ecolo-gia Humana – CESTEH/Fiocruz, Rio de Janeiro, Rio de Janeiro, Brasil.
Aid supply research: Foundation of the Alagoas State Research FAPEAL.
Conlict of interest: non-existent
school system reveals a picture of poor working conditions. The current state it is the work of teachers has drawn attention due to increased illness and removal of these professionals1.
Studies have indicated dysphonia as a frequent problem in teaching, supporting the discussion on the professional use of the voice and the employee’s right. In recent years, discussions have been oriented to the environmental aspects and on the conditions and the organization of work in the pursuit of broader relations between this, the health and quality of life2.
INTRODUCTION
In the last years the literature has shown the increasing prevalence of voice disorders among teachers and the Brazilian scenario of the public
ABSTRACT
Purpose: to verify the association between the voice disorder, with the socio-demographic characteristics, vocal aspects, the types of coping strategies, and the vocal impact on daily activities of teachers from State Schools of Alagoas. Methods: 110 teachers were submitted to a perceptive-hearing analysis, to a protocol called Condition of Vocal Production of the Teacher, a protocol of
Coping Strategies of disphonies, and a Proile of Participation and Vocal Activities. By using the
Visual-Analogue Scale the level of voice disorder was assessed: up to 35.5 mm without presenting a disorder and over 35.5 mm presenting a disorder. Statistical analyses were carried out, such as mean, standard
deviation, medium, The Pearson chi-squared test and the Exact Fisher test measures. Results: the percentages with voice disorder were higher among those who had taught for 11 to 20 years(44,6%), and those who had taught at two or three schools(49,1%). The teachers who had missed because of voice disorder and secretion/catarrh in the throat presented an association with the presence of voice disorder. Teachers in the two groups tended to allow the use of strategies as focus on the problem and
did not difer in relation to the vocal impact in the daily activities. Conclusion: teachers who have been working for more than 11 years, used to teach at two or more schools. They would always miss work because they had change of voice and had some vocal symptoms such as catarrh/secretion in the
throat and they tended to have voice disorder. The voice disorder didn’t seem to be the most signiicant in terms of the dimensions of the protocol PAV as well as the diferent types of coping strategies.
epidemiological study of analytical sectional with a representative sample of teachers from schools subordinated to the four Regional Education Coordinations (CRE), in the city of Maceio. Search for selection of teachers was held allocation propor-tional to the number of teachers in each CRE and randomly selected by the registration list provided by each CRE. The subjects underwent perceptual analysis, the questionnaire Professor Vocal Production Condition – CPV-P in order to raise socio-demographics, vocal aspects and lifestyle, the Coping Strategies Protocol of Dysphonias – HDPE
and Proile Membership and Voice Activity – VAPP.
After signing the Informed Consent and Informed – TCLE for all teachers there was conducted perceptual voice analysis.
To perform the perceptual analysis, all voices were recorded directly onto a laptop (HP Pavilion Entertainment PC), with microphone head of the
brand Plantronics Audio 20, positioned at a ixed
distance of two inches from the individual mouth. The vocal sample consisted of speech tasks: issue the sustained vowel /a/ sustained and counting of numbers 1-10 in comfortable frequency and intensity. The parameter selected for analysis was the G, overall degree of vocal deviation, recorded on a visual analog scale of 100 units. The VAS results were categorized according to the proposed by Yamasaki et al. (2008)9 up to 35,5 units as variability
Normal Quality Vocal (VNQV), from 35,6 to 50,5 as mild to moderate, from 50,6 to 90,5 as moderate to severe degree and above 90,5 as intense. The two
extremes 0 on the left and 100 on the right corre
-spond to the absence of voice maximum deviation
and voice disorders. Thus, emerged two groups: with – CDV and without vocal disorder – SDV.
The CPV-P10 is intended to characterize the
conditions of school work and vocal aspects of teachers. It consists of 71 questions divided into
seven dimensions: identiication of the subject and
school, functional situation, aspects of the work environment, work organization, vocal aspects,
lifestyle and habits. The CPV was modiied by the
author in whom responses are used in linear scale using a 100 mm slit. For this study the dimensions were used: functional condition called sociodemo-graphic, vocal aspects and lifestyle only smoking and alcohol consumption.
The SPEED is a protocol consisting of 27 items
developed speciically to evaluating the strategies
that people with voice disorders use to face their voice problem, translated and culturally adapted into Brazilian Portuguese from VDCQ-275,11. The
items are valued at a Likert scale of 6 points that analyzes the frequency of use of the strategy, where 0 corresponds to “never” and 5 to “always.” The total Teachers belong to a category considered high
risk for occupational voice disorders, since the voice is one of his most important working tools3 and vocal
changes may have an impact on his performance. Often, these professionals teach in inappropriate conditions, long hours a day, for a large number of students, in unfavorable environmental conditions and without prior training and voice communication.
Usually there is a delay in seeking teachers for vocal rehabilitation, which may be associated with the lack of information and insight on how to deal with their own voice, but may also be related to their way of dealing with stressful situations. Probably, the way to deal with a voice problem through individual choices involving personal strategies for dealing with a stressful situation, calls coping strategies that can bring an impact on prevention and treatment of dysphonia4.
The term coping refers to how each person deals with stressful situations in your life. The confrontation of research began in order to develop a concept that
would allow explain why some individuals do better
than others when subjected to stress5.
In addition, studies have indicated the impor-tance of the inclusion of focused instruments of perception of vocal change impact on patient’s lives vocal assessment6. The quality of life protocols
ofer a variety of information on the impact of voice
disorders on quality of life. In the literature there are several protocols for this purpose7. The choice of
VAPP occurred for being one of the only tools that provide data on the perception of the impact of voice in professional, social and emotional manifestations activities.
The precarious conditions of teaching show up associated with morbid symptoms and there is a high prevalence of absenteeism due to illness in the category8. Teachers have diiculty in work
performance and consequently are absent on vocal problems.
Thus, the objective of the study is to assess the association between voice disorders with sociode-mographic characteristics, the vocal aspects, types of coping strategies and the vocal impact on daily activities in Alagoas the public schools teachers.
METHODS
This study was approved by the Ethics Committee of the National School of Public Health Sergio Arouca- ENSP protocol nº 227/11 and the State University of Health Sciences Alagoas- UNCISAL, Protocol nº 1345/10.
This research involved 110 female teachers, elementary school (1st to 9th grade) of Alagoas
the following data: a range from 29 to 39 years was the least prevalent of the three groups, with 22,7% of the sample, and the percentage of other two ranged from 38,2% to 39,1%; the majority (63,6%) were married or living in a stable union, the rest were separated/widowed (20,9%) or single (15,5%);
with the exception of 4,5%, which had high school or
incomplete higher, the other had higher education; slightly more than half (50,9%) taught between 11 and 20, and the rest was divided equally between who taught there up to 10 years and there are up to 21 years or more; slightly more than half (51,8%) taught in one school and the rest taught in two or three schools; the most frequent weekly workload was 21 to 30 hours, with about half of the group, and the second highest percentage (30,9%) corre-sponded to those that had a workload of up to 20
hours; only 9,1% worked in a diferent location of
the school. Smoking habit was observed in 3,6% of the group and about 1/4 (24,5%) had the habit of drinking.
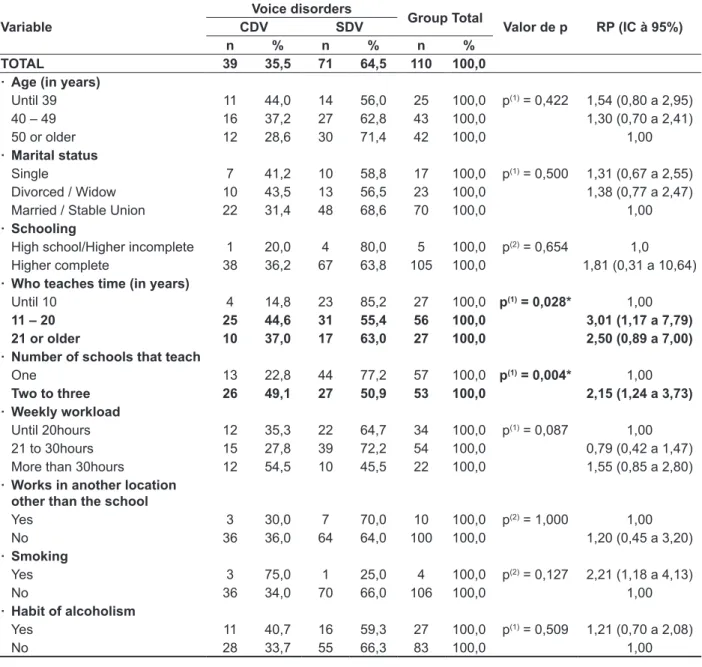
In sociodemographic results (Table 4) holds
proven signiicant association between the presence
of voice disorders, the time worked and the number of schools where they worked. For these variables, the percentage with voice disorder was higher among teachers who taught between 11 and 20 years (44,6%) and lower among who taught there until 10 years (14,8%); higher among those who teach at two to three schools than among those who taught in one school (49,1% vs. 22,8%).
The teachers who teach from 11 years or more have 2,5 to 3,0 higher prevalence ratio (PR) compared to the group who taught there 10 years. The teachers who teach at more than one school have higher PR 2,15 when compared to the group who taught in one school.
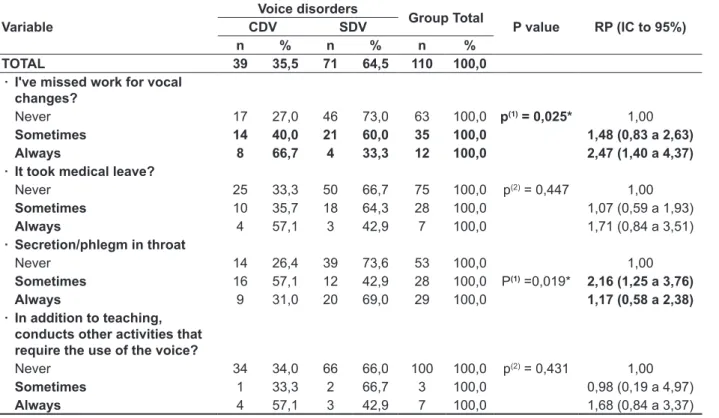
Table 5 shows that the only two variables associated with the presence of the voice disorder were “already missed work for vocal” and “secretion/ phlegm in the throat.” In “I missed work for vocal” it is emphasized that the percentage with voice disorders was lower among those who “never” had missed work for voice disorders (27,0%), and higher among missing “always” (66,7%). The teachers who answered “sometimes” and “always” to “have missed work for voice disorders” have 1,48 to 2,47 more likely to have the voice disorder when compared to teachers who never missed. In “secretion/phlegm in the throat” is emphasized that the percentage with voice disorder was higher for those who had the problem “Sometimes” (57,1%) and ranged from 26,4% to 31,0% in other two categories of the variable.
score produced by the protocol can range from “0” to “135”, with “0” indicating no use of strategies and “135” use of all quiz strategies. For data analysis
we chose to follow the classiication of focus with
strategies in the problem and focus on emotion5.
The PPA is a self-assessment tool validated in
Brazil, consisting of 28 questions divided into ive
dimensions: self-vocal evaluation, work
require-ments, efects on daily communication, efects on media and efects on emotion12. For each response,
a trait in vertical shall be awarded on an analog scale of 10 cm and the indicated value will be measured with a ruler. The score for each question may vary from zero through ten. To calculate the total score of VAPP, add up all the markings of 28 questions. The
total maximum score is 280 points.
The maximum score for the dimension
“self-perception of the level of their vocal problem” is 10 points; to dimension “work requirements” is 40
points; to the size “efects on daily communication” is 120 points; to the size “efects in the media” is 40 and the size “efects on your emotion” is 70 points.
Two additional scores can be calculated: Limitation score in the Activities-PLA, which should be added to the score of ten pairs issues of the way “work”, “everyday communication” and “media” (questions 2, 4, 6, 8, 10, 12, 14, 16, 18 and 20) and Score Participation Restriction – PRP, which should be added to the score of 10 odd questions of the same aspects (questions 3, 5, 7, 9, 11, 13, 15, 17,
19 and 21) totaling a maximum score of 100 points
for each score. The higher the results, the greater the limitation on vocals and most activities is the restriction on the participation of vocal activities.
In the data analysis absolute and percentage distributions were obtained and statistical measures: mean, standard deviation and median. To evaluate the association between two categorical variables, we used the statistical test Chi-square test or Fisher’s
exact when the conditions for the Chi-square test were not veriied. The “software” statistical used
to obtain the statistical calculations was the SPSS (Statistical Package for Social Sciences), version 17 and STATA in version 11. The margin of error used in the decision of the statistical tests of 5,0% and intervals were obtained with 95.0% reliability.
RESULTS
The age of the surveyed teachers ranged from 29 to 62 years old, with an average of 45,81 years old, standard deviation of 7,41 years and a median of 46,00 years old.
the highest percentage of positive responses and
classiication focus on the problem and focus on excitement for the group with voice disorder.
Tables 1 and 2 refers to strategies with the highest percentage of positive responses and
classi-ication focus on the problem and focus on emotion
to the voiceless disorder group, and strategies with
Table 1 – Strategies with higher percentage of positive responses and focus on the classiication
problem and focus on emotion for the group with voice disorder
Question Focus of the
strategy
Percentage (%)
1. It’s easier to deal with my voice problem when others are kind Emotion 94,9 8. I ind it easier to deal with my problem looking for voice understand him better Problem 87,2 13. I think easier to deal with my problem of voice when ask questions to doctors Problem 87,2 24. Rest the voice helps me deal with the problem of voice Problem 87,2 15. I ind it easier to deal with my problem of wishing he voice over Emotion 84,6 3. I wonder how it would be nice not to have voice problem Emotion 82,1 2. I try to avoid situations that make my voice problem more evident Problem 79,5 4. I try to get all possible information about my voice problem Problem 76,9 5. I ind it easier to deal with my problem of voice talking what I feel Emotion 76,9 7. Talk to friends and family about my voice problem help me Problem 76,9
11. It’s easier to live with my voice when I talk Problem 74,4
9. I keep for me any concern about my voice problem Emotion 71,8
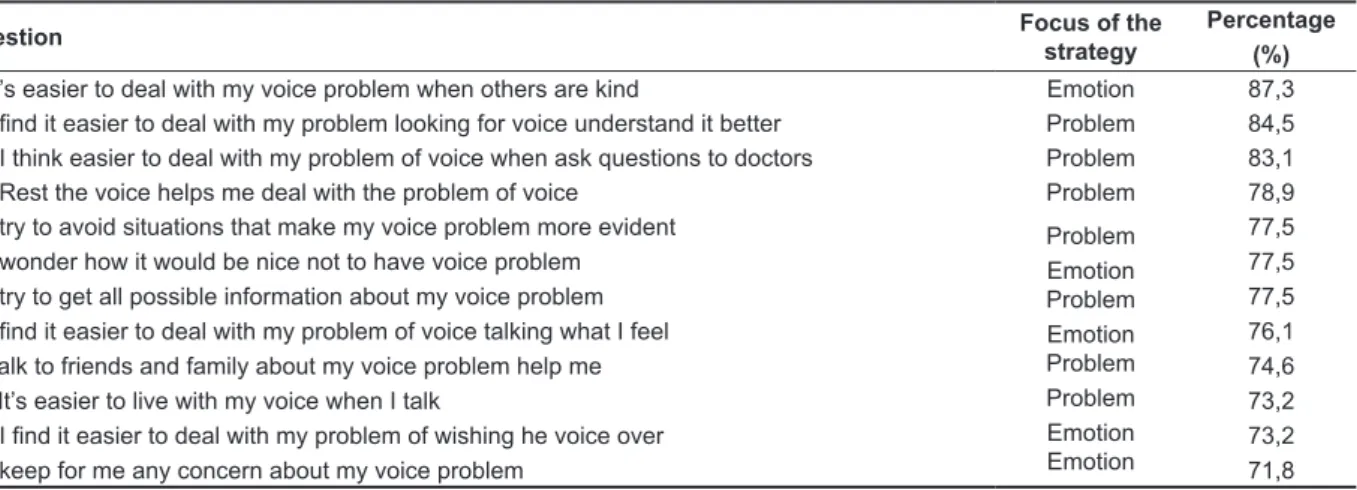
Table 2 – Strategies with higher percentage of positive responses and focus on the classiication
problem and focus on emotion to the group without voice disorder
Question Focus of the
strategy
Percentage (%)
1. It’s easier to deal with my voice problem when others are kind Emotion 87,3 8. I ind it easier to deal with my problem looking for voice understand it better Problem 84,5 13. I think easier to deal with my problem of voice when ask questions to doctors Problem 83,1 24. Rest the voice helps me deal with the problem of voice Problem 78,9 2. I try to avoid situations that make my voice problem more evident
3. I wonder how it would be nice not to have voice problem 4. I try to get all possible information about my voice problem 5. I ind it easier to deal with my problem of voice talking what I feel 7. Talk to friends and family about my voice problem help me 11. It’s easier to live with my voice when I talk
15. I ind it easier to deal with my problem of wishing he voice over 9. I keep for me any concern about my voice problem
Problem Emotion Problem Emotion Problem Problem Emotion Emotion
77,5 77,5 77,5 76,1 74,6 73,2 73,2 71,8
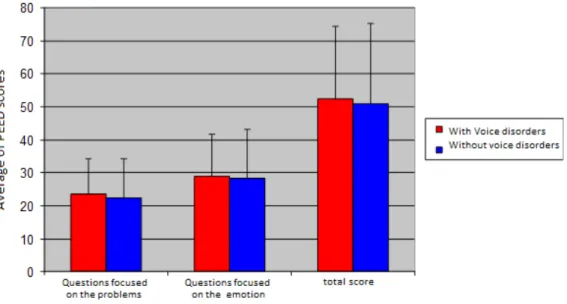
Figure 1 shows the mean and standard deviation of HDPE scores according to the occurrence of voice disorder.
teaching19, may be vulnerable to time expressed in
years of work18,20 and with only ive years of service,
grow the usages in the ield of otorhinolaryngology,
representing major damages to the State20.
The weekly working hours above 21 hours/class per week was observed in 76 teachers (69,1%), as is similar to other research21. Study shows that the
weekly working hours exceeding 25 hours/class
per week showed -If strongly associated with some vocal symptoms such as hoarseness, vocal fatigue, sore throat and loss of voice. The same concludes that a great vocal demand leading to the misuse of the voice, especially in activities that require a lot of
efort, can result in negative vocal symptoms18.
One study22 found that vocal changes cannot
be perceived by teachers. The main channel for a teacher to realize a voice problem is the feeling and not necessarily the vocal symptoms23.
The study reports that these three sensations (hoarseness, dry throat and sore throat) may be associated with the fact that the teachers talk a lot and the need to overcome the presence of strong noise. Note that the three symptoms are related to discomfort in the vocal tract and were higher than the symptoms related to voice quality, in this research. To this may indicate that teachers who did not report vocal complaints, but pointed out some of these discomforts are teachers predisposed to have voice problems, if not met their needs in caring for the voice22.
Authors report that smoking is considered improper vocal behavior, and can contribute to the emergence of vocal fold lesions, due to the friction
DISCUSSION
In this sample it was decided to conducting the study with teachers because women make up
approximately 80% of the teaching population13
and present a larynx with greater susceptibility to
the vocal impact due to glottal closure14 and higher
prevalence of voice disorders compared to male teachers14,15.
The age of the survey teachers ranged 29-62 years old, average of 45,8 years old. According to the distribution of frequency for ages, there is a predominance of the age group 40-62 (85; 77,3%). These data are similar to those found in national13
and international studies15,16. The literature suggests
that, as we age, the vocal eiciency decreases and a number of structural changes in the larynx may
occur with greater or lesser vocal impact14,16.
Regarding the teaching experience, 56 (50,9%)
of the teachers had studied teaching time between 11 to 20 years, while 27 (24,5%) worked there up to
ten years. This inding coincides with other research
that shows that more than half of the studied teachers have between 11 and 20 years of teaching (55,5%)17. Research shows that the more years of
exposure to teaching, more likely to have disorder
voice, although it is controversial in the literature regarding the association of the profession time voice and disturbance18. In this study it was found
that 44.6% of CDV were teaching teachers from 11 to 20 years and only 14,8% CDV lectured there 10
years. The voice of teachers sufer a substantial
deterioration after two years of professional use in
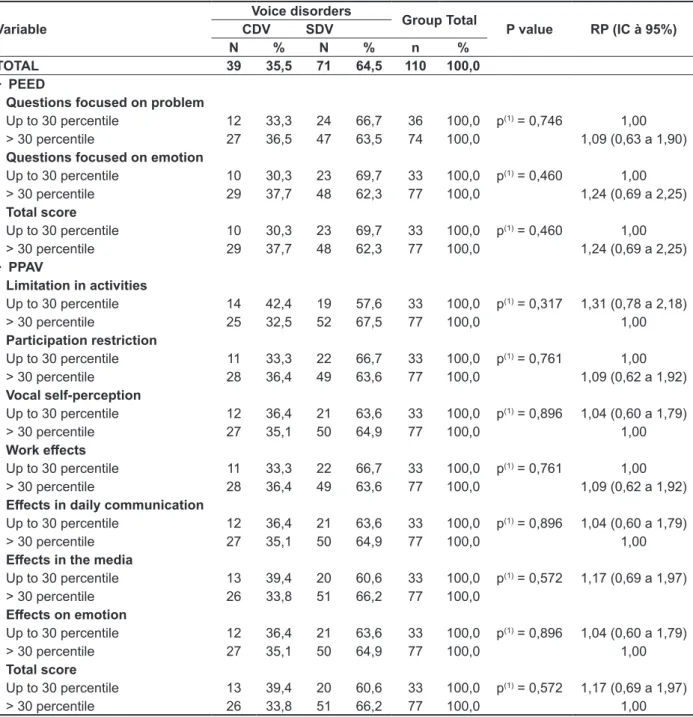
Table 3 – Analysis of the Association of scores of scales and PEED PAAV with groups with voice disorder and without voice disorder
Variable
Voice disorders
Group Total
P value RP (IC à 95%)
CDV SDV
N % N % n %
TOTAL 39 35,5 71 64,5 110 100,0
· PEED
Questions focused on problem
Up to 30 percentile 12 33,3 24 66,7 36 100,0 p(1) = 0,746 1,00
> 30 percentile 27 36,5 47 63,5 74 100,0 1,09 (0,63 a 1,90)
Questions focused on emotion
Up to 30 percentile 10 30,3 23 69,7 33 100,0 p(1) = 0,460 1,00
> 30 percentile 29 37,7 48 62,3 77 100,0 1,24 (0,69 a 2,25)
Total score
Up to 30 percentile 10 30,3 23 69,7 33 100,0 p(1) = 0,460 1,00
> 30 percentile 29 37,7 48 62,3 77 100,0 1,24 (0,69 a 2,25)
· PPAV
Limitation in activities
Up to 30 percentile 14 42,4 19 57,6 33 100,0 p(1) = 0,317 1,31 (0,78 a 2,18)
> 30 percentile 25 32,5 52 67,5 77 100,0 1,00
Participation restriction
Up to 30 percentile 11 33,3 22 66,7 33 100,0 p(1) = 0,761 1,00
> 30 percentile 28 36,4 49 63,6 77 100,0 1,09 (0,62 a 1,92)
Vocal self-perception
Up to 30 percentile 12 36,4 21 63,6 33 100,0 p(1) = 0,896 1,04 (0,60 a 1,79)
> 30 percentile 27 35,1 50 64,9 77 100,0 1,00
Work efects
Up to 30 percentile 11 33,3 22 66,7 33 100,0 p(1) = 0,761 1,00
> 30 percentile 28 36,4 49 63,6 77 100,0 1,09 (0,62 a 1,92)
Efects in daily communication
Up to 30 percentile 12 36,4 21 63,6 33 100,0 p(1) = 0,896 1,04 (0,60 a 1,79)
> 30 percentile 27 35,1 50 64,9 77 100,0 1,00
Efects in the media
Up to 30 percentile 13 39,4 20 60,6 33 100,0 p(1) = 0,572 1,17 (0,69 a 1,97)
> 30 percentile 26 33,8 51 66,2 77 100,0
Efects on emotion
Up to 30 percentile 12 36,4 21 63,6 33 100,0 p(1) = 0,896 1,04 (0,60 a 1,79)
> 30 percentile 27 35,1 50 64,9 77 100,0 1,00
Total score
Up to 30 percentile 13 39,4 20 60,6 33 100,0 p(1) = 0,572 1,17 (0,69 a 1,97)
> 30 percentile 26 33,8 51 66,2 77 100,0 1,00
(*): Signiicant association at the level of 5.0%. (1): Pearson’s Chi-square test.
CDV: with voice disorder SDV: without voice disorder
A study of 97 public school teachers of Bauru, of
both sexes, who taught in kindergarten, elementary,
middle and teaching young people and adults (EJA). The study points out that the comparison of VAPP measurements between the groups with vocal and without voice disorders has shown that teachers who reported vocal perceived greater severity of voice problem and impact of this problem
in the exercise of their professional activities, in their
day to day, in society and in communicating your emotions. Compared to the present study it was observed that the average found in CDV and SDV groups were close to the average of the group that reported voice alteration of the study27. The CDV
and SDV teachers do not difer in their perception of
the vocal impact in carrying out daily activities.
For VAPP and SPEED instruments signiicant
associations were found. The wide divergence in study results may be due to factors such as
method-ological diferences in the procedure, type and size of the population sample, conlicts in voice disorder deinition, evaluation criteria and organizational
and environmental factors, among others15, and a
fact that proves the multiple causes involving voice disorder28.
that causes irritation and tissue peeling24. It is
usually found in patients with voice disorders and
is a sign insuicient hydration, as the feeling of dry
throat. The results of this study were similar to those presented refers to the feeling of dry throat13.
International research relates to higher rates of strategies focused on emotion for subjects with
vocal complaints and benign lesions of larynx25 and
subjects diagnosed with spasmodic dysphonia and dysphonia by musculoskeletal tension11.
National surveys indicate that subjects with vocal complaints seek objective and more realistic resolu-tions to meet the voice problems, seeking a greater frequency, strategies focused on the problem11
and subjects who sought treatment also showed a greater tendency to use focus with strategies in problem 5. The results of this research report that
the teachers of CDV group and SDV group use the same amount of strategies focused on the problem and focusing on emotion there is a trend to more frequent use of strategies focused on the problem for the two groups.
One study evaluated forty individuals with vocal and forty individuals without voice disorders using voice and VAPP evaluation. The group with dysphonia showed superior results in all parameters compared to the group without dysphonia 26.
Figure 2 – Median scores of Vocal Activities and Participation proile according to the occurrence of
coping strategies, revealing a tendency to use coping strategies focused on the problem.
ACKNOWLEDGEMENTS
To the Foundation for Research Support of the
State of Alagoas- FAPEAL, for the inancial support
in the development of this work.
CONCLUSION
Teachers with more than 11 years of work, who teach in two or more schools, always absent from work for vocal and presented as vocal symptom phlegm/ secretion in the throat are more likely to have voice disorder.
The voice disorder presence was not signiicant
for the size of VAPP Protocol and for the types of
Table 4 – Characterization of the group of teachers with voice disorder and without voice disorder, according to sociodemographic variables.
Variable
Voice disorders
Group Total
Valor de p RP (IC à 95%)
CDV SDV
n % n % n %
TOTAL 39 35,5 71 64,5 110 100,0
· Age (in years)
Until 39 11 44,0 14 56,0 25 100,0 p(1) = 0,422 1,54 (0,80 a 2,95)
40 – 49 16 37,2 27 62,8 43 100,0 1,30 (0,70 a 2,41)
50 or older 12 28,6 30 71,4 42 100,0 1,00
· Marital status
Single 7 41,2 10 58,8 17 100,0 p(1) = 0,500 1,31 (0,67 a 2,55)
Divorced / Widow 10 43,5 13 56,5 23 100,0 1,38 (0,77 a 2,47)
Married / Stable Union 22 31,4 48 68,6 70 100,0 1,00
· Schooling
High school/Higher incomplete 1 20,0 4 80,0 5 100,0 p(2) = 0,654 1,0
Higher complete 38 36,2 67 63,8 105 100,0 1,81 (0,31 a 10,64)
· Who teaches time (in years)
Until 10 4 14,8 23 85,2 27 100,0 p(1) = 0,028* 1,00
11 – 20 25 44,6 31 55,4 56 100,0 3,01 (1,17 a 7,79)
21 or older 10 37,0 17 63,0 27 100,0 2,50 (0,89 a 7,00)
· Number of schools that teach
One 13 22,8 44 77,2 57 100,0 p(1) = 0,004* 1,00
Two to three 26 49,1 27 50,9 53 100,0 2,15 (1,24 a 3,73)
· Weekly workload
Until 20hours 12 35,3 22 64,7 34 100,0 p(1) = 0,087 1,00
21 to 30hours 15 27,8 39 72,2 54 100,0 0,79 (0,42 a 1,47)
More than 30hours 12 54,5 10 45,5 22 100,0 1,55 (0,85 a 2,80)
· Works in another location other than the school
Yes 3 30,0 7 70,0 10 100,0 p(2) = 1,000 1,00
No 36 36,0 64 64,0 100 100,0 1,20 (0,45 a 3,20)
· Smoking
Yes 3 75,0 1 25,0 4 100,0 p(2) = 0,127 2,21 (1,18 a 4,13)
No 36 34,0 70 66,0 106 100,0 1,00
· Habit of alcoholism
Yes 11 40,7 16 59,3 27 100,0 p(1) = 0,509 1,21 (0,70 a 2,08)
No 28 33,7 55 66,3 83 100,0 1,00
(*): Signiicant association at the level of 5.0% (1): Pearson’s Chi-square test
Table 5 – Characterization of the group of teachers with voice disorder and without voice disorder, according to the variables related to vocal aspects
Variable
Voice disorders
Group Total
P value RP (IC to 95%)
CDV SDV
n % n % n %
TOTAL 39 35,5 71 64,5 110 100,0
· I've missed work for vocal changes?
Never 17 27,0 46 73,0 63 100,0 p(1) = 0,025* 1,00
Sometimes 14 40,0 21 60,0 35 100,0 1,48 (0,83 a 2,63)
Always 8 66,7 4 33,3 12 100,0 2,47 (1,40 a 4,37)
· It took medical leave?
Never 25 33,3 50 66,7 75 100,0 p(2) = 0,447 1,00
Sometimes 10 35,7 18 64,3 28 100,0 1,07 (0,59 a 1,93)
Always 4 57,1 3 42,9 7 100,0 1,71 (0,84 a 3,51)
· Secretion/phlegm in throat
Never 14 26,4 39 73,6 53 100,0 1,00
Sometimes 16 57,1 12 42,9 28 100,0 P(1)=0,019* 2,16 (1,25 a 3,76)
Always 9 31,0 20 69,0 29 100,0 1,17 (0,58 a 2,38)
· In addition to teaching, conducts other activities that require the use of the voice?
Never 34 34,0 66 66,0 100 100,0 p(2) = 0,431 1,00
Sometimes 1 33,3 2 66,7 3 100,0 0,98 (0,19 a 4,97)
Always 4 57,1 3 42,9 7 100,0 1,68 (0,84 a 3,37)
(*): Signiicant association at the level of 5.0%
(**): It has not been possible to determine due to the occurrence of very low frequencies (1): Pearson’s Chi-square test
(2): Fisher’s exact test CDV: with voice disorder SDV: without voice disorder
RESUMO
Objetivo: veriicar a associação entre o distúrbio vocal com as características sociodemográicas, os aspectos vocais, os tipos de estratégias de enfrentamento e o impacto vocal nas atividades diárias
em professoras da rede estadual de ensino de Alagoas. Métodos: cento e dez professoras foram
submetidas à análise perceptivo-auditiva, aos protocolos Condição de Produção Vocal do Professor, Protocolo de Estratégias de Enfrentamento das Disfonias e Peril de Participação e Atividades Vocais.
Por meio da Escala Analógico-Visual avaliou o grau de distúrbio vocal: até 35,5mm sem distúrbio e
acima de 35,5mm com distúrbio. Foram utilizados para as análises estatísticas média, desvio padrão, mediana, Qui-quadrado de Pearson e Exato de Fisher. Resultados: os percentuais com distúrbio vocal foram mais elevados entre as que lecionavam entre 11 e 20 anos (44,6%) e as que lecionavam
em duas a três escolas (49,1%). “Já faltou ao trabalho por alterações vocais e secreção/catarro na garganta” apresentaram associação com a presença do distúrbio vocal. Professoras dos dois grupos apresentaram uma tendência para a utilização das estratégias com foco no problema e não diferiram quanto à percepção do impacto vocal na realização de atividades diárias. Conclusão: professoras que possuem mais de 11 anos de docência; lecionavam em duas ou mais escolas; faltavam sempre
ao trabalho por alterações vocais e apresentavam como sintoma vocal catarro/secreção na garganta apresentaram maiores chances de ter distúrbio vocal. A presença do distúrbio vocal não se mos
-trou signiicante para as dimensões do protocolo PPAV, assim como para os tipos de estratégias de
enfrentamento.
general population: efects on work performance,
attendance and future career choices. J Speech Lang Hear Res. 2004;47:542-51.
15. Russell A, Oates J, Greenwood KM. Prevalence of voice problems in teachers. J Voice. 1998;12:467-79.
16. Kooijman PGC, Thomas G, Graamans K, de Jong FI. Psychosocial impact of the teacher’s voice throughout the career. J Voice. 2006;21(3):316-24. 17. Ferreira LP, Esteves AAO, Giannini SPP. Reprodutibilidade (teste-reteste) de sintomas vocais
e sensações laringofaríngeas. Distúrb. Comun.
2012;24(3):389-94.
18. Ceballos AGCC, Souza RC, Borges LL, Campos AF, Pinto AL, Santos CC. Tempo de docência como fator de risco para a disfonia relacionada ao trabalho. Rev. Soc. Bras. Fonoaudiol. – Suplemento Especial. 2008;1(numero?):78.
19. Dragone MLS, Sichirolli S, Reis R, Behlau M. O desgaste vocal do professor: um estudo longitudinal. Rev. Soc. Bras. Fonoaudiol. 1999;3(5):50-6.
20. Brito J, Athaide M. Trabalho, educação e saúde: o ponto de vista enigmático da atividade. Trab.
educ. saúde. 2003;1(2):239-66.
21. Jardim R, Barreto SM, Assunção AA. Condições
de trabalho, qualidade de vida e disfonia entre docentes. Cad Saúde Pública. 2007;23(10):2439-61. 22. Tavares ELM, Martins RHG. Vocal evaluation in teachers with or without symptoms. J Voice. 2008;21(4):407-14.
23. Ilomaki I, Leppanenk K, Kleemola L, Tyrmi J, Laukkanen AM, Vilkman E. Relationships between self-evaluations of voice and working conditions,
background factors, and phoniatric indings in
female teachers. Logoped Phoniatric Vocol. 2009;34(1):20-31.
24. Behlau M, Azevedo R, Pontes P. Avaliação de
Voz. In: Behlau M. (Org.) Voz: o livro do especialista. Rio de Janeiro: Revinter, 2001. P. 121-5.
25. Mchugh-Munier C, Scherer KR, Lehmann W, Scherer U. Coping strategies, personality, and voice quality in patients with vocal fold nodules and polyps. J Voice. 1997;11:452-61.
26. Antoni MH, Lechner S, Diaz A, Vargas A, Holley H, Phillips K et al. Cognitive-behavioral stress management intervention decreases the prevalence
of depression and enhances beneit inding among
women under treatment for early-stage breast cancer. Health Psychol. 2001;20(1):20-32.
REFERENCES
1. Brito J, Gomes L. Desaios e possibilidades ao trabalho docente e à sua relação com a
saúde. Estudos e Pesquisas em Psicologia. 2006;5(1):49-62.
2. Schwarz K, Cielo C. A voz e as condições de
trabalho de professores de cidades pequenas do Rio Grande do Sul. Rev. Soc. Bras. Fonoaudiol. 2005;10(2):83-90.
3. Vianello L, Assunção AA, Gama ACC. O uso da
voz em sala de aula após adoecimento vocal. VI
Seminário da Redestrado – Regulação Educacional
e Trabalho Docente. Rio de Janeiro, 2006.
4. Zambon FC. Estratégias de enfrentamento em
professores com queixa de voz. Rev. Soc. Bras.
Fonoaudiol. 2012;17(2):237.
5. Oliveira G, Hirani SP, Epstein R, Yazigi L, Behlau M. Coping strategies in voice disorders of a brazilian population. J. Voice. 2012;26(2):205-13.
6. Hogikyan N. The Voice-Related Quality of Life (V-RQOL) Measure: History and Ongoing Utility of a Validated Voice Outcomes Instrument. Voice and Voice Disorders. 2004;14(1):3-5.
7. Zraick RI, Risner BY. Assessment of quality of life in persons with voice disorders. Current Opinion in Otolaryngology & Head & Neck Surgery. 2008;16(3):188-93.
8. Gasparini SM, Barreto SM. O professor, as
condições de trabalho e os efeitos sobre sua saúde. Educação e Pesquisa. 2005;31(2):189-99.
9. Yamasaki R, Leão SH, Madazio G, Padovani
M, Azevedo R, Behlau M. Correspondência entre escala analógico-visual e a escala numérica na
avaliação perceptivo-auditiva de vozes. In: XVI
Congresso Brasileiro de Fonoaudiologia; 2008 Set
24-27; Campos de Jordão – SP.
10. Ferreira LP, Giannini SPP, Figueira S, Silva EE, Karmann DF, Thomé-de-Souza TM. Distúrbio da voz relacionado ao trabalho: proposta de um
instrumento para avaliação de professores. Distúrb
Comun. 2007;19(1):127-37.
11. Epstein R, Hirani SP, Stygall J, Newman SP. How do individuals cope with voice disorders? Introducing the voice disability coping questionnaire. J Voice. 2009;(23):209-17.
12. Behlau M, Oliveira G, Santos LMA, Ricarte A.
Validação no Brasil de protocolos de auto-avaliação
do impacto de uma disfonia. Pró-Fono R. Atual. Cient. 2009;21(4):326-32.
13.Thomé CR. A voz do professor: relação
entre distúrbio vocal e fatores psicossociais do
trabalho [Dissertação]. São Paulo (SP): Pontifícia Universidade Católica de São Paulo; 2007.
28. Ferreira LP, Bernardi APA. Distúrbio de voz relacionado ao trabalho: resgaste histórico. Distúrb. Comum. 2011;23(2):233-36.
27. Martinello JG. Avaliações psicométricas de
qualidade de vida e voz em professores da rede
municipal de Bauru [Dissertação]. São Paulo (SP): Universidade de São Paulo- Faculdade de
Odontologia de Bauru; 2009.
Received on: September 09, 2014 Accepted on: March 19, 2015
Mailing address:
Cristiane Cunha Soderini Ferracciu
Rua Baltazar Passos, 260 apt 1901 – Boa Viagem Recife – PE – Brasil
CEP: 51130-290