Cesarean on request
C
ESARIANA A PEDIDOAuthorship: Febrasgo, Sociedade Brasileira de Anestesiologia
Participants: Sergio F. de Toledo1, Ricardo Simões1,2, Luca S. Bernardo2, Wanderley M. Bernardo2, Antônio J. Salomão1, Edmund C. Baracat1
Conflict of interest:none
1Federação Brasileira das Associações de Ginecologia e Obstetrícia (Febrasgo) 2Guidelines Project, Associação Médica Brasileira
http://dx.doi.org/10.1590/1806-9282.61.04.296
The Guidelines Project, an initiative of the Brazilian Medical Association, aims to combine information from the medical field in order to standard-ize procedures to assist the reasoning and decision-making of doctors.
The information provided through this project must be assessed and criticized by the physician responsible for the conduct that will be adopted, de-pending on the conditions and the clinical status of each patient.
I
NTRODUCTIONThe rates of C-sections without medical or obstetric in-dication have increased substantially in the last decades, especially in developing countries. Many factors contrib-ute to this increase, being the mother-requested cesare-an delivery a contributing factor (D).1
There is a major debate about the implementation of C-sections performed at the mother’s request without any established medical indication, and safety, cost, maternal autonomy, maternal and professional satisfaction, and eth-ics constitute important factors under discussion. These days, the practice of cesarean section on request consti-tutes a very important issue but, unfortunately, there is a lack of scientific studies to guide medical practice. Wom-en over the decades became indepWom-endWom-ent, modern and ac-tive in various professions, excelling compared to men. Their autonomy allows them to enjoy their own choices, including those related to their own body. In developed countries, they can choose whether or not to carry out an initial pregnancy, plastic surgery procedures, or even bar-iatric surgery.
Thus, detailed scientific studies in the context of ev-idence-based medicine are essential.
O
BJECTIVETo prepare a recommendation evaluating the risks and benefits involved in the practice of cesarean delivery on maternal request and C-section without medical indica-tion, compared to the planned vaginal delivery.
M
ETHODSThe evidence used for analysis of the risks and benefits involved in the practice of cesarean delivery on maternal request and C-section without medical indication was
obtained according to the following steps: preparation of the clinical question, structuring of the question, search for evidence, critical evaluation and selection of evidence.
Clinical question
Are nulliparous or multiparous women undergoing ce-sarean section, on request or without medical indication in term pregnancies, at increased risk of maternal and fe-tal complications compared to those undergoing planned vaginal delivery?
Structured question
The clinical question is structured according to the P.I.C.O. components: (P [patient]; I [intervention]; C [compari-son]; O [outcome]).
• P: pregnancy to term;
• I: cesarean section on maternal request; • C: vaginal deliver;
• O: maternal, perinatal and neonatal morbidity and mortality.
Bases of scientiic data consulted
The scientific databases consulted were: PubMed-Med-line and Cochrane. Manual search from revisions refer-ences (narrative or systematic) was also performed.
Strategies for search of evidence PubMed-Medline
Strategy: (cesarean* OR (cesarean sections OR delivery,
(re-quest OR patient preference OR demand OR medical in-dication OR medical inin-dications).
Cochrane
Strategy: cesarean section AND request.
Studies retrieved (4/15/2014) (Table 1)
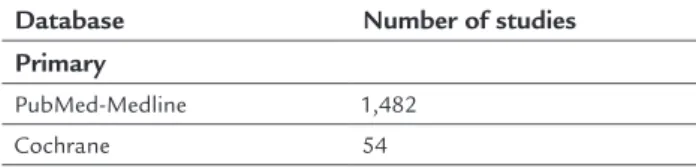
TABLE 1 Number of studies retrieved with the search strategies used for each scientific database.
Database Number of studies
Primary
PubMed-Medline 1,482
Cochrane 54
Inclusion criteria for studies retrieved
Selection of studies, assessment of titles and abstracts ob-tained from the search strategy in the consulted databases was conducted by two researchers with skills in the prepa-ration of systematic reviews, both independent and blind-ed, strictly observing the inclusion and exclusion criteria previously established. All potentially relevant studies were identified. Whenever the title and the summary were not enlightening, researchers sought the full article.
Study design
Narrative reviews, case reports, case series and studies pre-senting preliminary results were excluded from the as-sessment. Systematic reviews and meta-analyzes were used with the basic purpose of recovering references that per-haps had been lost at first, from the initial search strate-gy. Only comparative nonrandomized studies (strength of evidence 2B and 2C) were included.
P.I.C.O. components
• Patient: nulliparous or multiparous patients under-going cesarean section on maternal request or with-out medical indication, at term, pre- or intra-labor, and women undergoing planned vaginal delivery at term.
• Intervention: cesarean section on maternal request or cesarean delivery without medical indication. • Comparison: patients undergoing planned vaginal
delivery.
• Outcome: the outcomes were divided into maternal outcomes, newborn outcomes and emergency cesare-an. Maternal outcomes include: maternal death, bleed-ing complications, infectious complications, wound complications, complications in breastfeeding.
Bleed-ing complications were defined in the study as bleed-ing ≥ 1,000mL, need for blood transfusion after deliv-ery, need for curettage due to placental persistence, anemia, prolonged vaginal bleeding and hysterectomy caused by bleeding. Maternal infectious complications are defined as urinary tract infections, endometritis and sepsis. Wound complications were classified as wound infection, dehiscence or pain. Complications in breastfeeding are defined as mixed feeding or feed-ing with formula only. Newborn outcomes include: Apgar score lower or equal to 7, asphyxia, respiratory complications, infection, and need for admission to neonatal ICU. Asphyxia was defined as pH of venous blood or blood cord lower than 7.0. Respiratory com-plications were defined according to studies of respi-ratory distress syndrome of the newborn, use of CPAP, need for ventilation, and dyspnea or tachypnea.
Language
The authors included studies available in Portuguese, English, French or Spanish.
According to publication
Only studies with full text available were considered for critical assessment.
Studies selected in the irst assessment
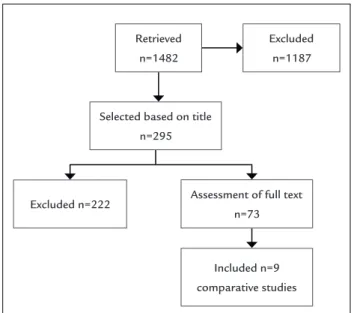
Using the search strategy described, 1,482 studies were retrieved. Out of these, which were reviewed based on ti-tle, only 295 articles included the subject cesarean deliv-ery on maternal request or C-section without medical in-dication, and thus 1,187 studies were excluded. Of the 295 studies, only 73 were selected for full text review, be-ing considered for final evaluation 9 comparative stud-ies (observational cohorts) that met the criteria for inclu-sion and excluinclu-sion (Flowchart 1).
Evidence selected in critical evaluation and exhibition of results The studies considered for full text reading were critical-ly assessed according to inclusion and exclusion criteria, study design, P.I.C.O., language and availability of the full text.
Results of the clinical situations are displayed in Ta-bles 4, 5 and 6.
References related to the studies included are shown in Table 3, and are also presented in the section References.
Crit-ical assessment of RCTs allows to classify them according to the Jadad score, so that Jadad < 3 trials are considered inconsistent (B), and those with scores ≥ 3, consistent (A). For critical analysis of non-randomized studies, among them prospective observational studies, the authors used the Newcastle-Ottawa scale.8
For results with available evidence, wherever possible, the following specific items are defined: population, in-tervention, outcomes, the presence or absence of benefit and/or damage and controversies.
Cost issues will not be included in the results. The results will be presented preferably in absolute data, absolute risk, number needed to treat (NNT), or number needed to harm (NNH), and occasionally in mean and standard deviation.
Statistical analysis
The measures of effectiveness or damage expressed in solute numbers were analyzed using the difference in ab-solute risk, adopting a confidence interval of 95%. For statistically significant results, the number needed to treat to benefit (NNT) and the number needed to treat to harm (NNH) were calculated. The meta-analysis was performed using RevMan 5 (Review Manager, Cochrane Collabora-tion, 2008) software.
Heterogeneity
Inconsistencies among the clinical trials were evaluated for heterogeneity using chi-square test (Chi2) and quan-tified through I2 test. Values above 50% were considered significant.
TABLE 2 Critical assessment script for randomized controlled trials (checklist).
Study data
Reference, study design, Jadad, strength of evidence
Sample size calculation
Estimated differences, power, significance level, total number of patients
Patient selection
Inclusion and exclusion criteria
Patients
Recruited, randomized, prognostic differences
Randomization
Description and blinded allocation
Patient follow-up
Time, losses, migration
Treatment protocol
Intervention, control and blinding
Analysis
Intention to treat, analyzes of intervention and control
Outcomes considered
Primary, secondary, measuring instrument of the outcome of interest
Result
Benefit or harm in absolute data, benefit or harm on average
R
ESULTSEvidence selected
TABLE 3 Selection process.
Type of publication Included
Nonrandomized comparative studies
92-10
The main reasons for the exclusion of works were: the un-availability of the full text; nonrandomized comparative studies with different study design; studies that includ-ed preterm fetuses (gestational age <37 weeks), or those using only the estimated weight of the fetus as a criteri-on for inclusicriteri-on. The graphics of the meta-analysis relat-ing to the works included in the assessment are shown in the Appendix.
The average gestational age is significantly lower in the group of cesarean delivery with no indication as com-pared to the planned vaginal delivery group in four of the five studies evaluating this outcome (Table 4) (B).3-6,9 The mean birth weight is assessed in five studies, and in one work, only the mean weight is significantly higher in the cesarean group without indication (Table 5) (B).3-6,8
Effect of cesarean section on maternal request or without indication on maternal mortality
Three studies evaluate maternal mortality (B);2-4 howev-er, only one study has events for this outcome (B).8 The Included n=9
comparative studies Retrieved
n=1482
Excluded n=1187
Selected based on title n=295
Excluded n=222 Assessment of full text n=73
study shows an absolute risk reduction of maternal mor-tality of 3.0% in favor of cesarean section on maternal re-quest or without indication; however, this decrease is not significant (95CI: -0.14 to 0.07; Table 4).
Effect of cesarean section on maternal request or without indication on bleeding complications
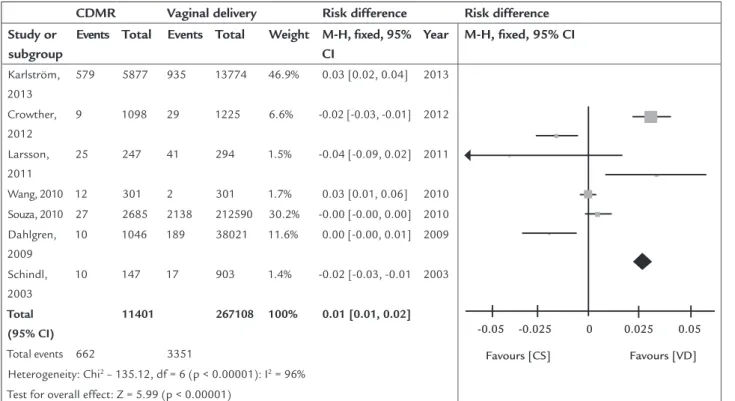
Seven studies assessed maternal bleeding complications after delivery (B).2,3-8 Based on simple averages, the rate of bleeding complications in the group of cesarean sec-tion on maternal request without medical indicasec-tion is 5.8 versus 1.3% in the group of vaginal delivery, demon-strating an increase in the absolute risk of 4.5%. Thus, 22 patients need to undergo cesarean section for a bleeding complication to occur (NNH=22). In the meta-analysis, the results of studies have shown that cesarean section on maternal request or without medical indication in-creases by 1.0% (95CI: 0.01 to 0.02; p<0.00001; I2=96%; Figure 1.1) the absolute risk of bleeding complications compared to planned vaginal delivery.
Effect of cesarean section on maternal request or without indication on infectious complications
The rate of infectious complications demonstrated by simple average in the group of cesarean delivery on ma-ternal request or without indication is 2.2 versus 0.5% in the group of planned vaginal delivery. The development of infectious complications after cesarean delivery was evaluated in five studies (B),3-8 which, in the meta-analy-sis demonstrated an increase of 1.0% (95CI: 0.01 to 0.01; p<0.00001; I2=98%; Figure 1.2) in absolute risk of infec-tious complications in the cesarean delivery group.
Effect of cesarean section on maternal request or without indication on wound complications
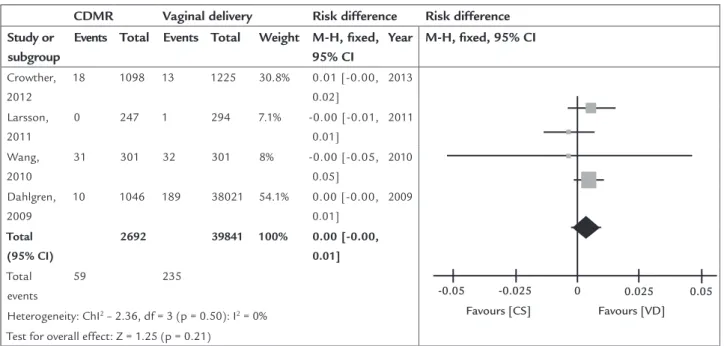
Four studies (B)3-7 evaluate the incidence of wound com-plications after cesarean or vaginal delivery. The incidence of wound complications obtained by simple average in the group of cesarean delivery on maternal request or without indication is 2.2%, while in the planned vaginal delivery group, it is 0.6%. However, there is no significant increase or decrease (95CI: -0.00 to 0.01; p=0.50; I2=0%; Figure 1.3) in the risk of wound complications between the groups ac-cording to the assessment made by the meta-analysis.
Effect of cesarean section on maternal request or without indi-cation on breastfeeding
The studies (B)5,9 assessed the association between cesare-an section on maternal request or without indication cesare-and complications in breastfeeding. The simple average of all
the studies revealed that the rate of breastfeeding compli-cations in the group of cesarean delivery on maternal re-quest is 8.4 versus 7.4% in the group of planned vaginal de-livery. Therefore, 100 patients are required to undergo cesarean delivery without medical indication so that one can present breastfeeding complications (NNH=100). The results demonstrate that cesarean delivery on maternal re-quest or without indication is associated with an increase of 2.0% (95CI: 0.02 to 0.03; p<0.00001; Figure 1.4) in the risk of complications related to exclusive breastfeeding.
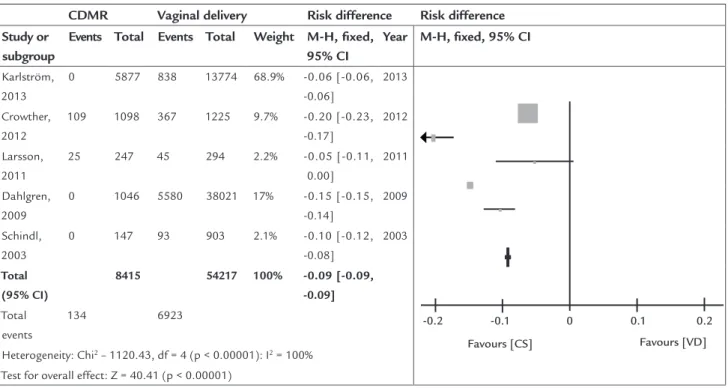
Incidence of emergency cesarean section without indication and planned vaginal delivery
Five studies (B)3-6,8 evaluate the progression to emergen-cy cesarean delivery from cesarean delivery on maternal request or without indication and vaginal delivery, so that the emergency cesarean delivery rate in the cesarean de-livery group maternal request is 1.6%, while in the group of planned vaginal delivery, the rate is 12.8% based on the evaluation of the simple average of all studies.
Vaginal delivery has a significant increase of 9.0% (95CI: -0.09 to -0.9; p<0.00001; I2=100%; Figure 2) in the absolute risk of progression to emergency cesarean deliv-ery compared to cesarean delivdeliv-ery without indication as demonstrated by the meta-analysis.
Effect of cesarean section on maternal request or without indi-cation on the Apgar score
Three studies (B)3-5 evaluated the influence of cesarean de-livery on maternal request on Apgar score. The group of cesarean delivery on maternal request has a lower incidence of Apgar score reduction compared to the group of planned vaginal delivery (0.47 versus 0.82%), according to the eval-uation of average for all the groups. Therefore, 286 patients are required to undergo cesarean delivery without medi-cal indication in order to one have one newborn with no reduction in Apgar score (NNT=286) (Table 6). The meta-analysis shows significant reduction in the absolute risk of 1.0% (95CI: -0.01 to -0.01; p<0.00001; I2=98%; Figure 3.1).
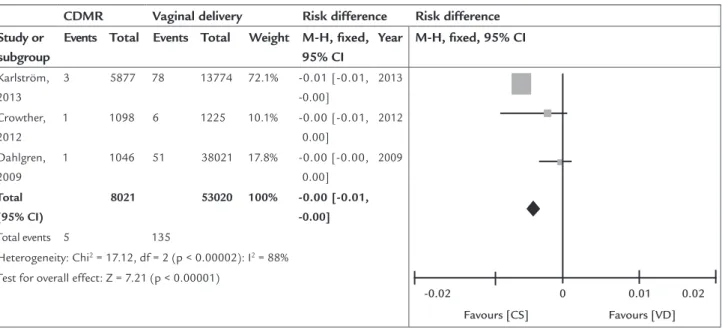
Effect of cesarean section on maternal request or without indi-cation on the occurrence of neonatal asphyxia
TABLE 4 Maternal complications.
C-section without medical indication n Vaginal delivery n p
Average gestational age (SD)
Karlström 2013 38.40 (±0.73) 5877 39.81 (±1.17) 12936 <0,0000001 Crowther 2012 38.8 (±0.7) 1098 40 (±1.1) 1225 <0,0000001 Liu 2012 40.2 (±1.0) 22462 40.1 (±1.0) 409242 <0.0000001
Larsson 2011 38 247 40 294
-Dahlgren 2009 38.56 (±0.91) 1046 39.29 (±1.11) 38021 <0,0000001
C-section without indication n RAPC Vaginal delivery n RAPV RRA(-)
ARA(+) CI
Maternal death
Crowther 2012 0 1098 0.0 0 1225 0.0 0.0
-Souza 2010 2 2685 0.07% 230 212847 0.11% -0.03% -0.14, 0.07 Dahlgren 2009 0 1046 0.0 0 38021 0.0 0.0
-Bleeding complications (%)
Karlström 2013 579 (9.9) 5877 9.85% 935 (6.8) 13774 6.79% 3.06% 2.19, 3.93
Crowther 2012 9 (0.8) 1098 0.82% 29 (2.4) 1225 2.37% -1.55% -2.55, -0.54
Larsson 2011 25 (10) 247 10.12% 41 (14) 294 13.95% -3.82% -9.28, 1.64 Souza 2010 27 (1.0) 2685 1.01% 3613 (1.4) 256518 1.41% -0.40% -0.78, -0.02
Wang 2010 12 (4.0) 301 3.99% 2 (0.6) 301 0.66% 3.32% 0.93, 5.71
Dahlgren 2009 3 (0.29) 1046 0.29% 123 (0.32) 38021 0.32% -0.04% -0.37, 0.29 Schindl 2003 0 (0.0) 147 0.0 17 (1.8) 903 1.88% -1.88% -2.77, -0.99
Infectious complications (%)
Karlström 2013 148 (2.5) 5877 2.52% 155 (1.1) 13774 1.12% 1.39% 0.95, 1.83
Larsson 2011 8 247 3.24% 8 294 2.72% 0.52% -2.37, 3.40 Wang 2010 7 (2.3) 301 2.33% 3 (1.0) 301 0.99% 1.33% -0.71, 3.37 Dahlgren 2009 1 (0.1) 1046 0.10% 104 (0.27) 38021 0.27% -0.18% -0.37, 0.02 Schindl 2003 0 (0.0) 147 0.0 1 (0.1) 903 0.11% -0.11% -0.33, 0.11
Wound complications (%)
Crowther 2012 18 (1.6) 1098 1.64% 13 (1.1) 1225 1.06% 0.58% -0.37, 1.53 Larsson 2011 0 (0.0) 247 0.0 1 (0.3) 294 0.34% -0.34% -1.01, 0.32 Wang 2010 31 301 10.3% 32 301 10.6% -0.33% -5.22, 4.56 Dahlgren 2009 10 (0.96) 1046 0.96% 189 (0.5) 38021 0.50% 0.46% -0.13, 1.05
Breastfeeding complications (%)
Karlström 2013 73 (1.2) 5877 1.24% 32 (0.2) 13774 0.23% 1.01% 0.71, 1.30
Liu 2012 2317 (10.3) 22462 10.32% 31211 (7.6) 409242 7.63% 1.35% 2.28, 3.09
P values < 0.05 and confidence intervals that exclude null values are in bold.
TABLE 5 Emergency C-section.
C-section without indication n RAPC Vaginal delivery n RAPV RRA(-)
ARA(+) CI
Karlström 2013 0 5877 0.0 838 13774 6.08% -6.08% -6.48, -5.68
Crowther 2012 109 (9.9) 1098 9.93% 367 (30) 1225 29.96% -20.0% -23.15, -16.92
Larsson 2011 25 (10) 247 10.12% 45 (15.4) 294 15.31% -5.18% -10.76, 0.39 Dahlgren 2009 0 (0.0) 1046 0.0 5580 (14.7) 38021 14.68% -14.7% -15.03, -14.32
Schindl 2003 0 (0.0) 147 0.0 93 (10.3) 903 10.3% -10.3% -12.28, -8.32
Effect of cesarean section on maternal request or without indi-cation on respiratory compliindi-cations
Four studies (B)3-5,8 assessed the respiratory complications of the newborn related to cesarean delivery on maternal request or without indication. The average obtained from all studies demonstrate that respiratory complications in the cesarean group total 3.1 versus 5.7% in the group of planned vaginal delivery (Table 6). However, the meta-anal-ysis shows that the cesarean delivery on maternal request is associated with a significant increase of 1.0% (95CI: 0.01
to 0.02; p<0.00001; I2=96%; Figure 3.3) in the absolute risk of the development of respiratory complications.
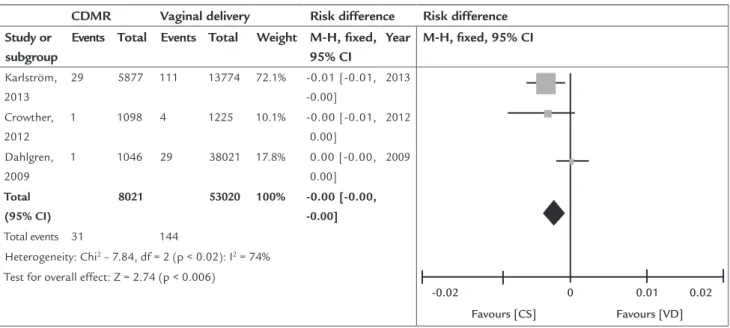
Effect of cesarean section on maternal request or without indi-cation on the rate of newborn infection
The average of infectious complications (B)3-5 in the group of cesarean delivery on maternal request is 0.4%, while in the group of planned vaginal delivery the rate of infection is 0.3% (Table 6). Although there are differences in favor of cesarean delivery, the meta-analysis shows no significant TABLE 6 Newborn complications.
C-section without indication n Vaginal delivery n p
Average birth weight (SD)
Karlström 2013 3558 (±448) 5877 3665 (±467) 12936 <0,0000001 Crowther 2012 3462 (±451) 1098 3571 (±495) 1225 <0,0000001 Liu 2012 3438 (±393) 22462 3332 (±375) 409242 <0.0000001
Larsson 2011 3339 247 3617 294 <0,001
Dahlgren 2009 3383.8 (±415.96) 1046 3531.4 (±441.85) 38021 <0,0000001
C-section without medical indication
n RAPC Vaginal delivery n RAPV RRA (-)
ARA (+) CI
Apgar score ≤ 7 (%)
Karlström 2013 38 (0.6) 5877 0.65% 252 (1.8) 13774 1.83% -1.18% -1.48, -0.88
Crowther 2012 0 (0.0) 1098 0.0 1 (0.1) 1225 0.08% -0.08% -0.24, 0.08 Larsson 2011 Average - Average
-Dahlgren 2009 0 (0.0) 1046 0.0 182 (0.48) 38021 0.48% -0.48% -0.55, -0.41
Respiratory complications (%)
Karlström 2013 159 5877 2.7% 153 13774 1.11% 1.59% 1.14, 2.04
Crowther 2012 2 1098 0.18% 1 (0.1) 1225 0.08% 0.10% -0.20, 0.40 Dahlgren 2009 91 1046 8.7% 2900 (7.63) 38021 7.63% 1.07% -0.65, 2.80 Schindl 2003 1 147 0.68% 0 (0.0) 903 0.0 0.68% -0.65, 2.01
Asphyxia (%)
Karlström 2013 3 (0.1) 5877 0.05% 78 (0.5) 13774 0.56% -0.51% -0.65, -0.38
Crowther 2012 1 (0.1) 1098 0.09% 6 (0.5) 1225 0.49% -0.40% -0.83, 0.03 Dahlgren 2009 1 (0.1) 1046 0.10% 51 (0.13) 38021 0.13% -0.04% -0.23, 0.15
Infection (%)
Karlström 2013 29 (0.5) 5877 0.11% 111 (0.8) 13774 0.0% 0.11% -0.11, 0.33 Crowther 2012 1 (0.1) 1098 0.09% 4 (0.3) 1225 0.33% -0.23% -0.60, 0.13 Dahlgren 2009 1 (0.1) 1046 0.09% 29 (0.08) 38021 0.08% 0.02% -0.17, 0.21
Admission to neonatal ICU (%)
Crowther 2012 4 (0.4) 1098 0.36% 7 (0.6) 1225 0.57% -0.21% -0.76, 0.34 Larsson 2011 13 (5.3) 247 5.26% 15 (5.1) 294 5.10% 0.16% -3.59, 3.91 Souza 2010 33 (1.2) 2685 1.23% 4532 (1.8) 256869 1.76% -0.53% -0.95, -0.11
Wiklund 2007 5 99 5.05% 12 237 5.06% -0.01% -5.15, 5.12 Schindl 2003 0 (0.0) 147 0.0 1 (0.1) 903 0.11% -0.11% -0.33, 0.11
reduction in the absolute risk of infection between the two groups (95CI: -0.00 to -0.00; p=0.02; I2=74%; Figure 3.4).
Effect of cesarean section on maternal request or without indi-cation on the rate of admission to neonatal ICU
The average hospital stay in neonatal ICU obtained from studies (B)2,4,6,8,10 evaluating this outcome is 1.2% in the ce-sarean group, versus 1.8% in the group of planned vaginal delivery (Table 6). Despite the fact that the group of cesar-ean delivery on maternal request has a lower rate of neo-natal ICU hospitalization compared to the group of planned vaginal delivery, based on the simple average of all studies, the meta-analysis shows that the reduction is not signifi-cant (95CI: -0.01 to -0.00; p=0.84; I2=0%, Figure 3.5).
F
INAL RECOMMENDATIONSThe authors conclude that cesarean delivery on maternal request or without indication increases the risk of bleed-ing, infectious, breastfeeding and respiratory complica-tions for the newborn. There was a reduction in the risk of emergency cesarean section and Apgar score ≤ 7 com-pared to planned vaginal delivery. Cesarean delivery on maternal request does not present significant increases or reductions in maternal mortality, post surgical wound complications, neonatal asphyxia, neonatal infection, and admission to neonatal ICU.
Based on this information and in the absence of ma-ternal and/or fetal indications for resolution by cesarean delivery, a vaginal birth should be safe and suitable for rec-ommendation to a pregnant woman. If, after the explana-tion of the risks and benefits of each obstetric resoluexplana-tion, showing every detail of the risks in each mode of delivery, the patient still rejects vaginal delivery, cesarean section should not be performed before 39 weeks of gestation. The cesarean delivery should be discouraged for patients who want more offspring, because of the risk of placenta accre-ta, low insertion of placenta and hysterectomies in subse-quent births; C-section should not be recommended as a painless option of delivery over vaginal delivery, either.
In this context, based on maternal request for cesarean section, the authors propose that the physician should try to know more deeply the personal values and preferences of the pregnant patient, addressing them in a process of shared decision-making (A)11 (D).12,13 Thus, the declared and underlying motivations of the patient can be investigated, including the intense fear of childbirth, also known as to-kophobia, and other factors associated with cesarean sec-tion on maternal request: previous complicated pregnancy; adverse experience in labor or delivery; anxious or avoidant personality traits; or history of sexual abuse (D)14,15 (B).16,17
Studies indicate that women undergoing cesarean at their own request have a higher frequency of psychopatho-logical manifestations and psychiatric diseases. Specifical-ly, a recent meta-analysis identified prevalence in the com-munity of three percent for postpartum post-traumatic stress disorder (A).18 Cesarean section may be regarded by some patients as a resource to alleviate the suffering derived from anxious or depressive symptoms. Therefore, it is rec-ommended that the doctor is also aware of the need for eval-uation and treatment by a psychiatrist and/or psychologist with expertise in perinatal mental health.
R
EFERENCES1. NIH State-of-the-Science Conference Statement on cesarean delivery on maternal request. NIH Consens Sci Statements. 2006; 23(1):1-29. 2. Souza JP, Gülmezoglu A, Lumbiganon P, Laopaiboon M, Carroli G, Fawole
B, Ruyan P; WHO Global Survey on Maternal and Perinatal Health Research Group. Caesarean section without medical indications is associated with an increased risk of adverse short-term maternal outcomes: the 2004-2008 WHO Global Survey on Maternal and Perinatal Health. BMC Med. 2010; 8:71. 3. Dahlgren LS, von Dadelszen P, Christilaw J, Janssen PA, Lisonkova S,
Marquette GP, Liston RM. Caesarean section on maternal request: risks and benefits in healthy nulliparous women and their infants. J Obstet Gynaecol Can. 2009; 31(9):808-17.
4. Crowther CA, Dodd JM, Hiller JE, Haslam RR, Robinson JS; Birth After Caesarean Study Group. Planned vaginal birth or elective repeat caesarean: patient preference restricted cohort with nested randomised trial. PLoS Med. 2012; 9(3):e1001192.
5. Karlström A, Lindgren H, Hildingsson I. Maternal and infant outcome after caesarean section without recorded medical indication: findings from a Swedish case-control study. BJOG 2013; 120:479-86.
6. Larsson C, Saltvedt S, Wiklund I, Andolf E. Planned vaginal delivery versus planned caesarean section: short-term medical outcome analyzed according to intended mode of delivery. J ObstetGynaecol Can. 2011; 33(8):796-802. 7. Wang BS, Zhou LF, Coulter D, Liang H, Zhong Y, Guo YN, et al. Effects of caesarean
section on maternal health in low risk nulliparous women: a prospective matched cohort study in Shanghai, China. BMC Pregnancy Childbirth. 2010; 10:78. 8. Schindl M, Birner P, Reingrabner M, Joura E, Husslein P, Langer M. Elective
cesarean section vs. spontaneous delivery: a comparative study of birth experience. Acta Obstet Gynecol Scand. 2003; 82(9):834-40.
9. Liu X, Zhang J, Liu Y, Li Y, Li Z. The association between cesarean delivery on maternal request and method of newborn feeding in China. PLoS One. 2012; 7(5):e37336.
10. Wiklund I, Edman G, Ryding EL, Andolf E. Expectation and experiences of childbirth in primiparae with caesarean section. BJOG. 2008; 115(3):324-31. 11. Lavender T, Hofmeyr GJ, Neilson JP, Kingdon C, Gyte GML. Caesarean section for non-medical reasons at term. Cochrane Database Syst Rev. 2012; (3):CD004660. 12. American College of Obstetricians and Gynecologists. Cesarean delivery on maternal request. Committee Opinion. Obstet Gynecol. 2013; 121:904-7. 13. ACOG Committee Opinion No. 578: Elective surgery and patient choice.
Obstet Gynecol. 2013; 122(5):1134-8. PubMed PMID: 24150029. 14. D’Souza R, Arulkumaran S. To ‘C’ or not to ‘C’? Caesarean delivery upon
maternal request: a review of facts, figures and guidelines. J Perinat Med. 2013; 41(1):5-15. PubMed PMID: 23314510.
15. Hofberg K, Ward MR. Fear of pregnancy and childbirth. Postgrad Med J. 2003; 79(935):505-10, PubMed PMID: 13679545.
16. Rouhe H, Salmela-Aro K, Gissler M, Halmesmäki E, Saisto T. Mental health problems common in women with fear of childbirth. BJOG. 2011; 118(9):1104-11. PubMed PMID: 21489127.
17. Sydsjö G, Möller L, Lilliecreutz C, Bladh M, Andolf E, Josefsson A. Psychiatric illness in women requesting caesarean section. BJOG. 2015; 122(3):351-8. PubMed PMID: 24628766.
A
PPENDIXMeta-analysis charts
CDMR Vaginal delivery Risk difference Risk difference
Study or subgroup
Events Total Events Total Weight M-H, fixed, 95%
CI
Year M-H, fixed, 95% CI
Karlström, 2013
579 5877 935 13774 46.9% 0.03 [0.02, 0.04] 2013
-0.05 -0.025 0 0.05
Favours [CS] Favours [VD] 0.025
Crowther, 2012
9 1098 29 1225 6.6% -0.02 [-0.03, -0.01] 2012
Larsson, 2011
25 247 41 294 1.5% -0.04 [-0.09, 0.02] 2011
Wang, 2010 12 301 2 301 1.7% 0.03 [0.01, 0.06] 2010 Souza, 2010 27 2685 2138 212590 30.2% -0.00 [-0.00, 0.00] 2010 Dahlgren,
2009
10 1046 189 38021 11.6% 0.00 [-0.00, 0.01] 2009
Schindl, 2003
10 147 17 903 1.4% -0.02 [-0.03, -0.01 2003
Total (95% CI)
11401 267108 100% 0.01 [0.01, 0.02]
Total events 662 3351
Heterogeneity: Chi2 – 135.12, df = 6 (p < 0.00001): I2 = 96%
Test for overall effect: Z = 5.99 (p < 0.00001)
FIGURE 1.1 Bleeding complications.
CDMR Vaginal delivery Risk difference Risk difference
Study or subgroup
Events Total Events Total Weight M-H, fixed,
95% CI
Year M-H, fixed, 95% CI
Karlström, 2013
148 5877 155 13774 74.2% 0.01 [0.01, 0.02]
2013
-0.05 0 0.05
Favours [CS] Favours [VD] 0.025
Larsson, 2011
8 247 8 294 2.4% 0.01 [-0.02, 0.03]
2011
Wang, 2010
7 301 3 301 2.7% 0.01 [-0.01, 0.03]
2010
Dahlgren, 2009
1 1046 104 38021 18.3% -0.00 [-0.00, 0.00]
2009
Schindl, 2003
0 147 1 903 2.3% -0.00 [-0.01, 0.01
2003
Total (95% CI)
7618 53293 100% 0.01 [0.01, 0.01]
Total events
164 271
Heterogeneity: Chi2 – 160.55, df = 4 (p < 0.00001): I2 = 98%
Test for overall effect: Z = 6.05 (p < 0.00001)
CDMR Vaginal delivery Risk difference Risk difference Study or
subgroup
Events Total Events Total Weight M-H, fixed,
95% CI
Year M-H, fixed, 95% CI
Crowther, 2012
18 1098 13 1225 30.8% 0.01 [-0.00, 0.02]
2013
-0.05 0 0.05
Favours [CS] Favours [VD] 0.025 -0.025
Larsson, 2011
0 247 1 294 7.1% -0.00 [-0.01, 0.01]
2011
Wang, 2010
31 301 32 301 8% -0.00 [-0.05, 0.05]
2010
Dahlgren, 2009
10 1046 189 38021 54.1% 0.00 [-0.00, 0.01]
2009
Total (95% CI)
2692 39841 100% 0.00 [-0.00, 0.01]
Total events
59 235
Heterogeneity: ChI2 – 2.36, df = 3 (p = 0.50): I2 = 0%
Test for overall effect: Z = 1.25 (p = 0.21)
FIGURE 1.3 Wound complications.
CDMR Vaginal delivery Risk difference Risk difference
Study or subgroup
Events Total Events Total Weight M-H, fixed,
95% CI
Year M-H, fixed, 95% CI
Karlström, 2013
73 5877 32 13774 16.2% 0.01 [0.01, 0.01]
2013
-0.05 0 0.05
Favours [CS] Favours [VD] 0.025
Liu, 2012 2317 22462 31211 409242 83.8% 0.03 [0.02, 0.03]
2012
Total (95% CI)
28339 423016 100% 0.02 [0.02, 0.03]
Total events
2390 31243
Heterogeneity: Chi2 = 89.46, df = 1 (p < 0.00001): I2 = 99%
Test for overall effect: Z = 13.79 (p < 0.00001)
CDMR Vaginal delivery Risk difference Risk difference Study or
subgroup
Events Total Events Total Weight M-H, fixed,
95% CI
Year M-H, fixed, 95% CI
Karlström, 2013
0 1046 182 38021 17.8% -0.00 [-0.01, -0.00]
2013
-0.05 0 0.025 0.05
Favours [CS] Favours [VD]
Crowther, 2012
38 5877 252 13774 72.1% -0.01 [-0.01, -0.01]
2012
Dahlgren, 2009
0 1098 1 1225 10.1% -0.00 [-0.00, -0.00]
2009
Total (95% CI)
8021 53020 100% -0.01 [-0.01, -0.01]
Total events
38 435
Heterogeneity: Chi2 = 92.86, df = 2 (p < 0.00001): I2 = 98%
Test for overall effect: Z = 8.37 (p < 0.00001)
FIGURE 3.1 Decrease in Apgar score.
CDMR Vaginal delivery Risk difference Risk difference
Study or subgroup
Events Total Events Total Weight M-H, fixed,
95% CI
Year M-H, fixed, 95% CI
Karlström, 2013
0 5877 838 13774 68.9% -0.06 [-0.06, -0.06]
2013
-0.2 -0.1 0 0.1 0.2
Favours [CS] Favours [VD]
Crowther, 2012
109 1098 367 1225 9.7% -0.20 [-0.23, -0.17]
2012
Larsson, 2011
25 247 45 294 2.2% -0.05 [-0.11, 0.00]
2011
Dahlgren, 2009
0 1046 5580 38021 17% -0.15 [-0.15, -0.14]
2009
Schindl, 2003
0 147 93 903 2.1% -0.10 [-0.12, -0.08]
2003
Total (95% CI)
8415 54217 100% -0.09 [-0.09, -0.09]
Total events
134 6923
Heterogeneity: Chi2 – 1120.43, df = 4 (p < 0.00001): I2 = 100%
Test for overall effect: Z = 40.41 (p < 0.00001)
CDMR Vaginal delivery Risk difference Risk difference Study or
subgroup
Events Total Events Total Weight M-H, fixed,
95% CI
Year M-H, fixed, 95% CI
Karlström, 2013
3 5877 78 13774 72.1% -0.01 [-0.01, -0.00]
2013
-0.02 0 0.01 0.02
Favours [CS] Favours [VD]
Crowther, 2012
1 1098 6 1225 10.1% -0.00 [-0.01, 0.00]
2012
Dahlgren, 2009
1 1046 51 38021 17.8% -0.00 [-0.00, 0.00]
2009
Total (95% CI)
8021 53020 100% -0.00 [-0.01, -0.00]
Total events 5 135
Heterogeneity: Chi2 = 17.12, df = 2 (p < 0.00002): I2 = 88%
Test for overall effect: Z = 7.21 (p < 0.00001)
FIGURE 3.2 Neonatal asphyxia.
CDMR Vaginal delivery Risk difference Risk difference
Study or subgroup
Events Total Events Total Weight M-H, fixed,
95% CI
Year M-H, fixed, 95% CI
Karlström, 2013
159 5877 153 13774 70.5% 0.02 [0.01, 0.02]
2013
-0.05 0 0.025 0.05
Favours [CS] Favours [VD]
Crowther, 2012
2 1098 1 1225 9.9% 0.00 [-0.00, 0.00]
2012
Dahlgren, 2009
91 1046 2900 38021 17.4% 0.01 [-0.01, 0.03]
2009
Schindl, 2003
1 147 0 903 2.2% 0.01 [-0.01, 0.02]
2003
Total (95% CI)
8168 53923 100% 0.01 [0.01, 0.02]
Total events 253 3054
Heterogeneity: Chi2 – 67.71, df = 3 (p < 0.00001): I2 = 96%
Test for overall effect: Z = 5.95 (p < 0.00001)
CDMR Vaginal delivery Risk difference Risk difference Study or
subgroup
Events Total Events Total Weight M-H, fixed,
95% CI
Year M-H, fixed, 95% CI
Crowther, 2012
4 1098 7 1225 16.2% -0.00 [-0.01, 0.00]
2012
0.05
-0.05 0 0.025
Favours [CS] Favours [VD]
Larsson, 2011
13 247 15 294 3.8% 0.00 [-0.04, 0.04]
2011
Souza, 2010
33 2685 4532 256869 74.5% -0.01 [-0.01, -0.00]
2010
Wiklund, 2007
5 99 12 237 2% -0.00 [-0.05, 0.05]
2007
Schindl, 2003
0 147 1 903 3.5% -0.00 [-0.01, 0.01]
2003
Total (95% CI)
4276 259528 100% -0.00 [-0.01, -0.00]
Total events 55 4567
Heterogeneity: Chi2 = 1.40, df = 4 (p = 0.84): I2 = 0%
Test for overall effect: Z = 2.28 (p = 0.02)
FIGURE 3.5 Admission to neonatal ICU.
CDMR Vaginal delivery Risk difference Risk difference
Study or subgroup
Events Total Events Total Weight M-H, fixed,
95% CI
Year M-H, fixed, 95% CI
Karlström, 2013
29 5877 111 13774 72.1% -0.01 [-0.01, -0.00]
2013
0.02
-0.02 0 0.01
Favours [CS] Favours [VD]
Crowther, 2012
1 1098 4 1225 10.1% -0.00 [-0.01, 0.00]
2012
Dahlgren, 2009
1 1046 29 38021 17.8% 0.00 [-0.00, 0.00]
2009
Total (95% CI)
8021 53020 100% -0.00 [-0.00, -0.00]
Total events 31 144
Heterogeneity: Chi2 – 7.84, df = 2 (p < 0.02): I2 = 74%
Test for overall effect: Z = 2.74 (p < 0.006)