Inappropriate eating behavior: a longitudinal study with female adolescents
Comportamento alimentar inadequado: uma investigação longitudinal com adolescentes do sexo femininoComportamiento alimentar inadecuado: una investigación longitudinal con adolescentes del sexo femenino
Leonardo de Sousa Fortes1, Sebastião de Sousa Almeida2, Flávia Marcele Cipriani3, Maria Elisa C. Ferreira1
Instituição: Faculdade de Educação Física e Desportos da Universidade Federal de Juiz de Fora (UFJF), Juiz de Fora, MG, Brasil
1UFJF, Juiz de Fora, MG, Brasil
2Universidade de São Paulo (USP), Ribeirão Preto, SP, Brasil
3Pontifícia Universidade Católica de Minas Gerais (PUC-MG), Juiz de Fora,
MG, Brasil ABSTRACT
Objective: To evaluate the inappropriate eating behaviors
(IEB) of female adolescents over a one-year period.
Methods: 290 adolescents aged between 11 and 14 years
old participated in the three research stages (T1: first four months, T2: second four months and T3: third four months). The Eating Attitudes Test (EAT-26) was applied to assess the IEB. Weight and height were measured to calculate body mass index (BMI) in the three study periods. Analysis of variance for repeated measures was used to analyze the data, adjusted for the scores of the Body Shape Questionnaire and the Brazil Economic Classification Criteria.
Results: Girls at T1 showed a higher frequency of IEB
compared to T2 (p=0.001) and T3 (p=0.001). The findings also indicated higher values for BMI in T3 in relation to T1 (p=0.04). The other comparisons did not show statistically significant differences.
Conclusions: IEB scores of female adolescents declined
over one year.
Key-words: feeding behavior; adolescent; eating
disorders.
RESUMO
Objetivo: Avaliar os comportamentos alimentares
ina-dequados (CAI) de adolescentes do sexo feminino ao longo de um ano.
Métodos: Participaram das três etapas (T1: primeiro
quadrimestre, T2: segundo quadrimestre e T3: terceiro quadrimestre) da pesquisa 290 jovens de 11 a 14 anos. Utilizou-se o Eating Attitudes Test (EAT-26) para avaliar os CAI. Peso e estatura foram aferidos para calcular o índice de massa corpórea (IMC) nas três etapas. Os escores do
Body Shape Questionnaire e dos Critérios de Classificação Econômica Brasil foram controlados nas análises estatís-ticas. Utilizou-se a ANOVA de medidas repetidas para analisar os dados.
Resultados: Evidenciou-se que, em T1, as meninas
de-monstraram maior frequência de CAI quando comparadas a T2 (p=0,001) e T3 (p=0,001). Além disso, os achados indica-ram maior valor para o IMC em T3 em relação a T1 (p=0,04). As demais comparações em razão da etapa da investigação não apontaram diferenças estatisticamente significativas.
Conclusões: Concluiu-se que os escores de CAI de
adoles-centes do sexo feminino diminuiram no decorrer de um ano.
Palavras-chave: comportamento alimentar; adolescente;
transtornos da alimentação.
RESUMEN
Objetivo: Evaluar los comportamientos alimentares
inadecuados (CAI) de adolescentes del sexo femenino a lo largo de un año.
Métodos: Participaron de las tres etapas (T1: primer
cuadri-mestre; T2: segundo cuadrimestre y T3: tercero cuadrimestre)
Endereço para correspondência: Leonardo de Sousa Fortes
Rua Hameleto Fellet, 20/201 – Vale do Ipê CEP 36036-130 – Juiz de Fora/MG E-mail: [email protected]
Conflito de interesse: nada a declarar
de la investigación 290 jóvenes de 11 a 14 años. Se utilizó el Eating Attitudes Test (EAT-26) para evaluar los CAI. Peso y estatura fueron verificados para calcular el índice de masa corporal (IMC) en las tres etapas. Los escores del Body Shape Questionnaire y de los Criterios de Clasificación Económica Brasil fueron controlados en los análisis estadísticos. Se utilizó ANOVA de medidas repetidas para analizar los datos.
Resultados:Se evidenció que, en T1, las muchachas
de-mostraron mayor frecuencia de CAI cuando comparadas a T2 (p=0,001) y T3 (p=0,001). Además, los hallazgos indicaron mayor valor para el IMC en T3 respecto a T1 (p=0,04). Las demás comparaciones respecto a la etapa de la investigación no mostraron diferencias estadísticamente significativas.
Conclusiones: Se concluyó que los escores de CAI de
adolescentes del sexo femenino se redujeron en el periodo de un año.
Palabras clave: comportamiento alimentar; adolescente;
trastornos de la alimentación.
Introduction
Inappropriate eating behaviors (IAB) are considered del-eterious health behaviors(1,2). Examples of IAB: self-induced vomiting, food restriction for long periods, use of laxatives, diuretics, anabolic-androgenic steroids, among others(3). According to Rodgers, Chabrol, and Paxton(4), subjects diag-nosed with eating disorders (EDs), such as anorexia nervosa and bulimia nervosa, use IEBs to reduce or maintain body weight. Evidence indicates low prevalence of IEB in the Brazilian population(5,6). However, the prevalence of these behaviors can be pronounced in the teenage population(7,8). More speciically, indings show that women are more likely to adopt IEB as a regular habit(9,10).
Adolescence is the period comprised between 10 and 19 years of age, according to the World Health Organization(11). At this stage, young girls undergo numer-ous physical, sociological, and psychological changes(12,13). For instance, some maturational events, such as menarche and peak height velocity, are considered remarkable char-acteristics of adolescence(14); moreover, evidence suggests increased body fat in females throughout adolescence(14,15). Nevertheless, it is noteworthy that the morphological pat-tern socially promoted in Wespat-tern culture is inversely pro-portional to what young girls demonstrate on this phase of life, because, if, on the one hand, the maturational process impacts the increase in body fat, on the other, the media
conveys the message that the skinny body is the socially accepted standard(16). In this sense, it is likely that some adolescents feel pressured and adopt IEBs as an alternative measure to reduce body fat.
The scientiic literature has shown some factors associated with IEB, such as: body dissatisfaction, socioeconomic status, and body mass index (BMI), among others(8-10). However, a large portion of these studies used a cross-sectional design as an investigative method. According to some authors, cross-sectional studies, although important, do not allow causal interferences(4). This means that there is no way to assess the degree of intensity and the direction of the associations between the outcome of the study and the independent variables. It is noteworthy, still, that very few studies in the area of IEB used a longitudinal design(1,4,16); however, none was conducted with young Brazilians. Furthermore, we emphasize that few investigations have been concerned with controlling external variables that could inluence the IEBs somehow. Thus, it is suggested that body dissatisfaction, socioeconomic status, and BMI be controlled in studies that use IEB as a variable-criterion(15). Given these arguments, the objective of this study was to evaluate the IEBs of female adolescents over a period of 1 year.
Therefore, some hypothesis were formulated based on previous studies(1,4): 1) there is an increased prevalence of IEB indicating risk for EDs among adolescents in the course of a year; 2) the frequency of IEB increases over a year.
Method
The present investigation was a longitudinal, school-based study, conducted in 2012 in the municipality of Juiz de Fora, state of Minas Gerais, with female adolescents in the age range between 11–14 years.
According to information from the Department of Education of Juiz de Fora (www.pjf.mg.gov.br/se), the popu-lation of female adolescents in the age range of the study, enrolled in municipal schools in 2011, was of approximately 20,000 students. Thus, sample size calculation was per-formed with the following criteria, according to recommen-dations by Alves et al(17): prevalence of 20% for IEB accord-ing to indaccord-ings by Scherer et al(10) and Martins et al(9), 95% conidence, 5% sampling error, and 1.2 for design effect, totaling thus, 246 young girls composing a representative sample of the population in question.
municipality of Juiz de Fora (north, south, and center) and the type of governmental involvement (public or private), and then, distributed in elementary schools. The selection occurred randomly through simple drawing, in two stages. First, the draw of schools was held in each region and then the draw of teens in these units. The schools were selected with the help provided by the statistics unit of the Department of Education of the state of Minas Gerais. The inal sample of the survey was distributed in six different collection points (schools) and consisted of adolescents attending the school on the days of collection.
The study included only the girls who handed over the free informed consent signed by the parents or guardians and who were regularly enrolled in elementary school in the municipality of Juiz de Fora in 2012.
There were 368 female participants, and 78 were ex-cluded for not completing the questionnaire in full or not participating in the anthropometric assessments in the three stages of the research or, for being absent in some stage of the research. In stage 1 (T1: irst four months), 368 girls were assessed. In stage 2 (T2: second four-month period), there was a sample loss of 42 adolescents. Then, in stage 3 (T3: third quadrimester), 36 students were excluded.
The instruments used for the study were the Eating Attitudes Test (EAT-26), the Body Shape Questionnaire (BSQ), besides the Brazilian Economic Classification Criterion(BECC), and anthropometric measurements.
We used the EAT-26 to assess IEBs. It is a self-report tool with 26 items, with responses in Likert-like scale (0: never, almost never, or rarely, 1: sometimes, 2: many times, 3: al-ways ), and the question number 25 presents reversed score. These questions are divided into three subscales, namely: 1) diet – related to the pathological refusal of foods with high calories and concern with physical appearance; 2) bu-limia and preoccupation with food - refers to episodes of binge eating followed by purging behaviors for loss/control weight; and 3) oral self-control — relects self-control in relation to food and evaluates environmental and social forces stimulating food intake. Scores equal to or greater than 21 indicate risk behavior for EDs. We used the version of the EAT-26 proposed for females(18). The authors performed the translation and back-translation of the instrument and obtained a Cronbach’s alpha of 0.82, indicating its use for studies with similar samples. In order to prove the suitability of the instrument to this sample, we calculated the internal consistency of the EAT-26, obtaining a Cronbach’s alpha value ranging from 0.83 to 0.89 in all stages of the research.
The BSQ is a self-report instrument consisting of 34 questions in the form of Likert scale of points, ranging from 1 – never, to 6 – always, seeking to evaluate the frequency of concern/ dissatisfaction that the young has with weight and physical appearance, i.e., body dissatisfaction. The higher the score, the greater the depreciation the assessed has with his or her body appearance. This questionnaire has been validated for the Brazilian adolescent population(19), showing good psychometric properties. For this sample, the internal consistency was calculated by Cronbach’s alpha, obtaining a satisfactory value from 0.86 to 0.92 in all stages of the research. Considering that body dissatisfaction can inlu-ence IEB(4,10), we chose to control the scores of the BSQ in the data analysis.
Socioeconomic status was obtained by applying the BECC, developed by the Brazilian Association of Research Companies(20). The BECC emphasizes its function of esti-mating the purchasing power of people and urban families, abandoning the pretension of classifying the population in terms of “social classes”. This instrument assesses the amount of comfort items (car, refrigerator, television, etc.) purchased, and identiies the level of education of the household head. The higher the score, the higher the socioeconomic level. Because some studies demonstrate the inluence of socio-economic status on IEB(4,16) and the present investigation includes participants with possible differences in socioeco-nomic status (public schools versus private schools), it was decided to enter the scores of the CCEB as a covariate in the statistical analyzes.
Anthropometric data were collected by the same evalu-ator, who was trained for this measurement. Body mass was measured with a portable digital scale (Tanita®) with 100g precision and maximum capacity of 200kg. We used a portable stadiometer with precision of 0.1cm and maximum height of 2.20m (Welmy®) to measure the height of adolescents, according to the methodology pro-posed by the International Society for Advancement for Kineanthropometry(21). We obtained BMI by calculating: BMI=body mass index (kg)/height (m²). By criterion of reliability, we decided to calculate the curve of BMI for age, following the procedures previously performed in another study(22), with the purpose to check whether the results would be the same. Thus, the results indicated no statistical differ-ences in any of the stages of the investigation.
six (three from public and three from private institutions) agreed to participate, and, once we had the authorizations, meetings were held with each class in order to explain the objectives and procedures for inclusion of adolescents in the study. The term of free and informed consent was handed to the adolescents, and we asked them to return them signed by parents or guardians in the following week, in case of assent of their voluntary participation.
The research was divided into two moments. In the irst one, the students completed the instruments (EAT-26, BSQ, and CCEB), and a qualitative questionnaire to identify de-mographic data (age). This stage was performed in group, by a single researcher, who standardized verbal explanations in an attempt to avoid intra-rater interference.
After the questionnaires were completed, the students were led into another room, dressed in the uniform for Physical Education classes and barefoot. In this second stage, anthropometric data were measured individually and only one student was allowed in the room at a time. These procedures were repeated three times throughout the year 2012, with a four-month interval between assessments (February – T1, June – T2, and October – T3).
This study was approved by the Research Ethics Committee of Universidade Federal de Juiz de Fora (proto-col 2282.022.2011), according to the law n. 196/96 of the National Health Council.
In the statistical analysis, we used the Kolmogorov-Smirnov test to assess the distribution of the data. Due to the non-parametric violation, we used measures of central tendency (mean), dispersion (minimum, maximum, standard deviation, and error), and frequency to describe the research variables. We used de Student’s t test to compare the scores of the EAT-26 in relation to governmental involvement (private and public) in the three stages of the research. We used Pearson’s correlation to associate the EAT-26 scores with all the independent variables (age, weight, height, BMI, BSQ, and CCEB) in the three stages of investigation. We used Person’s chi-square for a variable in order to compare the prevalence of IEB in relation to time (T1, T2, and T3). We conducted analysis of variance for repeated measures (ANOVA) to compare age, weight, height, and BMI in rela-tion to time (T1, T2 and T3). The same analysis was applied to compare the scores of the EAT-26 for each of the stages of the research (T1, T2 and T3), using age, BSQ, BECC, and BMI as covariates. We used the Bonferroni post hoc test to identify statistical differences. All data were processed in the Statistical Package for the Social Sciences (SPSS) 17.0, and statistical signiicance was established at 5%.
Results
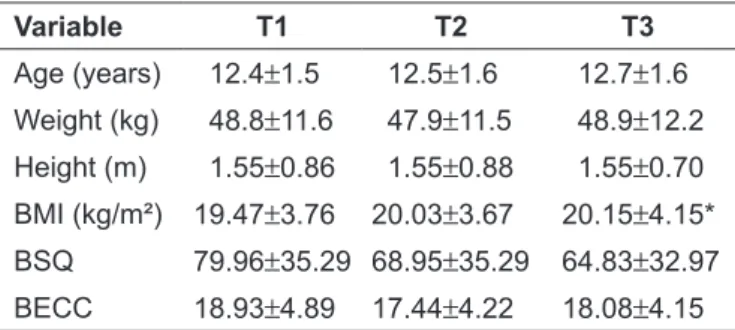
There were 290 female adolescent participants in total, whose means for age, weight, height, BMI, BSQ, and BECC are described in Table 1.
In T1, there were 368 girls stratiied according to age as follows: 95 with 11 years, 92 with 12 years, 89 with 13 years, and 92 with 14 years. In T2, there was a sample loss of 42 girls, and the remaining 326 were distributed according to age as follows: 86 with 11 years, 83 with 12 years, 72 with 13 years, and 85 with 14 years. Finally, it T3, there was a new loss of 36 students. Thus, the distribution of the 290 adolescents according to age was the following: 80 with 11 years, 72 with 12 years, 57 with 13 years, and 81 with 14 years.
Regarding minimum and maximum values of the an-thropometric variables in relation to time, the results are presented in Table 2. Changes were demonstrated in the dispersions of these variables in the three moments (T1, T2, and T3).
Table 1 - Descriptive variables of the sociodemographic and anthropometric variables according to time (T1, T2 and T3). Juiz de Fora, 2012
Variable T1 T2 T3
Age (years) 12.4±1.5 12.5±1.6 12.7±1.6
Weight (kg) 48.8±11.6 47.9±11.5 48.9±12.2
Height (m) 1.55±0.86 1.55±0.88 1.55±0.70
BMI (kg/m²) 19.47±3.76 20.03±3.67 20.15±4.15*
BSQ 79.96±35.29 68.95±35.29 64.83±32.97
BECC 18.93±4.89 17.44±4.22 18.08±4.15
*p<0.05 in relation to T1; Values presented as mean±standard deviation T1: Stage 1; T2: Stage 2; T3: Stage 3; BMI: body mass index; BSQ: Body Shape Questionnaire; BECC: Brazilian Economic Classiication Criterion
Table 2 - Minimum and maximum anthropometric variables in relation to time. Juiz de Fora, 2012
Variable T1 T2 T3
Min Max Min Max Mín Max
Weight (kg) 21.7 84.5 23.2 89.0 25.0 93.3
Height (m) 1.24 1.76 1.27 1.80 1.30 1.72
BMI (kg/m²) 12.8 31.8 13.2 32.5 13.1 34.1
Regarding the comparisons of the EAT-26 scores in rela-tion to governmental involvement, the indings indicated no statistically signiicant differences in T1 (F(1. 367)=3.24;
t=1.6; p=0.023); T2 (F(1. 325)=2.95; t=1.41; p=0.27) and T3 (F(1. 289)=2.63; t=1.79; p=0.34).
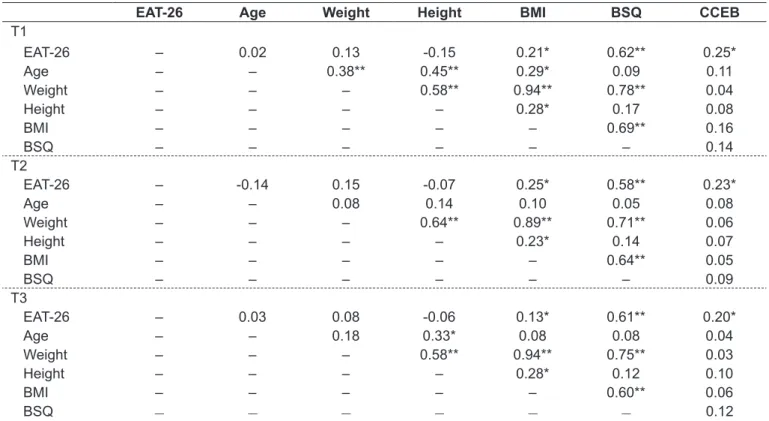
The associations of the EAT-26 scores with the inde-pendent variables of the survey can be seen in Table 3. We highlight the signiicant associations found between the scores of the EAT-26 with BMI and the scores of BSQ and BECC in the three moments of the investigation.
The prevalences of the EAT-26 classiications according to the moment (T1, T2 and T3) are described in Table 4. There are differences in the classiication “EAT≥21” between T1 and T2 (χ²=13.41; p=0.01) and T1 and T3 (χ²=17.33; p=0.01).
Regarding the comparison of the scores of the EAT-26 and BMI according to T1, T2 and T3, we identiied im-portant results (Table 4): 1) It was proved that, in T1, girls demonstrated higher frequency of IEB when compared to T2 (p=0.001) and T3 (p=0.001); 2) the indings indicated a greater value for BMI in T3 in relation to T1 (p=0.04). The other comparisons due to the stage of the investigation did not show statistically signiicant differences. It is noteworthy, however, that the ANOVA for repeated measures indicated that BMI, BSQ, and BECC were related to the EAT-26 scores. In contrast, age showed no collinearity with the IEBs.
Table 4 - Distribution of the prevalence of the Eating Attitudes Test ratings and description of test scores (mean and standard deviation) according to time. Juiz de Fora, 2012
Variable T1 T2 T3
Prevalence (%) of classiications
EAT-26<21 75.9 90.4 94.8
EAT-26≥21 21.2* 9.6 5.2**
Mean (SD) of EAT-26
EAT-26 15.88 (1.06)* 11.88 (1.26) 11.75 (1.36)**
*p<0.05 in relation to T2; **p<0.05 in relation to T1. T1: Stage 1; T2: Stage 2; T3: Stage 3
Table 3 - Associations between the Eating Attitudes Test scores and the independent variables in the three stages of the research. Juiz de Fora, 2012
EAT-26 Age Weight Height BMI BSQ CCEB
T1
EAT-26 – 0.02 0.13 -0.15 0.21* 0.62** 0.25*
Age – – 0.38** 0.45** 0.29* 0.09 0.11
Weight – – – 0.58** 0.94** 0.78** 0.04
Height – – – – 0.28* 0.17 0.08
BMI – – – – – 0.69** 0.16
BSQ – – – – – – 0.14
T2
EAT-26 – -0.14 0.15 -0.07 0.25* 0.58** 0.23*
Age – – 0.08 0.14 0.10 0.05 0.08
Weight – – – 0.64** 0.89** 0.71** 0.06
Height – – – – 0.23* 0.14 0.07
BMI – – – – – 0.64** 0.05
BSQ – – – – – – 0.09
T3
EAT-26 – 0.03 0.08 -0.06 0.13* 0.61** 0.20*
Age – – 0.18 0.33* 0.08 0.08 0.04
Weight – – – 0.58** 0.94** 0.75** 0.03
Height – – – – 0.28* 0.12 0.10
BMI – – – – – 0.60** 0.06
BSQ
–
–
–
–
–
–
0.12Discussion
The present study aimed to evaluate IEBs of female adolescents throughout a year. The indings, in general, showed a reduction in the frequency and prevalence of IEB in the course of a year. It should be noted that the choice of investigating adolescents in the age range of 11-14 years was due to the fact that the scientiic literature mentions this phase as the most susceptible to the triggering of EDs(15,22,23).
Regarding the prevalence of IEB, the indings of the present investigation point statistically signiicant differences in the period of a year. Contrary to what the scientiic literature has shown(1,16), there was a reduction in the prevalence of IEB from T1 to T2. Similarly, we found a lower prevalence of IEB in T3 compared to T1. These results indicate that girls showed reduced risk for EDs through the year 2012. Two possibilities can explain these indings: 1) the adolescents omitted the real answers on the EAT-26 in T2 and T3; or 2) the advancement of female adolescence can be considered a protective factor against the IEB. In other words, adolescents, after T1, for having ac-quired knowledge about what the EAT-26 seeks to evaluate, may have omitted their eating problems in stages T2 and T3. On the other hand, there is the possibility of younger girls having increased risks for IEB. In this sense, the progression of puberty could reduce the prevalence of female adolescents who adopt IEB as a daily habit. Evidence has pointed younger girls as being more prone to IEB(4,15). It should be noted, however, that females during adolescence have a close relation with the increase in body fat, a morphological aspect that is depreciated in Western culture(13). Therefore, young girls see IEBs as a method for rapid reduction of body fat.
Regarding the comparison of the EAT-26 scores in the stages of the research, the indings showed differences. Adolescents showed higher frequency of IEB in T1 when compared to T2 and T3. The results indicate that, when the girls were younger, they presented higher risks for EDs. Accordingly, 8 months were suficient to reduce the frequen-cies of IEB. Some factors to explain these indings should be highlighted. For instance, some authors argue that younger adolescents often feel more pressure to reduce body weight(15), which makes them more susceptible to the adoption of IEBs. It is noted, however, that the ANOVA for repeated measures showed no collinearity of the age with the EAT-26 scores, indicating that age factor did not explain the variance of the IEBs in this sample. Nevertheless, it has been shown that it is not chronological age that leaves young females more or less susceptible to IEBs, but the biological age(15). These
authors found that the younger girls are biologically more vulnerable to IEB. Considering that, in a year, it is possible that the biological age of these teens has advanced, then, the results of this research can be explained.
Although there have been no differences for age, weight, and height, the results showed an increase in mean BMI when T1 and T3 were compared. Other indings corroborate this trend(12,13). The increase in BMI that may occur during adolescence is due to the inluence of body weight increase which, in turn, is more related to the increase in body fat in girls(15). Mirwald et al(14) point out that body fat during puberty in girls is increased by factors such as menarche and hormonal preparation to reproduce the species.
As for comparisons of the EAT-26 scores in relation to administrative involvement (public or private), there was no difference in any of the three stages of the research. However, Dunker et al(8) point out that the IEB are more common in adolescents with high socioeconomic status. Therefore, we expected to identify higher EAT-26 scores in adolescents attending private schools. Perhaps the govern-mental involvement in which the adolescents are inserted is not an indicator of socioeconomic status. It is possible that low-income adolescents have scholarships in private institu-tions, and therefore, have exemption from enrollment and tuition. Likewise, it is possible that adolescents from high socioeconomic levels are enrolled in public schools, which explain the similarity between IEB among adolescents from private and public institutions in this investigation.
alone affects the IEB in males, which, somehow, explains the results of this research. However, due to the results of other studies(9,16), we expected to ind association of IEBs with body weight, which in fact, did not happen.
The present study showed interesting and unpublished results, but it has limitations. One of them was the use of self-reported measures. Researchers point out that young people may not answer truthfully to the questionnaires(24,26). However, Fortes and Ferreira(25) and Schubert et al(27) emphasize that, in studies with larger samples, self-administered instruments may be considered the gold standard for presenting easy ap-plication and low operational cost. Moreover, it is noteworthy that the sample loss during the 8 months of research can also be considered another limitation. It is emphasized, above all, that such losses were caused because of absences of students in T2 (37 adolescents) and T3 (25 adolescents), incomplete an-thropometric data (T2=2 and T3=8 young), or questionnaires
delivered with incomplete answers in these stages of the research (T2=3 and T3=3 school). It is also recognized that these facts may have biased the indings of this study. However, because of the considerably large inal sample size (greater than needed for the representative population), it is believed that this loss of participants has reduced the information bias that could inluence the results. Finally, it is estimated that this is the irst study conducted in Brazil comparing IEBs over time in adolescent females.
The results showed that both the prevalence and the scores of IEBs in female adolescents declined in the course of a year. We recommend further investigations with longitudinal characteristics related to affective and behavioral variables among adolescents in both sexes. These researches would enable the progression of scientiic knowledge in this area, as well as the routine of appropriate interventions, in order to reduce the prevalence of IEBs in this public.
References
1. Gondoli DM, Corning AF, Salaia EH, Bucchianeri MM, Fitzsimmons EE. Heterosocial involvement, peer pressure for thinness, and body dissatisfaction among young adolescent girls. Body Image 2011;8:143-8.
2. Waller G, Sines J, Meyer C, Mounford V. Body checking in the eating disorders: association with narcissistic characteristics. Eat Behav 2008;9:163-9. 3. Gonçalves SF, Gomes AR. Exercising for weight and shape reasons vs.
health control reasons: the impact on eating disturbance and psychological functioning. Eat Behav 2012;13:127-30.
4. Rodgers R, Chabrol H, Paxton SJ. An exploration of the tripartite inluence model of body dissatisfaction and disordered eating among Australian and French college women. Body Image 2011;8:208-15.
5. Alvarenga MS, Scagliusi FB, Philippi ST. Eating disorders risk behavior in Brazilian female university students. Rev Psiquiatr Clin 2011;38:3-7. 6. Oliveira LL, Hutz CS. Eating disorders: the role of cultural aspects in the
contemporary world. Psicol Estud 2010;15:575-82.
7. Alves TC, Santana ML, Silva RC, Pinto EJ, Assis AM. Factors associated with symptoms of eating disorders among students from public schools in Salvador, Bahia. J Bras Psiquiatr 2012;61:55-63.
8. Dunker KL, Fernandes CP, Carreira-Filho D. Socioeconomic inluence on eating disorders risk behaviors in adolescents. J Bras Psiquiatr 2009;58:156-61. 9. Martins CR, Pelegrini A, Matheus SC, Petroski EL. Body image dissatisfaction
and its relationship with nutritional status, body fat, and anorexia and bulimia symptoms in adolescents. Rev Psiquiatr RS 2010;32:19-23.
10. Scherer FC, Martins CR, Pelegrini A, Matheus SC, Petroski EL. Body image among adolescents: association with sexual maturation and symptoms of eating disorders. J Bras Psiquiatr 2010;59:198-202.
11. De Onis M, Onyango AW, Borghi E, Siyam A, Nishida C, Siekmann J et al. Development of a WHO growth reference for school-aged children and adolescents. Bull World Health Organ 2007;85:660-7.
12. Baxter-Jones AD, Eisenmann JC, Sherar LB. Controlling for maturation in Pediatric exercise science. PES 2005;17:18-30.
13. Siervogel RM, Demerath EW, Schubert C, Remsberg KE, Chumlea WC, Sun S et al. Puberty and body composition. Horm Res 2003;60 (Suppl 1):36-45. 14. Mirwald RL, Baxter-Jones AD, Bailey DA, Beunen GP. An assessment of maturity
from anthropometric measurements. Med Sci Sports Exerc 2002;34:689-94. 15. Fortes LS, Almeida SS, Ferreira ME. Maturation process, body dissatisfaction
and inappropriate eating behavior in young athletes. Rev Nutr 2012;25:575-86.
16. Caqueo-Urízar A, Ferrer-García M, Toro J, Gutiérrez-Maldonado J, Peñaloza C, Cuadros-Sosa Y et al. Associations between sociocultural pressures to be thin, body distress, and eating disorder symptomatology among Chilean adolescent girls. Body Image 2011;8:78-81.
17. Alves E, Vasconcelos Fde A, Calvo MC, Neves Jd. Prevalence of symptoms of anorexia nervosa and dissatisfaction with body image among female adolescents in Florianópolis, Santa Catarina State, Brazil. Cad Saude Publica 2008;24:503-12.
18. Bighetti F, Santos CB, Santos JE, Ribeiro RP. Translation and validation of the Eating Attitudes Test in female adolescents in Ribeirão Preto, SP, Brazil. J Bras Psiquiatr 2004;53:339-46.
19. Conti MA, Cordás TA, Latorre MR. A study of the validity and reliability of the Brazilian version of the Body Shape Questionnaire (BSQ) among adolescents. Rev Bras Saude Mater Infant 2009;9:331-8.
20. Associação Brasileira de Empresas de Pesquisa [homepage on the Internet]. Critério de Classiicação Econômica Brasil [cited 2011 Feb 01]. Available from: http://www.abep.org/novo/FileGenerate.ashx?id=250
21. The Internacional Society for the Advancement of Kineanthropometry [homepage on the Internet]. Australia: National Library of Australia [cited 2010 May 10]. Available from: http://www.isakonline.com
22. Miranda VP, Conti MA, Bastos R, Ferreira ME. Body dissatisfaction in Brazilian adolescents from small municipalities of Minas Gerais. J Bras Psiquiatr 2011;60:190-7.
23. Kelly NR, Bulik CM, Mazzeo SE. An exploration of body dissatisfaction and perceptions of Black and White girls enrolled in an intervention for overweight children. Body Image 2011;8:379-84.
24. Mousa TY, Mashal RH, Al-Domi HA, Jibril MA. Body image dissatisfaction among adolescent schoolgirls in Jordan. Body Image 2010;7:46-50. 25. Fortes LS, Ferreira ME. Comparação da insatisfação corporal e do
comportamento alimentar inadequado em atletas adolescentes de diferentes modalidades esportivas. Rev Bras Educ Fis Esporte 2011;25:707-16. 26. Finato S, Rech RR, Migon P, Gavineski IC, Toni V, Halpern R. Body image
insatisfaction in students from the sixth grade of public schools in Caxias do Sul, Southern Brazil. Rev Paul Pediatr 2013;31:65-70.