Venezuela’s melting pot:
1500-1800
Massimo Livi Bacci*
Not much is known about the demography of the native population of Venezuela in Colonial times. Until mid-17th century, some factual information may be gained from the narratives of
the irst conquistadores, missionaries and colonists, as well as of authors writing in later times of the Colony, but with access to original sources. Ater mid-17th century, some quantitative
information of demographic relevance was collected by the Jesuit, Capuchin and Franciscan missionaries and, in the last decades of the 18th century, by the colonial administration and
the religious authorities. The native population declined, from between 200,000 and 500,000 inhabitants at contact (guesstimates of modern authors) to perhaps 120,000 in 1800, according to Humboldt’s estimate. It is possible that the initial decline became steeper ater the irst smallpox pandemic of the 1580s and continued, at a slower pace, until the Independence. As in other regions of South America, marriage was early and almost universal, and the high ratio of births to deaths seems to indicate a high potential for growth, interrupted by frequent mortality crisis. A competing cause of the decline of the natives was the process of mestizaje that intensiied with the increase of the population of European and African origin.
Keywords: Venezuela. Population. Mission. Mestizaje.
From Columbus to Humboldt: a concise outlook
When Alexander von Humboldt landed in Cumanà in July 1799, the population of Venezuela, according to his own later estimate, counted some 800,000 inhabitants: 120,000 were native iios; about 200,000 were of Hispanic birth or descent; 60 or 70,000 were slaves of African origin; and another 400,000 or more were mestizos of mixed ethnic background (HUMBOLDT, 1814, p. 558). The size of the population three centuries before, when Columbus navigated the gulf of Paria on his third voyage, remains unknown and still deies the skillful eforts of modern scholars: available estimates range between 200,000 and 500,000 souls (CHEN; PICOUET, 1979, p. 14). Settlement was more numerous in some areas of the cordillera’s valleys in the western part of the country, where agriculture was practiced, and between the coast and the mountain ridges bordering the coastline; the vast expanse of the Llanos (Plains), between the eastern Cordillera and the Orinoco river was mostly deserted, except along the main rivers, inhabited by nomadic or seminomadic populations. A few dispersed tribes lived in the forestland south of the Apure-Orinoco line, and in the Guayana area, between the Orinoco, the Atlantic Coast and the Amazon.
Map of Venezuela
Oceano Atlantico Mar Caribe
BRAZIL COLOMBIA
Marcaibo
Angostura Barquisimeto
Barcelona Cumaná
Macizo Guyana R. Meta
R. Capanaparo R. Arauca R. Apure
Valencia Caracas
Cordillera Central
Cordillera De Merida
Trinidad
R. Orinoco
R. Orinoco
R. Orinoco R. Ventuari
R. Caroní
R. Esquibo
L
L A
N O S
G
U A
Y A N A
Macizos Guyanes Barinas
Coro
R. Orinoco
In the words of Humboldt, penetrating the country from the Caribbean coast:
[…] we irst encounter cultivated ields along the coast and around the mountain chain along the coast; then the pastures and the savannah; inally, south of the Orinoco there is a third region, that of the forests, that cannot be penetrated except via the rivers that cross the region (HUMBOLDT 1, 1814, 567).
Communication, and therefore mobility, was easy on the east-west axis, along the coast or along the Orinoco and its main tributaries, but was diicult along the South-North axis, because of the need to cross rivers, waterways, and other bodies of water. Spanish settlement was slow: according to cosmographer Lopez de Velasco, in the 1570s there were eight Spanish pueblos, and four “ciudades” (incorporated cities) with little more than 200 vecinos (households) (VELASCO, 1894). In all, some 400 vecinos – maybe 2,000 persons – and about 60,000 indios (it is not clear whether the number refers to households or individuals) in the region at that time under Spanish control (a fraction, maybe one ith, of Venezuela). Spanish settlers introduced husbandry and developed agriculture in some areas, mainly for subsistence. By the end of the 16th century the indigenous population has been estimated to be between 200,000 and 300,000 (VILA, 1965, p. 327-28) and a similar number (280,000) is given for mid-17th century (ROSENBLAT, 1954, p. 59), plus another 100,000 equally divided between whites, blacks and persons of mixed origin. From the end of the 17th century, husbandry extended all over the country, and agriculture was rapidly developing, with the cultivation of sugarcane, tobacco, cotton and later cacao and cofee. At the end of the 18th century:
The blacks with their masters (criollos and mestizos) were fundamentally employed in agriculture, cultivating cofee, cacao, sugarcane, tobacco, indigo for export, and other products for internal consumption; while the indios with their masters (criollos and mestizos) were employed in husbandry in the vast expanses of the Llanos between the piedmont of the Andes and the delta of the Orinoco, in the Maracaibo basin and in the lowlands of the Macizo Coriano. (CHEN; PICOUET, 1979, p. 18)
A population of between 100,000 and 150,000 at the turn of the 19th century probably represents the bottom of the declining trend of the natives since contact, and before the steady recovery in the rest of the century.
As elsewhere in Iberoamerica, the European intrusion brought about a decline of the indigenous population; a population that was sparsely settled, dispersed in small tribes, and more oten than not nomadic or seminomadic. There were no structured kingdoms or chiefdoms, as in Mesoamerica or in the Andean region. The European intrusion did not clash against a complex political, religious and cultural social order with a hierarchic organization; nor did it destroy a secular order. But population declined all the same. This was the general opinion expressed in the few surviving Relaciones Geograicas written in the late 1570s
Losada” (in the 1550s), the decline being due to pathologies like smallpox and measles, diarrhea and catarrh, but also to the consequences of “paciication” and excessive work. In the province of El Tocuyo, “at present there are few indios […] there were many more at the beginning [irst contact]”. In Trujillo “there were 13-14,000 indios before, now they are 4 or 5,000”; being rebellious and belligerent, many fled the region. In the district of Barquisimeto, the decline of the indios was brought about by the wars and slaving raids, many being transported to Puerto Rico and Santo Domingo. Many indios were used like beasts of burden and employed in search of gold. In Nueva Zamora, on the Maracaibo lagoon, the indios were once much more numerous, the depopulation being brought about by the slaving raids and destructions made by the Welsers (the irst German colonists). In the Relaciones, as well as in other documents, the decline was multicausal: pathologies, particularly smallpox, war and violence, excessive work, slavery, flights.
The opinions of contemporary witnesses were not always shared by later, well informed and respected observers of the indigenous population. Father Gumilla, a tireless Jesuit missionary active in the irst part of the 18th century, thought that the causes of the reduced population of many tribes, and of their decline, were mainly due to the continuous interethnic conflicts, to the sterility of women, and to the flights into the “depth of the forest” (GUMILLA, 1741, p. 560-3). A few decades later, another Jesuit missionary, Filippo Gilij, was convinced that the size of the indigenous population was more or less the same as at the time of contact. Bloody interethnic conflicts had always been a constant among the natives; it is true that smallpox was unknown before the arrival of the Spaniards, but evangelization had eradicated abortion and infanticide, and the sick were taken care of and not abandoned by their next of kin as before (GILIJ, 1784, p. 260-1). In Humboldt’s view there were no proofs that the contemporary population was smaller than three centuries before. He acknowledged a reduction of the free and independent indigenous population in the north of the country (between the line of the rivers Apure and Orinoco and the sea): this was the consequence of the settlement of the Spaniards and of the compression of the space and of the resources that were vital for nomadic or seminomadic modes of life. However, where agriculture was developed and adopted by the indios, oten at the initiative of the Missions, their numbers were on the increase. Humboldt gives the example of the Caribe tribes: those that were still independent were few in number and declining, while those living in the Missions of the Piritu district, where agriculture had been developed, were prosperous and increasing in number. “Population growth is incompatible with the restless modes of life of the independent tribes” (HUMBOLDT, 1814, p. 459). And while the religious orders settled their missions among the independent forest tribes, white colonists followed in their steps:
villages, and the indios lose even the memory of their national idiom. This is the march of civilization from the coastline into the inner land, a slow march, contrasted by men’s passions, but irm and steady. (HUMBOLDT, 1814, p. 462)
Until the second part of the 18th century, when the Bourbon’s colonial administration started collecting data, counting souls, households, villages, industrial establishments, and other statistics useful for the governance of the colony, little is known about Venezuela’s population. There are occasional data collected by the clergy or the administrators, but nothing systematic exists. Even less is known about the indigenous population, part of which lived dispersed in the depths of the backcountry. However, the religious orders (Jesuit, Franciscan, Capuchin) that established a network of Missions ater mid-17th century, collected some information of demographic interest. A systematic recount of the population was conducted by Caracas bishop, Mariano Martì, in the 1770s and 1780s, with many details useful for the analysis of the diferent ethnic groups (MARTÌ, 1989).
This paper strives in three steps to put some systematic order into this dispersed and not yet properly analyzed material: irst, a brief survey of the literature concerning those factors that may have afected the demography of the country, such as epidemics, armed entradas, and slaving raids. Second, an analysis of the data of demographic interest collected by the religious orders. Third, a comparative analysis of Mariano Martí’s data for whites, blacks, mestizos and indios. If the Conquest brought about a deep demographic, social and cultural crisis in the entire American continent, the ways in which the crisis manifested itself varied according to the modalities of the European intrusion, the characteristics of the indios, the nature of the territory, the historical contingencies. The Venezuelan case adds to the complexity of the American experience.
Factors of demographic change: pathologies, violence, slavery
The existing historical documentation suggests hat smallpox hit the country in the late 1570s and the 1580s.1 There is an earlier testimony by Federmann, whose entrada reached Tocuyo in 1530 and who was told that several years before a new disease had hit the country (GUERRA, 1999, p. 150). Smallpox hit the mining community (Real de Minas) in the province of Los Teques in 1578; the survivors were forced to abandon the site. However the irst widespread epidemic of smallpox was in 1580, when a Portuguese ship landed in the port of Carabelleda with infected sailors on board; the contagion spread like wildire among the indios and “depopulated the province, swept away entire nations in such a way that only their name remained” (OVIEDO Y BAÑOS, 1723, p.175-6). This epidemic was an episode of the continental pandemic that swept South America at the end of the century. Another outbreak occurred in 1588, introduced in the city of Mariquita (Colombia) by an infected black woman from Guinea, spreading eastward to Caracas and southward to Chile (SIMON, 1883, p. 207). Most of the smallpox outbreaks were brought by ships plying the busy Caribbean waters and carrying infected passengers, slaves or crews: in 1611 smallpox ravaged the island of Margarita; in 1612 it hit Maracaibo, brought by a ship arriving from Cartagena. In 1614 the infection was introduced by a ship proceeding from Cartagena and landing in La Guaira: smallpox reached Caracas; an inirmary was organized extramuros; and a hospital was set close to the cathedral.
In 1626 an infected ship from Angola landed in La Guaira, and quarantine was declared; in 1693 a ship with infected slaves arrived at La Guaira and smallpox spread everywhere; it was one of the most devastating epidemics to ever hit the country. Another severe outbreak occurred in 1766 that, according to Humboldt, caused 6-8,000 deaths (GUERRA, 1999, p. 368). There are plenty of local episodes of epidemic outbreaks in the 17th and 18th century, but little is known about their difusion, nor about the number of lives they claimed. The same can be said about the incidence of measles that, however, was much less deadly than smallpox. Another new pathology was yellow fever, a disease of African origin that implanted itself in the Caribbean region in the 17th century and visited Caracas in 1694 and again in 1756, and then several times between 1793 and 1802. The disease was carried by ships arriving from the Antilles. Contemporary chroniclers make reference to other diseases – like intermittent fevers, diarrhea, respiratory pathologies, infections – that ravaged the indigenous population, but they were probably the normal burden of disease of the natives.
Few conclusions can be drawn from the existing documentation. There is little evidence concerning the impact of smallpox before the late 1570s. The Relaciones Geograicas, as we have seen, make reference to smallpox as a cause of depopulation, but they were written ater the irst epidemic in 1578. Ater that date, smallpox was a regular visitor to Venezuela, and was typically reintroduced from abroad by ships landing in Venezuelan ports. The three major outbreaks seem to have been those of 1580, 1693 and 1766. By the last decades of the 18th century, the practice of inoculation became widespread, and Humboldt himself was a witness to inoculations carried out by people without medical training. Assuming
that smallpox arrived in Venezuela in the late 1570s, one could venture the hypothesis that its major impact on the natives might have occurred during the following half century, with a negative but waning efect ater the irst two or three decades of the 17th century.
Armed entradas (expeditions) into the depths of a newly discovered land were a common
trait of the Spanish Conquest in the irst decades ater contact. The country had to be explored; the indigenous population had to be subdued; new kingdoms had to be discovered; and new riches – precious stones, gold, silver – had to be found and exploited. Entradas oten
ended in bloody conflicts with independent native groups and tribes, with ensuing deaths, flights and enslavement. Diego de Ordaz navigated the gulf of Paria and in 1532 was the irst European to explore the Orinoco delta before navigating the river upstream until the Atures cataracts. He punished the lack of cooperation of a native group with the mass killing of over 100 indios and the enslavement of their women and children (OVIEDO, 1992, p. 393-94). In the eastern part of Venezuela, between 1529 and 1550, several expeditions inanced by the Welser, a powerful family of German bankers, to whom Charles V, in repayment for his debts, had assigned governance of the country, let Coro for exploration and the search for riches in the interior. Clashes with the natives were frequent: Aguado wrote that given the abuses, killings, and exploitation that the tribes sufered at the passage of those expeditions, it was all too natural that they had been reduced to small numbers or destroyed (AGUADO, 1904, p. 416-17). Before, during the irst two decades of the century, pearl ishing operations had destroyed the populations of the islands – Trinidad, Margarita and Cubagua – and of the gulf of Paria, as well as the slaves brought from the coast and from the Bahamas. Contemporary chronicles give a wealth of examples of the ill consequences of the entradas. Given the small number of the Spaniards in those expeditions it is unlikely that violence took many lives among the natives; on the other hand, entradas did generate flights, displacement, dislocation and
a deep distrust among the natives for the newcomers. Conflicts with the natives continued in the second part of the 16th century and beyond; the number of white settlers was growing slowly, from little more than 2,000 in the 1570s to 5 or 6,000 in the second decade of the 17th (VAZQUEZ DE ESPINOSA, 1948, p. 82-92). By the mid-17th century armed entradas ceased and the Crown, in an efort to ensure control over the colonists, opted for supporting the evangelization of the natives by the missionaries of various religious orders.
with the aggressive Caribes, who lived in the Orinoco delta and to whom they sold irearms and ammunition, instructing them in their use. The Dutch also provided the Caribes with axes, wedges, hammers, and other metal tools that were very much in demand among the tribes; the Caribes exchanged the tools for slaves captured by the tribes, and took them back to the Dutch, who sold them for personal service, work on the plantations and in the mines, and as oarsmen for water transportation. In many cases, the Caribes assaulted the villages and forcibly enslaved young men and women. This circular trade – Dutch-Caribes – other tribes-Caribes-Dutch-market – was renewed every year and involved the capture of several hundred slaves per year. Rivero speaks of 300 indios abducted every year (RIVERO, 1883, p. 45), Caulin of 200 (and twice that many let dead in the attacks and transfers) (CAULIN, 1779, p. 372-73). Gumilla narrates that in 1737 an expedition of 27 canoes led by the Caribe cacique Taricura raided the Missions of Piritu and took 300 prisoners (GUMILLA, 1741, p. 362-64). The Jesuit Father Román, who was stationed in the Rio Negro in the Pará (Portuguese) jurisdiction, was charged with the control and registration of the slaves entering the Pará (presumably from the Orinoco) and had registered 8.000 cases in 6 years (ASTRAIN, 1925, p. 476). The demographic impact of the abduction of hundreds of young people every year was probably of limited consequence, at the macro level, for a country with a population of 100 or 200,000 individuals. However, at the local level the impact may have been important, producing dislocation and flights of the natives.
The Missions and their demography
where interethnic conflicts where frequent. The missionaries were normally accompanied by an armed escort, not always friendly with the natives, nor under the full control of the father. In the mid-18th century, at the peak of the religious orders’ eforts – the Jesuits were expelled from the Colonies in 1767 – the natives living in the missions numbered about 40,000 (10,000 in the Jesuit missions, 6,000 in those of the Augustinians, 20,000 in the missions governed by the Capuchins, and 16,000 in those under Franciscan rule), perhaps one fourth or one ith of the presumed total native population of the country. Many indios lived in the doctrinas, or villages under the supervision of secular clergy, while others were
indipendentes, unconverted indios living mostly in unexplored areas.
The Jesuits’ evangelical eforts started in the region of the Casanare in the 1660s (ater earlier failed attempts), in the western part of the Llanos, the region extending from the Cordillera to the Orinoco. The Casanare river is a tributary of the Meta, that is the main tributary of the Orinoco on its let bank. Ater many failed attempts, the Jesuits succeeded in founding a series of missions on the river Meta and later in the lower and upper Orinoco. The Franciscans and the Capuchins, on the other hand, entered through Cumaná or other ports of the Caribbean coast, and directed their action southward, the former on the let bank of the Orinoco, the latter on the right bank. Their drive met the expansion of the Jesuits moving in the opposite direction; in 1734-36, with the intermediation of the Governor General, an agreement was reached concerning the limits of the respective zones of influence (ASTRAIN, 1925, p. 468-69; Map 2).
The growth in number and importance of the missions in the 18th century has let a few quantitative traces. Missionaries were certainly under the obligation to keep the parish books of baptisms, marriages and burials, but none of those have survived. However, a few summary statistics – oten mere global population estimates – were collected and have reached us; if properly analyzed they ofer an interesting view of the structure and dynamics of the native populations.
There are several counts of the population of the Jesuit missions before the expulsion of the order in 1767. However, even a basic analysis is problematic, and for several reasons: the number, names, and locations of the missions changed over time; the meaning of the denomination of the various population categories is not clear (how old are the pueri or
children, and the adolescents? Are the soluti widows and widowers, or also unmarried adults?) and they are not consistent over time; the size of village populations was very small (normally a few hundred); and the level of mobility was high (in some cases entire tribes moved in and out of a mission, or merged in a diferent mission). These distortions afect most of the missions’ population data.
Table 1 presents some structural data of 6 missions of Casanare obtained averaging three enumerations (1717, 1729 and 1735) in order to obtain a minimum of stability in the data. About half the population was married (44%) or widowed (5%).This is consistent with the early and universal marriage that was typical of the native populations of the continent, and was strongly endorsed by the missionaries. This means that practically the entire adult population had been married at least once. In general, the fathers encouraged marriage just past the age of puberty, at 14-16 years of age. On the other hand, if the pueri (children) and the adolescents represented the population below age 15, they accounted for about half the total population, a proportion consistent with a very high birth rate.2
There is no doubt that the natives belonged to the category of “high pressure” populations, with high fertility balancing high mortality.
In 1752, about 9,000 natives were under the control of the Jesuits in the Casanare, Meta and Orinoco regions – a small number, if measured against the unrelenting missionary action (over the course of more than a century long) and the great extension of the region. Small, then, but signiicant given the low density of the population. In Table 2 the population (1752) of 6 missions of Casanare, 5 of Meta and 7 of Orinoco is given, with a basic structural breakdown.
TABLE 1
Population of 6 Casanare Missions – 1717-1735
Mission Married Widowed Adolescents Children
(pueri) Catecumenos Total
Pauto 211 30 15 187 0 443
Patute 146 24 8 118 3 299
Betoyes 299 41 19 312 21 693
Tame 523 53 138 617 0 1,331
Macaguane 494 47 65 413 0 1,019
Casanare 191 23 23 216 0 454
Total, 6 Missions 1,864 218 268 1,864 24 4,238
Distribution (%)
Pauto 47.6 6.8 3.4 42.3 0.0 100.0
Patute 48.8 7.9 2.7 39.5 1.0 100.0
Betoyes 43.1 6.0 2.7 45.1 3.1 100.0
Tame 39.3 4.0 10.4 46.3 0.0 100.0
Macaguane 48.5 4.6 6.3 40.6 0.0 100.0
Casanare 42.1 5.1 5.1 47.6 0.0 100.0
Total, 6 Missions 44.0 5.2 6.3 44.0 0.6 100.0
Source: 1717, ARSI, Novi Regni, 15.1, fg. 120; 1729: ARSI, Novi Regni, 15.1, fg. 249; 1735: ARSI, Novi Regni, 15.1. fg 270. Note: Average of population counts of 1717, 1729 and 1735. This latter date is conjectural, on the basis of the dates of the documents bound in the same archival volume before, and ater, fg 270. The documents was sent to Rome to Father Retz, General of the Jesuit order between 1730 and 1750.
TABLE 2
Population and structure of the population of the Missions of Casanare, Meta and Orinoco – 1752
Region Married WidowedAdolescents M
Adolescents F
Children Children Population (pueri) (puellae) (baptized)
Population
Casanare, 6 Missions 2,356 293 890 691 522 544 5,312
Meta, 5 Missions 926 108 270 217 198 189 1,908
Orinoco, 7 Missions 838 227 342 184 134 96 1,821
Total, 18 Missions 4,120 628 1,502 1,092 854 829 9,041
Distribution (%)
Casanare, 6 Missions 44.4 5.5 16.8 13.0 9.8 10.2 100.0
Meta, 5 Missions 48.5 5.7 14.2 11.4 10.4 9.9 100.0
Orinoco, 7 Missions 46.0 12.5 18.8 10.1 7.4 5.3 100.0
Total, 18 Missions 45.6 6.9 16.6 12.1 9.4 9.2 100.0
Children per married couple Gender ratio, children (%) Gender ratio, adolescents (%) Children per 100 adolescents (males) Children per 100 adolescents (females) Young (children and adolescents) per 100 population
Casanare, 6 Missions 0.90 96.0 128.8 58.7 78.7 49.8
Meta, 5 Missions 0.84 104.8 124.4 73.3 87.1 45.8
Orinoco, 7 Missions 0.55 139.6 185.9 39.2 52.2 41.5
Total, 18 Missions 0.82 103.0 137.5 56.9 75.9 47.3 Source: ARSI, Novi Regni, 15.1. fg 272-273.
Four considerations must be made. First, there must have been a change of deinitions, since the proportion of the pueri is much lower and that of the adolescents much higher than in 1717-35 (Table 1). The age of the pueri is a puzzle: they may have been children below the age of conirmation (normally 10 years old), or below the age at which they started to get some formal education (normally 7 years old).3 Second, the population structure for the Orinoco’s missions diverge from those of Meta and Casanare, maybe because they were of more recent foundation and therefore less stable. Third, the data conirm the universality of marriage. Finally the combined high proportion of children and adolescents (47.3%) is consistent with a high birth rate. The ratios in the bottom part of Table 2 conirm the relative deviance of the more recent Orinoco Missions from the Casanare and Meta ones.
While the Jesuit penetration into Venezuela originated in the Nuevo Reino (Colombia), proceeding eastward through the Casanare, the Llanos and to the Orinoco, the Franciscans came from Spain, entered through the country in the north – Cumanà and other ports – and moved southward to the Orinoco let bank. According to Antonio Caulin, for a period Rector of the Franciscan College of Barcelona, 138 friars arrived from Spain in 13 expeditions, over a hundred year long period, with the assistance of a few dozen lay brothers. In 1755, there were 30 missions and doctrinas, founded by the Franciscans; many had disappeared or
been abandoned or destroyed by other tribes, by pirates, or by epidemics (CAULIN, 1779, 376). Caulin provides a brief description of each village and, among other information, records the date of the foundation of each mission, and the cumulative number of births and deaths between the foundation of each village and 1755 (or the year of their demise). The textual information for 25 villages has been extracted and recombined: the data are reported in Table 3.
TABLE 3
Baptisms and Burials in 26 Villages of Piritu, from the foundation to 1755
Village Year of the foundation
1755, or date of village dissolution
Years (from foundation to 1755 or diss.)
Baptism Burials Final population
Baptisms per 100 burials
1 Concepcion de Piritu 1656 1755 99 6,000 4,600 1,600 130
2 Jesus Maria Joseph de Caygua 1657 1755 98 8,500 5,400 1,500 157
3 Santa Clara de Zapata 1661 1678 17 1,499 856 NA 175
4 San Miguel de Araveynecuar 1661 1755 94 5,000 3,000 950 167
5 San Antonio de Clarines Paricuatar 1674 1755 67 4,294 3,356 1,100 128
6 N S del Pilar del Guaymacuar 1674 1755 81 5,800 4,950 1,400 117
7 San Lorenzo de Aguaricuar 1675 1755 80 4,000 3,430 700 117
8 San Buenventura 1675 1684 9 780 356 400 219
3 In a stable population as described in note 2, the proportion of children below age 10 would be about seven percentage points above the proportion of children below age 7.
Village Year of the foundation
1755, or date of village dissolution
Years (from foundation to 1755 or diss.)
Baptism Burials Final population
Baptisms per 100 burials
9 San Diego de Chacopata 1675 1680 5 519 279 240 186
10 San Francisco Guariomocar 1675 1755 80 2,700 2,100 400 129
11 San Bernardino Guartecuar 1675 1755 80 4,900 4,600 1,600 107
12 San Pablo Mataruco 1680 1755 75 3,100 2,350 700 132
13 San Joseph Curataquiche 1679 1755 76 3,900 2,150 580 181
14
San Juan Evangelista (Guarive, Tucuyo)
1681 1755 74 2,150 1,860 350 116
15
San Juan Capistrano del Parney
1689 1755 66 2,200 1,400 500 157
16 Pueblo de los Pozuelos 1692 1755 63 1,400 1,150 300 122
17 San Bonaventura del Roldanillo 1688 1710? 22 NA 250 200 NA
18 San Diego de Chacopata 1689 1755 66 1,170 400 200 293
19 Araguita 1690 1755 65 2,160 1,100 250 196
20 S Pedro Alcantara Chupiquiré 1699 1715 16 300 250 100 120
21 San Matteo 1715 1754 39 3,200 2,000 867 160
22
Panapotar y Margarita (S Ana, S Barbara)
1734? 1755 21 500 NA NA NA
23 San Joaquin de Pariri 1724 1753 29 1,200 NA 390 NA
24 Santa Rosa de Ocupì 1732 1755 23 2,000 1,000 605 200
25 N S de Chamarapica 1740 1750? 10 150 NA 200 NA
26 SS Christi de Paraguan 1744 1755 11 200 90 NA 222
Total 1,366 67,622 46,927 15,132 144
Source: Data extracted from Caulin (1799).
Note: For S. Antonio de Clarines, registration was missing for 14 years.
It is impossible to know the trustworthiness of the data. First, all the numbers are rounded. Second, Caulin apparently asked the fathers to consult the parish books – he had the authority to do so – but it is impossible to know how carefully the books were kept, and how careful were the calculations, or estimates, made by each father. Third, Caulin gives only the rough estimate of each village’s population (given in hundreds) at the inal date (1755) but no information is given for other dates.4 The 25 villages had, in 1755, a
4 A couple of examples of the annotations of Caulin. The Mission of San Miguel de Araveneycuár was founded in 1661 and “from the registrations in the parish books it results that 5,000 souls have been baptized and in this number are included those who were already Christians in the former site. From the book of burials we desume that 3,000 people had died. There are now 900 inhabitants” (CAULIN, 1779, p. 232). Nuestra Señora de Guaymacuar was founded in 1674 and “from its foundation to the present year of 1755, up to 5,800 souls have been baptized, and in the same period 4,950 people had died; [the Mission] counts today more than 1,400 people of all ages, not to speak of the many that are fugitive in the plains of the province of Caracas, that are more than 200” (CAULIN, 1779, p. 254-55).
population of about 16,000 people; they had been in existence, in total, for 1366 years (or 55 years on average: the oldest village was founded in 1666, the most recent in 1744); their mean population was 640 inhabitants in 1755 (the smallest had 200 inhabitants, the largest 1,600). About 68,000 baptisms and 48,000 burials had been reported, with a conspicuous excess of 42% of the irst over the second. This excess, however, does not necessarily imply that the native population had been on the increase during the period considered, because an undetermined if small proportion of the baptisms was not of newborn, but of gentile adults, adolescents and children joining a mission. There is no way to know how many of these were.
The average mission, in the average year of its existence, had about 50 baptisms and 35 burials and, assuming a denominator equal to the average mission population size of 640 in 1755, these igures translate into birth and death rates of 81 and 57 per thousand, respectively. These rates are above the levels found in other missions with trustworthy data (in Paraguay’s 30 missions and in the Mojos missions in the 18th century birth rates were at least 10 points lower (LIVI-BACCI, 2016, p. 436).
Thanks to Humboldt we have some further data for 38 Piritu missions, presented in Table 4. As in 1755, the average population of the missions was 652 inhabitants, and the birth and death rates 78 and 39 per thousand, suggesting an implausible level of natural increase of nearly 4 per cent. Humboldt (who had the manuscript registers in his possession) was surprised by the “extraordinary rapidity of the population increase in the old missions of Piritu, distant from the Orinoco”, and contrasted them with an increase of 1 or 2 % for the populations closer to the Orinoco (HUMBOLDT, 1819, p. 307). As already argued (cfr. note 3), these levels are not credible, and must be the consequence of an undercount of the villages’ population and, perhaps, of the burials that, more frequently than the births, went undetected by the fathers, given the high mobility of the population. Diferential intense immigration may have been another factor.
The Capuchins’ penetration into the country, proceeding from the coast, was similar to that of the Franciscans. The Aragonese Capuchins founded a series of missions in the region of Cumaná, while the Catalan Capuchins operated in the region adjoining the southern right bank of the Orinoco. Table 5 resumes a very detailed series of data (RIONEGRO, 1930, p. 196-202) for 16 doctrinas and 16 missions, for which a count of the cumulative baptisms, burials and marriages was collected in 1780. The same data were collected also for 12 missions “destruidas” (destroyed). The doctrinas (villages guided by a priest
TABLE 4
Demography of 32 villages, Piritu region – 1799
Villages
Married Unmarried
adults Children Population Births Deaths Marriages Birth rate Death rate Marriage rate Mean village population La Purisima Concepcion de Piritu
366 259 660 1,285 120 64 27 93.4 49.8 21.0
Nuestra Senora del Pilar
558 542 1,019 2,119 204 108 46 96.3 51.0 21.7
San Antonio de Clarines
422 776 458 1,656 115 93 25 69.4 56.2 15.1
San José de
Caigua 526 775 547 1,848 118 50 34 63.9 27.1 18.4
San Pablo Apostol de Huere
204 306 438 948 101 68 22 106.5 71.7 23.2
Santa Rosa
de Ocopi 417 411 261 1,089 104 47 23 95.5 43.2 21.1
Total, 6 large villages
2,493 3,069 3,383 8,945 762 430 177 85.2 48.1 19.8 1,491
Total, other
villages 3,886 5,111 6,636 15,833 1,172 531 291 74.0 33.5 18.4 495
Total 6,379 8,180 10,019 24,778 1,934 961 468 78.1 38.8 18.9 652
Source: Humboldt (1825, p. 169).
Note: 17 mission villages and 21 villages “de doctrina”.
TABLE 5
Missions of the Aragonese Capuchins, Cumaná – 1780
Missiones Baptisms Marriages Burials Population
Baptisms per marriage Baptisms per 100 burials Birth rate Death rate Mean village population Doctrinas, 16
Missions 39,106 10,377 20,480 7,442 3.8 190.9 60.4 31.6 465
Vivas Conversiones, 16 Missions
9,280 2,909 4,329 4,581 3.2 214.4 55.7 26.0 286
Total, 32
Missions 48,386 13,286 24,809 12,023 3.6 195.0 376
12 Missions
destroyed 3,475 965 2,292 1,993 3.6 151.6 167.7 110.6 166
Source: Rionegro (1930, p. 196-202).
Note: Mean duration of the Doctrinas, 87 years; Vivas conversiones, 36.4 years; Destroyed, 10.4 years. Baptisms, burials and marraiegs are cumulated values between the foundation of the mission and 1780. Rates are calculated as a ratio of cumulated births (deaths, marriages) divided by the duration in years of the mission and the population in 1780.
due to collective drunkness; in three cases, the indios were “bad people” willing to return to their heathen state; in two cases the mission had dissolved because of the absence of a father; in two other cases because of the invasion of the French and the aggression of the Caribes; and in one case because of an epidemic of smallpox.
The Catalan Capuchins have let much summary data of demographic interest for their missions on the right bank of the lower Orinoco. We ofer a synthesis of the data in Table 6, covering the 1755-1816 period, during which the number of the missions grew from 11 to 29 and their total population from about 3,000 to about 22,000 souls.
TABLE 6
Demography of the Missions of Guayana – 1755-1816
Years
Number of missions
Total population
Population per mission
Mean duration
Baptisms per 100
burials
Baptisms per marriage
Persons per family
Married per 100 inhabitants
Children per 100 inhabitants
1755 11 2,907 264 14.95 162.2 3.3 – – –
1788 30 11,395 380 27 206.5 6.7 – – –
1797 30 16,139 538 35.53 188.9 6.1 – – –
1799 28 15,886 567 – – – 4.2 47.6 29.1
1816 29 22,246 767 55.34 170.4 5.8 – – –
Source: Rionegro (1930, p. 100-101, 233-236, 305-306, 259-272, 322-323).
Note: Mean duration = number of years the Mission had been in existence. Children are designed as “parvulos” and “parvulas”: below 7 or below 10 years of age.
Over the period, there is a consolidation of the missions, as their average population trebles to 767 in 1816, and a conspicuous excess of baptisms over burials is conirmed. It is interesting to report the comments attached to the document that reports the data for 11 missions in 1755, three decades ater the initial foundation. One of the missions, Suay, was “entirely destroyed by smallpox” in 1729, ive years ater its foundation; it was reconstituted with 300 indios “drawn from the woods”; in 1741 the village was burned by the English and sufered smallpox and later, in 1749, was hit by an epidemic of measles; in the two epidemics the majority of the indios died. Therefore, the population living in the mission in 1755 had been “drawn from the woods”. A similar story is told of the mission of Caroní where “of the initial population, no indio has been let, consumed by the smallpox, measles and the invasion of the Caribes, so that those counted in 1755 are ‘recruits from the wilderness’”. The mission of Maruca, founded in 1730, “was annihilated in 1741 by smallpox and measles” (RIONEGRO, 1930, p, 101).
The Roving Bishop
demographic conditions. In 12 years he visited 9 Ciudades (cities), 12 Villas (townships), 190 Pueblos (villages), 94 Sitios (sites); he logged 2,553 leagues (some 14,000 km) and, among other statistics, enumerated 341,138 inhabitants and 55,029 families, about half the total population of the entire country. With reference to the entire Capitanía,
only the provinces of Cumanà and Guayana were outside the dioceses’ territory. It is, of course, the demography that interests us here: up to 1777, the total population was registered, with the distinction between “blancos” and “indios”, reporting the number of homes, households, families, children (parvulos), persons “de confession” (probably adolescents not yet conirmed), persons “de communion” (possibly all adults and conirmed adolescents); for the indios there is also the distinction between men and women. From 1778 on there are more details: as far as the ethnic groups are concerned, blancos, indios, negros, mulatos and esclavos, with the express indication (repeated for every village visited) that the mestizos were to be counted as blancos.5 For each ethnic group, there is a breakdown by sex, combined with their status (married, unmarried,
parvulos). Data for each site visited can be grouped by vicariato (20 districts, headed by a Vicar of the Bishop), or in various combinations of the localities visited (cities, townships, villages).6
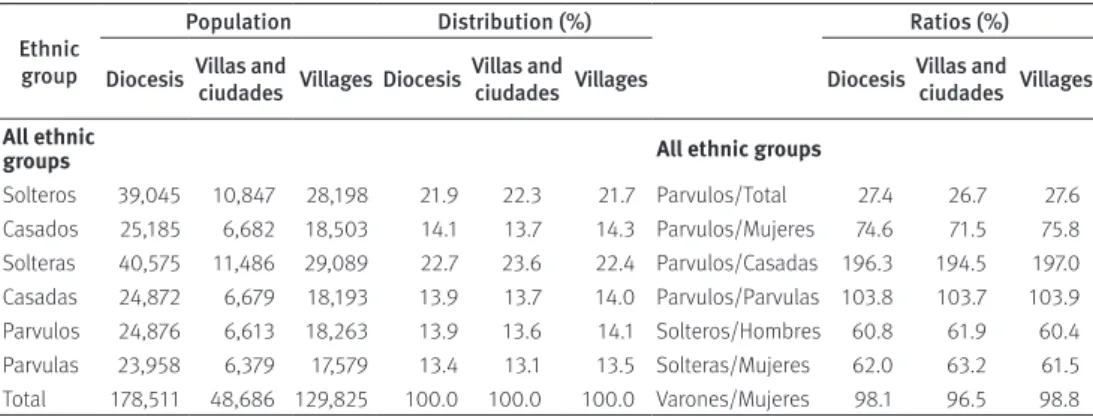
Table 7 ofers a synthesis of the post-1777 results of the visit, covering 110 villages, 5 cities and 8 townships, for a total of 179,000 persons (52% of the population of the entire dioceses). The data are presented for each of the 5 ethnic groups, separating the “rural” population (villages) from the “urban population” (cities and townships). About 28% of the population were blancos that, as mentioned above, included the mestizos; the indios were 16%, mostly in the villages; the negros no esclavos 7% and the mulattoes no esclavos 33%, while the esclavos (mainly blacks, but also mulattoes) accounted for 15% of the total. As for the place of residence, about 27% of the enumerated population lived in urban areas (ciudades and villas) and 73% in the villages; while the urbanites included 38% of mulattos, 29% of blancos, 25% of negros, 20% of the slaves and only 9% of the indios. These latter were practically excluded from the “ciudades de españoles”; the slaves instead were mostly employed in plantations and in cattle raising, while the high proportion of mulattos in the urban areas was probably due to their employment in the households of the blancos or as artisans.
TABLE 7
Population of the Diocesis of Caracas by ethnic group and residence – 1778-84
Ethnic group
Population Distribution (%)
Ratios (%) Diocesis Villas and
ciudades Villages Diocesis
Villas and
ciudades Villages Diocesis
Villas and ciudades Villages Blancos –
whites
Blancos –
whites
Solteros 11,495 3,200 8,295 22.6 22.0 22.8 Parvulos/Total 26.1 24.1 26.9 Casados 7,514 2,236 5,278 14.8 15.4 14.5 Parvulos/Mujeres 71.3 62.6 75.1 Solteras 11,332 3,410 7,922 22.3 23.5 21.8 Parvulos/Casadas 182.4 160.0 192.0 Casadas 7,280 2,190 5,090 14.3 15.1 14.0 Parvulos/Parvulas 106.2 102.7 107.5 Parvulos 6,838 1,775 5,063 13.4 12.2 13.9 Solteros/Hombres 50.4 48.4 51.2 Parvulas 6,439 1,729 4,710 12.7 11.9 13.0 Solteras/Mujeres 60.9 60.9 60.9 Total 50,898 14,540 36,358 100.0 100.0 100.0 Varones/Mujeres 102.1 97.1 104.3
Indios Indios
Solteros 5,233 483 4,750 18.1 17.6 18.1 Parvulos/Total 30.7 34.9 30.3
Casados 4,631 417 4,214 16.0 15.2 16.1 Parvulos/Mujeres 87.0 108.0 85.0 Solteras 5,724 477 5,247 19.7 17.4 20.0 Parvulos/Casadas 197.7 235.0 194.0 Casadas 4,499 406 4,093 15.5 14.8 15.6 Parvulos/Parvulas 99.7 118.3 97.7 Parvulos 4,442 517 3,925 15.3 18.9 15.0 Solteros/Hombres 53.1 53.7 53.0 Parvulas 4,454 437 4,017 15.4 16.0 15.3 Solteras/Mujeres 56.0 54.0 56.2 Total 28,983 2,737 26,246 100.0 100.0 100.0 Varones/Mujeres 96.5 101.9 96.0 Negroes
– blacks
Negroes –
blacks
Solteros 2,518 666 1,852 19.7 21.1 19.2 Parvulos/Total 33.3 39.5 31.3
Casados 1,619 249 1,370 12.7 7.9 14.2 Parvulos/Mujeres 97.0 125.5 88.7
Solteras 2,769 748 2,021 21.7 23.7 21.0 Parvulos/Casadas 262.9 508.6 219.1 Casadas 1,619 245 1,374 12.7 7.8 14.3 Parvulos/Parvulas 103.0 93.8 107.1 Parvulos 2,160 603 1,557 16.9 19.1 16.2 Solteros/Hombres 60.9 72.8 57.5 Parvulas 2,097 643 1,454 16.4 20.4 15.1 Solteras/Mujeres 63.1 75.3 59.5 Total 12,782 3,154 9,628 100.0 100.0 100.0 Varones/Mujeres 94.3 92.1 94.9 Mulatos –
mulattoes
Mulatos –
mulattoes
Solteros 12,728 4,978 7,750 21.7 21.8 21.7 Parvulos/Total 26.1 25.2 26.7 Casados 8,303 3,398 4,905 14.2 14.9 13.7 Parvulos/Mujeres 68.8 66.3 70.4 Solteras 13,682 5,212 8,470 23.4 22.9 23.7 Parvulos/Casadas 178.7 166.2 187.1 Casadas 8,565 3,463 5,102 14.6 15.2 14.3 Parvulos/Parvulas 95.2 96.0 94.7 Parvulos 7,840 2,936 4,904 13.4 12.9 13.7 Solteros/Hombres 60.5 59.4 61.2 Parvulas 7,463 2,819 4,644 12.7 12.4 13.0 Solteras/Mujeres 61.5 60.1 62.4 Total 58,581 22,806 35,775 100.0 100.0 100.0 Varones/Mujeres 94.5 96.6 93.2 Esclavos
– slaves
Esclavos –
slaves
Solteros 7,071 1,520 5,551 25.9 27.9 25.4 Parvulos/Total 26.0 28.1 25.5
Casados 3,118 382 2,736 11.4 7.0 12.5 Parvulos/Mujeres 71.2 76.1 69.9
Solteras 7,068 1,639 5,429 25.9 30.1 24.9 Parvulos/Casadas 244.1 408.8 219.7 Casadas 2,909 375 2,534 10.7 6.9 11.6 Parvulos/Parvulas 102.6 104.1 102.2 Parvulos 3,596 782 2,814 13.2 14.4 12.9 Solteros/Hombres 69.4 79.9 67.0 Parvulas 3,505 751 2,754 12.9 13.8 12.6 Solteras/Mujeres 44.7 32.4 47.4 Total 27,267 5,449 21,818 100.0 100.0 100.0 Varones/Mujeres 102.1 94.4 104.1
Ethnic group
Population Distribution (%)
Ratios (%) Diocesis Villas and
ciudades Villages Diocesis
Villas and
ciudades Villages Diocesis
Villas and ciudades Villages All ethnic
groups All ethnic groups
Solteros 39,045 10,847 28,198 21.9 22.3 21.7 Parvulos/Total 27.4 26.7 27.6 Casados 25,185 6,682 18,503 14.1 13.7 14.3 Parvulos/Mujeres 74.6 71.5 75.8 Solteras 40,575 11,486 29,089 22.7 23.6 22.4 Parvulos/Casadas 196.3 194.5 197.0 Casadas 24,872 6,679 18,193 13.9 13.7 14.0 Parvulos/Parvulas 103.8 103.7 103.9 Parvulos 24,876 6,613 18,263 13.9 13.6 14.1 Solteros/Hombres 60.8 61.9 60.4 Parvulas 23,958 6,379 17,579 13.4 13.1 13.5 Solteras/Mujeres 62.0 63.2 61.5 Total 178,511 48,686 129,825 100.0 100.0 100.0 Varones/Mujeres 98.1 96.5 98.8
Source: Extracted from Mart, (1799, p. 6-9).
Table 7 also presents the distribution of the population according to age/marital status, as well as a series of ratios between the diferent population groups. The data are of diicult interpretation: who are the “parvulos”, and who are the “solteros” (unmarried)? Given that the parvulos were 27-28% of the total population, their age was presumably below 7 or thereabout, while the unmarried were the adolescents below the customary age at marriage (14 for females and 16 for males) as well as other adults. Even so, their high proportion (44% of the total population) and the low proportion of the married (only 28%, against well over 40% as in Tables 1 and 2) leaves many doubts as to the criteria followed by Bishop Martí in the classiication of the population by marital status. A possible explanation could be that while the Mission fathers probably deined as married all stable couples (particularly those with children) of a village, the Bishop adhered to a more stringent and formal deinition of marriage, excluding people in de-facto unions. Finally, were the widowed included among the married or among the unmarried? Probably they accrued to this latter category that appears to be overrepresented.
mulattos reinforces the irst hypothesis.7 Third, the proportion of the married population (on average lower than in other counts) is very low among the negros and the slaves, and particularly so among those living in the ciudades and villas. This fact may be related to their professional composition (servants in the urban Spanish households) and/or to a higher prevalence of de facto unions among the non white population. This hypothesis is sustained by the fact that the proportion of children among the negros was higher than in the rest of the population, in spite of a lower prevalence of the married population: in other words, many children were probably born to de-facto, unmarried couples. Finally, the distribution of the diferent ethnic groups by age/marital status is practically identical in the cities and townships, with only a few exceptions (marital status as signaled above). Bishop Martí’s census, in addition to its descriptive value and in spite of the many shortfalls typical of the conditions of its time, suggests also the interesting hypothesis that the relative structural homogeneity between the diferent ethnic groups could have been the result of a relative parallel stability of the social order. Intense diferential migration of the ethnic groups, or markedly diferent fertility and survival systems would have afected their respective age structure.
Decline or collapse of the natives?
A native population between 200,000 and 500,000 at the times of contact is cited by some scholars for the Venezuelan territory. The negative impact of the Hispanic intrusion, because of the violence of the entradas – the exploitation of labor, the dislocation and
displacement of the indios from the more densely settled areas along the coastline into the backcountry – determined a decline in the irst decades following the irst contact. It is likely that the fall of the population accelerated with the great smallpox pandemic of the 1580s and the ensuing recurrent outbreaks of the disease.8 But with the passing of time, the depressing impact of smallpox must have been on the wane, as suggested in the irst pages of this essay. In the 18th century the population continued to decline, if we believe in Humboldt’s estimates for 1800 (120,000 natives), perhaps at a slower pace. Notwithstanding the decline, the fragmentary data point to a relatively high potential for growth of the indios (the high ratio between births and deaths, and the very young age structure support this hypothesis).
As in other parts of the Americas, the indigenous pool lost population not only because of a negative balance of births and deaths, but also because of the steady passage of its ofspring into the mixed, mestizo component of the population that, in 1800, included about half the total population of the country. This process of intense mestizaje is likely to have accelerated
its course with the parallel growth of the white population. The same instructions given to Bishop Marti for his visit, and concerning the inclusion of the mestizos in the category of the blancos, may be interpreted as an encouragement to the mixing of the population. This process of mestizaje may have ofset the natural dynamism of the indios during the colonial times.
Ater the independence wars - when the demographic nadir was reached – there was a steady recovery (326,000 in 1889, CHEN and PICOUET, 1999, p. 22). The indigenous population of Venezuela may have developed according to the phases outlined above. These phases are, to be sure, hypothetical, given the paucity of the data and their uncertain quality and coverage. During the three centuries of the colonial period the native population certainly declined in number, but its vitality was not lost and nourished a powerful mixing process.
References
AGUADO, F. P. de. Recopilación historial. Bogotá: Biblioteca de Historia Nacional, Imprenta Nacional, 1906.
ARCHILA, R. Historia de la Medicina en Venezuela. Epoca Colonial. Caracas: Vargas, 1961. ARELLANO MORENO, A. Relaciones geograicas de Venezuela. Caracas: Biblioteca de la Academia Nacional de la Historia, 70, 1964.
ARSI. Archivum Romanum Societatis Jesu, Rome.
ASTRAIN, A. Historia de la Compañia de Jesús en la asistencia de España. Madrid: Razón y Fe, Tomo VII, 1925.
CAULIN, A. Historia coro-graica, natural y evangelica de la Nueva Andalusia, provincia de Cumanà,Guayana y vertientes del Rio Orinoco. Madrid, 1779.
CHEN, C.; PICOUET, M. Dinámica de la población: caso de Venezuela. Caracas: UCAB-ORSTOM, 1979.
COALE, A. J.; DEMENY, P. Regional model life tables and stable populations. Princeton: Princeton University Press, 1966.
GILIJ, F. S. Saggio di storia americana, o sia, storia natura civile, e sacra, de’ regni, e delle provincie Spagnuole di Terra-ferma nell’America meridionale. Roma: Luigi Perego Salvioni, 1784. GUERRA, F. Epidemiología Americana y Filipina 1492-1898. Madrid: Ministerio de Sanidad y Consumo, 1999.
GUMILLA, J. El Orinoco ilustrado. Historia natural, civil y geographica de este gran rio y de sus caudalosas vertientes. Madrid: Manuel Fernandez, 1741.
HUMBOLDT, A. von. Viaje a las regions equinocciales del nuevo Continente. Caracas: Monte Avila, Tomo V, 1991.
_________. Voyage aux régions écquinoxiales du nouveau continent fait n 1799, 1800, 1801, 1802, 1803 et 1804, fait par Al de Humboldt et A. Bonpland, rédigé par A. de Humboldt. Paris: Schoell, Tomo 1, 1814.
_________. Voyage aux régions écquinoxiales du nouveau continent fait n 1799, 1800, 1801, 1802, 1803 et 1804, fait par Al de Humboldt et A. Bonpland, rédigé par A. de Humboldt. Paris: Smith, Tomo 3, 1825.
LIVI-BACCI, M. The depopulation of upper Amazonia in Colonial times. Revista de Indias, v. LXXVI, n. 267, p. 419-48, 2016.
_________. Conquest. The destruction of the American indios. Cambridge: Polity Press, 2008. MARTÍ, M.; CANEDO, L. Documentos relativos a su visita pastoral de la Diocesis de Caracas. Fuentes para la historia colonial de Venezuela. Caracas: Academia Nacional de la Historia, 7 vols. 1989. OVIEDO Y BAÑOS, J. de. Historia de la conquista y población de la Provincia de Venezuela ilustrada con notas y documentos por el capitan de navio Cesareo Fernandez Duro. Madrid: Luis Navarro, Editor, 1885 [1723].
OVIEDO, F. G. Historia general y natural de las Indias. Madrid: Biblioteca de Autores Españoles, 5 vol., 1992.
RIONEGRO, F. R. Misiones de los padres capuchinos. Pontevedra, 1930.
RIVERO, J. Historia de las Misiones de los LLanos de Casanare y los Rios Orinoco y Meta. Bogotá, 1883.
ROSENBLAT, A. La población indigena y el mestizaje en America. La población indigena. Buenos Aires: Editorial Nova, v. I, 1954.
SIMON, P. Noticias historiales de las conquistas de Tierra Firme en las Indias Occidentales, 1882. VAZQUEZ DE ESPINOSA, A. Compendio y descripción de las Indias Occidentales. Washington: Smithsonian, 1948.
VELASCO, J. L. de. Geograia y descripción universal de las Indias. Madrid: Fortanet, 1894. VILA, P. Geograia de Venezuela: el territorio nacional y su ambiente isico. Caracas: Ministerio de Educacion, v. 1, 1960.
_________. Geograia de Venezuela: el paisaje natural y el paisaje humanizado. Caracas: Ministerio de Educacion, 1965.
About the author
Massimo Livi Bacci is doctor in Scienze Politiche. Emeritus professor of University of Florence, Italy.
Contact address
Via Baldesi, 18 50131 – Firenze, Italia
Resumo
O melting pot venezuelano: 1500-1800
do inal do período colonial com acesso a fontes de documentos originais. Até meados do século XVII, alguma informação quantitativa foi coletada pelos missionários jesuítas, capuchinos e franciscanos e, na última década do século XVII, pela administração colonial e pelas autoridades religiosas. A população nativa, que era de 200.000 a 500.000 habitantes (estimativas de autores modernos), diminuiu para talvez 120.000 em 1800, de acordo com a estimativa de Hambold. É possível que o declínio inicial tenha se tornado mais acentuado após a primeira pandemia de varíola de 1580 e tenha continuado, em um ritmo mais lento, até a Independência. Como em outras regiões da América Latina, os casamentos eram precoces e quase universais, e a elevada taxa de nascimentos sobre mortes parece indicar um alto potencial de crescimento, interrompido pelas frequentes crises de mortalidade. Uma causa competitiva para o declínio da população nativa foi o processo de mestiçagem intensiicado com o aumento da população de origem europeia e africana.
Palavras-chave: Venezuela. População. Missões. Mestiçagem.
Resumen
El melting pot venezolano 1500-1800
Nuestro conocimiento sobre la demograia de la población autoctóna de Venezuela durante la Colonia es limitado. Hasta la mitad del siglo XVII, las narraciones de los primeros conquistadores, de los misioneros y de los funcionarios ofrecen algunas escasa información y lo mismo puede decirse de algunos autores que escribieron en tiempos posteriores con acceso a fuentes originales. Después de la mitad del siglo XVII, la información de tipo cuantitativo se debe a los misioneros capuchinos, jesuitas y franciscanos, y, en las últimas décadas del siglo XVIII, a la administración de la Colonia y a la Iglesia. Algunos autores contemporáneos estiman la población autóctona al contacto entre 200.000 y 500.000 habitantes, que se redujo a 120.000 en 1800, según las evaluaciones de Humboldt. Es posibe que el declive inicial se haya accelerado por causa de la primera pandemia de viruela en la década de 1580, y que haya continuado a un ritmo más lento hasta la independencia. Como en otras poblaciones de América del Sur, los nativos de Venezuela se casaban muy temprano, y muy pocos permanecían solteros, además de que la razón muy alta entre nacimientos y defunciones indica un potencial de crecimiento demográico muy elevado, interrumpido por frecuentes crisis de mortalidad. Una concausa del declive demográico de la población autóctona fue seguramente el proceso de mestizaje, muy acelerado como consecuencia del crecimiento de las poblaciones de origen europeo y africano. Palabras clave: Venezuela. Población. Misión. Mestizaje.