Learning, Portfolio Complexity and Informational Asymmetry in Forecasts of
Sell-Side Analysts
Melquiades Pereira de Lima Júnior†
Instituto Federal de Educação do Rio Grande do Norte IFRN
ABSTRACT
The aim of this study was to analyze the association of learning and complexity in the target price forecasts and sell-side analysts’ recommendations on the BM&FBovespa. The sample comprised forecasts of 195 stocks, 75 brokers and 569 analysts between 2005 and 2013, analyzed by linear models with panel data. Our results suggest that the experience with the stock, with the sector
and complexity of the portfolio conirmed the learn by doing, but the overall experience showed
contradictions due to information asymmetry. Despite anchoring in their peers, analysts achieved
signiicant returns, but showed forecasts with low accuracy. Therfore, we concluded that more
experienced analysts may intentionally contradict themselves in an attempt to bias the market. Finally, we suggest the development of less biased analyst rankings in order to increase the competitiveness and quality in the results of the analyzes.
Keywords: Financial analysts; Target price forecast; Stock recommendations; Learning; Portfolio complexity.
*Author for correspondence:
†. Doutor
Institution: Instituto Federal de Educação do Rio Grande do Norte IFRN Rua Pedro de Souza nº 141, Condomínio Solar
Portal do Potengi apartamento 413, Bloco E, Bom Pastor, Natal - RN, Brazil E-mail: [email protected]
Note from the Editor: The article was accepted by Bruno Felix.
1. INTRODUCTION
T
he inancial market analysts regularly conduct target price and proit forecasts in order to support their recommendations to buy and sale assets on the stock market. For such purpose, they use tools and ability to price these assets at a given time horizon. Issued reports aim to provide good analyzes to their customers, contributing to operations that enable maximizing investors returns (CHUNG; JO, 1996).In the exercise of their activities, there are elements that improve or deteriorate the performance of these forecasts. However, few studies have observed these mechanisms in the Brazilian market, which shows the need to verify how these professionals practice, how they observe their mistakes and those by their peers. Based on these elements, we can verify how their forecasts and recommendations can be improved (MARTINEZ, 2007; 2008; 2009).
This study aimed to analyze the association of learning and complexity of the portfolio in sell-side analysts’ target price forecasts and recommendations consell-sidering the information asymmetry
on the BM&FBovespa. The learning analysis in the forecast is a relection of the evolution of
performance with the experience in the industry, the complexity of the hedging portfolio and the
informational efect of the revisions in analyzes.
Research by Mikhail, Walther and Willis (1997) investigated the efects of learning by
repetition, based on learn by doing, with the argument that the abilities of each individual are not homogeneous. The metrics used as a proxy for experience, based on the number of forecasts performed repeatedly in a given period, including categorization by asset and sector.
The results by Mikhail, Walther and Willis (1997), as those by Jacob, Lys and Neale (1999) and
Clement (1999) demonstrate ample evidence that the experience with the irm in the North American
market contributes to improvements in accuracy. These surveys focus on observing whether these experience metrics promote improvements in their results, observing recommendations’ accuracy and returns. In the analysis of experience, we can observe whether analysts are performing new analysis or just replicating previous reports.
The complexity of the hedging portfolio is another factor that afects the analyst’s cognitive
ability. Clement (1999) provides evidence that the increased complexity, which is the number of
companies and sectors that the analyst covers in their portfolio, reduces accuracy. This efect is
especially important for brokers, for it contributes to observe ways in which analysts can organize themselves into teams which enable better results.
Informativity also inluences the activity, because the role of analysts is to convey information
those by their peers in face of previous forecasts, or if analysts are simply copying modiications
previously made (BRAV; LEHAVY, 2003; ASQUITH; MIKHAIL; AU, 2005).
Despite the empirical evidence, there are elements in the Brazilian market showing evidence that some of these mechanisms of improvements do not work the same way as in the countries investigated. Studies by Martinez (2007, 2008 and 2009) and Saito, Villalobos and Benetti (2008) show evidence that in Brazil, analysts present lower performance than in other markets such as
the North American. Furthermore, economic characteristics can also inluence this process, as the market instability, smaller amount of traded assets, the diferentiated amount of the investor population and, especially by the absence of efective mechanisms that promote competition in the
industry.
In Brazil there are few rankings and awards that encourage improvements in the activity. We enumerate the Institutional Investor ranking that works by the voting of managers, the award of the Association of Investment Analysts and Professionals of the Capital Market (APIMEC) that works by vote among peers and the ranking of the State Agency Broadcast which analyzes only registered analysts for the return of their recommendations. Some of these mechanisms are questioned due to biases that their methodologies present (EMERY; LI, 2009).
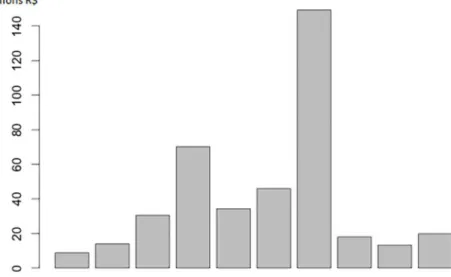
Another reason for this research is due to the growth in the volume of public oferings in
recent years, see Figure 1. The growth in the number of traded assets and increased informational
eiciency reinforce the idea that analysts’ experience and their portfolios complexity are following
the evolution and the increase in transactions (MOBAREK; FIORANTE, 2014).
Evidence in Brazil found by Martinez (2009), using earnings forecasts show that there are
improvements with the experience, but no efects were observed on the complexity of hedging
Source: BM&FBovespa.
portfolio. Given the lack of research in the Brazilian market, and speciicities in relation to other
markets already researched, this gap motivated the need to understand how analysts improve their forecasts and recommendations abilities, especially by analyzing the target price, a variable which is little explored.
The advantage of the target price use are evidence of aspects less conlicting than earnings
forecasts. This consideration is based on the following results: (i) target price forecasts seem to be
less biased by inluences such as conlicts of interest of individuals, and (ii) the efect of informational
target price revisions have greater information content than revisions of earnings forecasts. Such evidence indicate attractiveness for the analysis of this variable (ASQUITH, MIKHAIL, AU 2005; KERL, 2011).
This research is distinguished for its approach of the period between 2005 and 2013
in the Brazilian market, as well as the learning efects with regard to target price forecasts and
recommendations (buy/sell/hold) by sell-side analysts. We believe that the evidence of improvements in forecasts and recommendations in emerging markets such as Brazil allows us to assume that the relationship between learning, portfolio complexity and accuracy may demonstrate new behaviors, including observation of how the improvement of this process occurs over time.
This work was structured as follows: topic 2 presents a survey of previous empirical evidence; topic 3 describes the performance metrics used; topic 4 lists the hypotheses based on previous studies; topic 5 explains the data sample used; topic 6 details the method used based on the previous
items; topic 7 analyzes the results; and topic 8 the inal considerations.
2. PREVIOUS STUDIES
Research addressing analysts’ forecasts are began over half a century ago, starting with discussions on the role of analysts (e.g. Godfrey, 1953). Ramnath, Rock and Shane (2008) and Bradshaw, Brown and Huang (2013) summarize that most studies investigate forecasts based on corporate earnings estimates, based on exploring the determinants of good forecasts and the existence of biases of agents in the development of this activity.
According to Bradshaw (2002), target price forecasts are used by analysts as a way to support the recommendations to their investor clients. When the recommendation suggests buying, the prediction is that the company’s value is undervalued; when holding is suggested the asset presents an approximately fair value, and when selling is suggested, the expectation is that the company’s value is overvalued.
Brav and Lehavy (2003) and Asquith, Mikhail and Au (2005) performed na informational
(2003) is that analysts converge the degree of recommendation to convey conidence in their price forecast. Based on this argument, Brav and Lehavy (2003) conirmed the argument by Bradshaw
(2002) that forecasts support recommendations.
However, there is evidence that this relationship between forecast and recommendation presents moments of informational asymmetry, because analysts are better informed than investors.
This asymmetry can stimulate changes in interest and modiications in the status of recommendations
(BRADSHAW, 2002). In some cases, these incentives provide an imbalance in analyst reports, which in somecases therefore, will prefer not to disclose their analyzes.
his efect of suppressing certain analysis is termed as self-selction bias, which means that
analysts prefer not to disclose price forecasts when these do not support their recommendations or when they are uncertain about their estimates (BRADSHAW, 2002). When this occurs more often, recommendations in some cases may present imbalances in the buy, hold and sell ratio. For this
reason, Francis and Sofer (1997) argue that the trend in the proportion of reports to buy rather than
to hold and sell is intentional.
Considering the imbalance in recommendations, Asquith, Mikhail and Au (2005) observed
the diferentiation between revisions for less (downgrades) and revisions for more (upgrades). An important sign is that investors react more signiicantly when reports show reviews for less
(downgrades). The excess of buying recommendations and information asymmetry can explain the reason for optimism normally observed by research.
The results presented by the imbalance of forecasts and recommendations also allow criticism regarding metrics. In the Italian market, Bonini et al (2010), in turn, criticize the traditional metric of accuracy, especially by signs of no reversion to the mean and the autocorrelation. These elements
make it diicult to analyze the determinants, which afects previous evidence. For this, it is necessary
to use models for analysis to correct these aspects. Although investors do not consider the accuracy
of target prices as a diferential, as they focus on recommendations, the metric is defended by
Bradshaw, Brown and Huang (2013) as an important measure of the analyst’s performance, as it is a way to validate the recommendation.
Kerl (2011), in the German market, also focused on analyzing the accuracy of target prices, but from another viewpoint. The main results show persistence in accuracy, as well as in buying
recommendations, which corroborates the efects previously discussed. In spite of this, Bradshaw,
Brown and Huang (2013) analyze the determinants and the behavior of errors over time and show that analysts have limited capacity to persistently perform forecasts with accuracy.
of projections; and Martinez (2009), who investigates the determinants of accuracy. The main
indings by Martinez (2007) were: the poor accuracy performance and forecasting errors, which are
corelated to prior period errors, which is also evidence found in Martinez (2008).
Martinez (2009) shows that analysts of Brazilian companies showed a persistent optimism on average. Despite the optimism, the result by Martinez (2008) complements the evidence that there
are moments of pessimism in the market, demonstrating diferent impacts for negative and positive
revisions. But the most evident in this latest survey is that the Brazilian market is more sensitive to bad news than developed markets such as the North American.
Recently, the research by Dalmacio et al (2013) analyzed the impact of governance practices in the accuracy of analysts. The research presents strong relationships in improving the accuracy in
the level of the irm’s corporate governance. On the other hand, the research by Matinez and Dumer (2014), which analyzes the efect of the performance on the adoption of International Financial Reporting Standards - IFRS in Brazil, no signiicant association of improvements with this change
were observed.
The studies by Saito, Villalobos by Benetti (2008), on the other hand, investigate the determinants of the quality of forecasts of market analysts. The research points out the reasons why
analysts in Brazil have lower performance, among the limitations: (1) diiculties related to the
economic instability of the country; (2) the limitations of analysts’ abilities in the Brazilian market, especially in relation to more sophisticated statistical models; and (3) the stability of the economy
and the results of companies in other markets are more easily foreseen. In general, it is conirmed
in research by Martinez (2007, 2008 and 2009) and Saito, Villalobos and Benetti (2008) that the
Brazilian market for inancial analysts need improvements in the quality and performance of the services ofered.
3. PERFORMANCE METRICS
Despite recent criticism on the ways of measuring the accuracy and bias by Bonini et al (2010), in this study we opted for the classic metrics used in previous studies, as the evidence found
were not clearly diferent from those found by the metrics already used. We summarized by using
bias, the accuracy, returns and informativity of forecasts and recommendations.
3.1. Bias
This metric attempts to capture the forecasting errors. Equation 1 refers to Percentage Forecast Error from the percentage diference between Forecast Price, which is the expected price
the bias of estimates, considering each asset at time . If the average of forecast errors is negative
and signiicant, then the forecasts were higher than the results, demonstrating optimistic bias. If positive and signiicant, then there is a pessimistic bias (BRADSHAW; BROWN; HUANG, 2013).
3.2. Accuracy
Equation 2 tries to capture the absolute error, Percentage Absolute Forecast Error, obtained by the absolute percentage relationship between the Forecast Price, which is the expected price months before and the Last Price, closing price months after this forecast. This metric relects the accuracy of forecasts, considering each analyst , asset at time . The closer the averages of are to zero, the greater the accuracy (BRADSHAW; BROWN; HUANG, 2013).
3.3. Returns for the recommendation
The gain from the buy/hold/sell rating recommendation, termed as is the analyst’s recommendation for the period. The recommendation is rated on a continuous scale from 1 to 5, in which 1-sale, 2-weak sale, 3-hold, 4-weak buy, 5-buy. The annual cumulative return Cumulative Returns of Recommendation is calculated by the recommendation of the return for months derived
from the diference between the last price negotiated months before and the price negotiated
subsequently (BRADSHAW; BROWN; HUANG, 2013).
The return calculation on the recommendation is performed by Equation 3, wherein the accumulated return is calculated according to the recommendation , considering each analyst ,
asset at time . This return is nothing more than the percentage diference of positions to buy and
sell assets.
We also used Cumulative Market-Adjusted Return calculated by adjusting the cumulative
return to the market in the equation 4. The adjusted return is derived from the mean diference
between the return of recommendation and the market return Cumulative Market Return for each time period . The market return is calculated by the return from the variation of the index score that represents the market (BRADSHAW; BROWN; HUANG, 2013).
(2) (1)
3.4. Informativity
The informativity metric measures the association between revisions of forecasts of analysts and the abnormal returns on assets . According to Givoly and Lakonishok (1979), it is the abnormal relationship between the direction of revisions and the return of recommendations, verifying the market reaction by revealing analysts’ revisions. It is worth noting that the revisions are measured by the percentage variation of the forecast.
The informativity coeicient is measured by beta , as it is calculated by regressing the abnormal returns, of the equation 4, by revisions of each asset and period , according to equation 5. It is worth noting that this work deals with revisions of price forecasts. The higher the beta, the
greater the informational efect will be.
4. HYPOTHESES
4.1. Learning through experience and the complexity of the portfolio
The starting point for analysts’ learning analysis were through research by Mikhail, Walther and Willis (1997), Jacob, Lys and Neale (1999) and Clement (1999),
performing analyzes based on the experience and complexity of the industry. The models build the relationship between performance metrics and determining variables of experience, the complexity of assets portfolio and the absorption of information by individuals.
Jacob, Lys and Neale (1999), by contrast, argue that the simple and direct association between
experience and accuracy is fragile because not all experiences by repetition have signiicant efect
on returns. Therefore, the results by Martinez (2007) present some evidence of these contrapositions
in the earnings forecasts of Brazilian irms. As the learning analysis was not part of the central
discussion by Martinez (2007), and because of the particularities presented in the Brazilian market we centralized our central hypothesis in the analyst’ experience.
In emerging markets it is also possible to observe the experience of associations with accuracy. However, the results by Karamanou (2012) were general, considering several emerging countries in the world. Due to the heterogeneity between countries used in the sample, it was necessary
to perform a cross section in Brazil, mainly due to its diferent economic characteristics to other
developing countries that were investigated Chile, Turkey, Thailand, Korea and China. (4)
By using the learn by doing principle used by Mikhail, Walther and Willis (1997), Jacob, Lys and Neale (1999) and Clement (1999), the metrics that we take as a basis in hypothesis 1 from equation 6 were measured as follows: EXPGEN we count the number of previous periods that the analyst issued a forecast; EXPSETOR we count the number of previous periods that the analyst issued a forecast for a particular sector; and, EXPASSET we count the number of previous periods that the analyst issued a forecast for a particular asset. Based on the studies, we expect that increasing experience contributes to a reduction of forecast errors.
H1: Experience in the execution of forecasts contributes to improved accuracy
Regarding the complexity of portfolio, research by Clement (1999), Duru and Reeb (2002) and Hirst, Hopkins and Wahlen (2004) assume that analysts lose quality in their forecasts from
the moment the portfolio diversiies. Lobo, Song and Stanford (2012) claim that the increase in
expertise in certain companies and sectors helps to improve analysts’ forecasts. Hirst, Hopkins and
Wahlen (2004) obtained evidence that analysts who follow fewer irms than the average make better
forecasting decisions.
Nevertheless, the study by Martinez (2009) failed to observe this efect with respect to earnings
forecasts in Brazilian companies. It is worth mentioning that there is no evidence neither for the analysis of this relationship based on target price forecasts. For this reason, we added two metrics of complexity: NSETOR, which refers to the number of sectors that the analyst covered for the period; and NASSET which corresponds to the number of assets that the analyst covered for the period. Based on studies, we expect that the increased amount of sectors and assets that the analyst covers contribute to reducing accuracy and increasing forecasting errors.
In order to ind more answers, equation 6 was also analyzed from the perspective of bias.
Hypothesis 2, according to equation 7, contributes to verifying that the experience and complexity
measures are also associated to the efects of the analyst’s pessimistic or optimistic behavior. This
association is based on the study by Duru and Reeb (2002), by observing aspects that increased accuracy is associated with the pessimistic bias, to a conservative behavior of the individual.
We expect based on research by Duru and Reeb (2002) that the increase of experience is associated with a pessimist behavior. It is assumed that the increase of experience causes the analyst to become more conservative, which contributes to better results. Regarding the complexity of the
portfolio, we expect to understand, on an exploratory basis, the efect of diversiication.
On the hypothesis 3, equation 8, we insert the discussion on the learning efect on returns
achieved from analysts’ recommendations. As there is no evidence in Brazil, we used as a basis the research Mikhail, Walther and Willis (2003) who found evidence that the experience did not show association with the returns of the recommendations. We expect for experience not to present
signiicant association in Brazil in relation to returns.
H3: Experience in performing the forecasts does not contribute to abnormal returns
Considering the complexity of the portfolio, we are based on the studies by Clement (1999), Duru and Reeb (2002) and Hirst, Hopkins and Wahlen (2004) who found that analysts lose quality
in their forecasts from the moment the portfolio diversiies. Thus, in hypothesis 3, we expect that the
metrics related to the complexity of portfolios to hinder obtaining abnormal returns.
4.2. Learning through the use of information
The informativity is the degree to which the revisions of forecasts impact the movement of
asset prices. In the analysis by Givoly and Lakonishok (1979), considering an ineicient market,
abnormal returns can be observed months after the revisions of forecasts, and this shows that the
reaction is not instantaneous. these efects in emerging markets were also found by Moshirian, Ng
and Wu (2009), But these evidence indicate that they have a lower degree of informativity.
Little evidence was found considering the forecast prices, and research by Brav and Lehavy (2003) and Asquith, Mikhail and Au (2005) show strong association between revisions of forecasts
and market returns. In particular, Brav and Lehavy (2003) found efects of persistent informativity
up to six months after the revisions. Despite these persistent signs of these abnormal changes, we observe that these disorders tend to disappear in the long term (GIVOLY; LAKONISHOK, 1979).
In Brazil, considering the proit projections, Martinez (2008) found low informativity evidence,
as did Moshirian, Ng and Wu (2009) in emerging markets. Considering that Brazil has increased
over time, which motivated us to check their level of information in relation to the target prices in Brazil.
The efect of the revisions on prices seek to verify the analyst’s ability to observe changes in
previous forecasts. Knowing this, we can see the individual revisions of the actual analyst, as well as the change in consensus forecasts. In contrast, Asquith, Mikhail and Au (2005) refute the association
of individual reviews, showing that these efects are only reiterations.
The argument used by Asquith, Mikhail and Au (2005) starts to make sense when we consider the consensus1 of forecasts. According to Campbell and Sharpe (2009), analysts are anchored in the
consensus of their peers. Williams (2013) explain that the anchoring relationship among peers is an over-estimation that individuals do with others. Then there is the possibility that the consensus
forecast revision exhibit greater informational efect than analysts’ individual revisions.
Recent evidence by Clement, Hales and Xue (2011) show signiicant efects that the increase
of the consensus revisions cause an increase of individual revisions. This result proves that analysts observe revisions of other analysts before submitting their own revisions, and this leads to the hypothesis that the consensus of the revision is more associated with abnormal returns than individual revisions. Based on this discussion, hypothesis 4 investigates the informativity from the perspective of the percentage of revision of the forecasts of analysts individually REV and the percentage of revision of the consensus of forecasts CREV.
H4: The consensus revision is more associated with abnormal returns than with analysts’
individual revisions
To analyze the informational efect between individual revisions and consensus revisions we will use three reference models. Equation 9 veriies the association between the individual revisions
REV and the consensus revisions CREV in abnormal market returns CMAR. Considering the possibility of lag, we also use the same variables REV and CREV with 1 lag.
In the research by Asquith, Mikhail and Au (2005), individuals react more intesively when revisions are for less (downgrades), which allows us to assume that these revisions are absorbed
diferently. Because of this diference between positive reviews (upgrades) and negative revisions
(downgrades), we inserted the variables REVGRADE and CREVGRADE, which assume the values of 0 or 1.
1 he measurement of consensus is the average of all target price forecasts for the last three months
REVGRADE is a dummy of analysts’ individual revisions, in which positive (upgrade) corresponds to 0 and negatives (downgrade) to 1, and the CREVGRADE, is a dummy for consensus revisions, in which positive (upgrade) corresponds to 0 and negatives (downgrade) to 1. These controls are based on evidence by Asquith, Mikhail and Au (2005). The control log(VOLM), trading
volume of the asset, is justiied by the eiciency of results by Bonini et al (2010).
Another variable that we use as a proxy for informational efect is the trading volume. Chae
(2005), Brown, Crocker and Foerster (2009) and Bamber, Barron and Stevens (2011) explore the argument that the trading volume of a proxy for the informativity in the market. This argument is used from the impact received by the trading volume from a decision on the market. Therefore,
we proposed the informativity analysis by regressing the variable by the variation of the
revisions of price forecasts previously detailed.
Hypothesis 5, in equation 10, use the trading volume as a proxy for informativity, instead of
CMAR. As the evidence discussed in hypothesis 4, we expect that the efects of consensus revisions are also more signiicant than the individual revisions.
H5: The consensus revision is more associated with traded volume returns than with
analysts’ individual revisions
Finally, the third performance metric used to check informational efects was the accuracy.
Clement, Hales and Xue (2011) noted the increased accuracy from the increase in analysts’ revisions.
Thus, hypothesis 6, through equation 11, uses the argument as a way to verify if revisions afect
learning for future forecasts. We expect that revisions in general have a positive association with the accuracy.
H6: The consensus revision is more associated with analysts’ accuracy than their own
individual revisions
5. DATA
From Bloomberg® we collected data on asset prices, their forecasts and recommendations of
The selected companies were all those with assets traded on the BM&FBovespa. The list showed the total of 404 companies and 641 stocks. For the sample, only 195 securities of 176 companies had forecasts in the window used. Thus, out the total of 404 companies registered on the BM&FBovespa, only 44% took part in the research. The database with individual forecasts and recommendations resulted in a total of 62,548 observations. In relation to brokers, 75 of the 80 registered on the BM&FBovespa took part in the research, and 569 of the 1,102 registered analysts in the Association of Investment Analysts and Professionals of the Capital Market - APIMEC. Data collection was performed on a daily basis, though, to optimize the relationships, we used monthly averages.
6. RESEARCH METHOD
The hypotheses were investigated using linear models in panel or longitudinal, according to equation 12. Each dependent variable yit of each individual observed i at time t was evaluated by n determinants Xitβ, considering, also, speciic control variables according to each hypothesis tested.
The use of panel models contribute to obtaining higher degree of freedom and increased eiciency
of parameters estimation, as well as assisting to observe elements in time, termed as ci.
In a cross-examination, without considering this efect, the component ci is within the term error uit, reducing the explanation of the dependent variable (BALTAGI, 2008; PETERSEN, 2009; WOOLDRIDGE, 2010). For the analysis of the individual on the panel, we built an indexer from
the concatenation between the analyst’s identiication variable ANALYST and asset identiication
ASSET, for it is a two-dimensional panel between each i = analyst&company in each time period t. The unbalanced panel is common in this type of study due to the fact that not all companies have price forecasts at all times. As it is not intended to make comparisons between individuals, but to analyze the determinants of the metrics, the panel balancing is not required, avoiding information
losses. Nor did we any model to complete the panel due to the large data gap in the irst years, which could lead to unrealistic results. The unbalanced panel is justiied to contain all market forecasts in
the period analyzed (OBRIEN, 1987; SO, 2013).
In using the Ros software, for the most part, the models used presented ixed efect, according
to test results of grouped OLS, Breusch-Pagan’s Lagrange Multiplier (1980) and Hausman’s
speciication test (1978). Since this is a long panel, the autocorrelation test becomes more rigorous
for a more reliable estimate of parameters, therefore the test by Breusch (1978) and Godfrey (1978) served as a basis. The test results of all models presented evidence of serial autocorrelation in residues, as well as the presence of heteroscedasticity. All tests are described in Appendix.
The presence of autocorrelation and heteroscedasticity afect the covariance matrix, causing
loss of the models reliability. To resolve this problem, some studies have suggested the use of more robust alternatives, as Clatworthy, Peei and Pope (2007) and So (2013); thus, a simple solution was to estimate the models using robust standard errors corrected for the autocorrelation and heteroscedasticity, proposed by Arellano (1987).
7. DISCUSSION OF RESULTS
7.1. Descriptive statistics
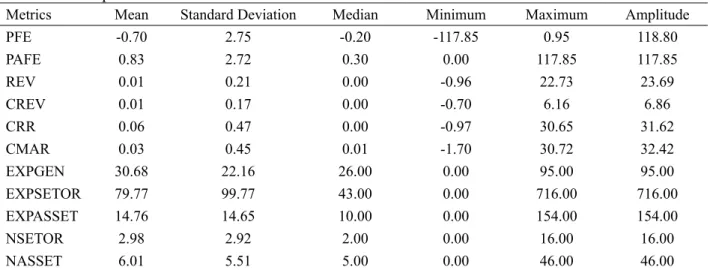
For the analysis, each performance metrics was analyzed for its descriptive statistics,
according to Table 1. In the irst analysis, price forecasts have shown on average, with an optimistic
bias, considering an average PFE at -0.70, including a minimum of -117.85 points and a maximum of 0.95.
This observed optimism exceeds the results by Schipper (1991); Dreman and Berry (1995); Conroy and Harris (1995); Brown (1996); and Beaver (2002) in the North American market, as well as Martinez (2007) in Brazil, considering earnings forecasts. The individual bias showed more optimism that the results of the consensus bias de -0.41.
The accuracy PAFE was demonstrated around 0.83 points, above the average by Hilary and Hsu (2013) and Bradshaw, Brown and Huang (2013) in the North American market and by Bonini et al. (2010) and Kerl (2011) in European markets. Individual errors presented less accuracy than
the results of bias consensus 0.53, and this result conirms the argument by Givoly and Lakonishok
(1984) that the consensus forecast errors are lesser.
The standard deviation was also greater individually, showing less consistency of forecasts, even in comparison with other markets. The annual returns resulting from the recommendations CRR resulted in a cumulative average of 6% and an average premium of 3% above the market CMAR. The annual consensus returns were also higher, with average CRR at 13% and average CMAR at 6%.
The variable EXPGEN shows that, in general terms, analysts have obtained an average of 2.5 years of experience, compared to 6.5 years in the North American market. Experience with assets resulted in an average of 1.2 years, compared to 3 years in the North American market. The results
relect a less experienced market compared to other more developed ones (YU, 2000).
Table 1. Descriptive Statistics.
Metrics Mean Standard Deviation Median Minimum Maximum Amplitude
PFE -0.70 2.75 -0.20 -117.85 0.95 118.80
PAFE 0.83 2.72 0.30 0.00 117.85 117.85
REV 0.01 0.21 0.00 -0.96 22.73 23.69
CREV 0.01 0.17 0.00 -0.70 6.16 6.86
CRR 0.06 0.47 0.00 -0.97 30.65 31.62
CMAR 0.03 0.45 0.01 -1.70 30.72 32.42
EXPGEN 30.68 22.16 26.00 0.00 95.00 95.00
EXPSETOR 79.77 99.77 43.00 0.00 716.00 716.00
EXPASSET 14.76 14.65 10.00 0.00 154.00 154.00
NSETOR 2.98 2.92 2.00 0.00 16.00 16.00
NASSET 6.01 5.51 5.00 0.00 46.00 46.00
PFE is the percentage of the analyst’s forecast error. PAFE is the absolute percentage of the analyst’s forecast error. REV is the percentage of forecast variation. CREV is the percentage variation of analysts’ consensus forecast. CRR is the cumulative return of the analyst’s recommendation. CMAR is the cumulative return of the analyst’s recommendation adjusted to the market. EXPGEN is the number of prior forecasts periods that the analyst issued as a whole. EXPSETOR the number of prior forecast periods that the analyst has issued on a particular sector. EXPASSET is the number of prior forecasts periods that the analyst issued on a particular asset. NSETOR is the number of sectors that the analyst issued forecast in the period. NASSET is the number of assets that the analyst issued forecast in the period. All means
were signiicant at 99% conidence.
the portfolio, possibly due to the lower amount of assets in the market (MCNICHOLS; O’BRIEN, 1997; BARTH; KASZNIK; MCNICHOLS, 2001).
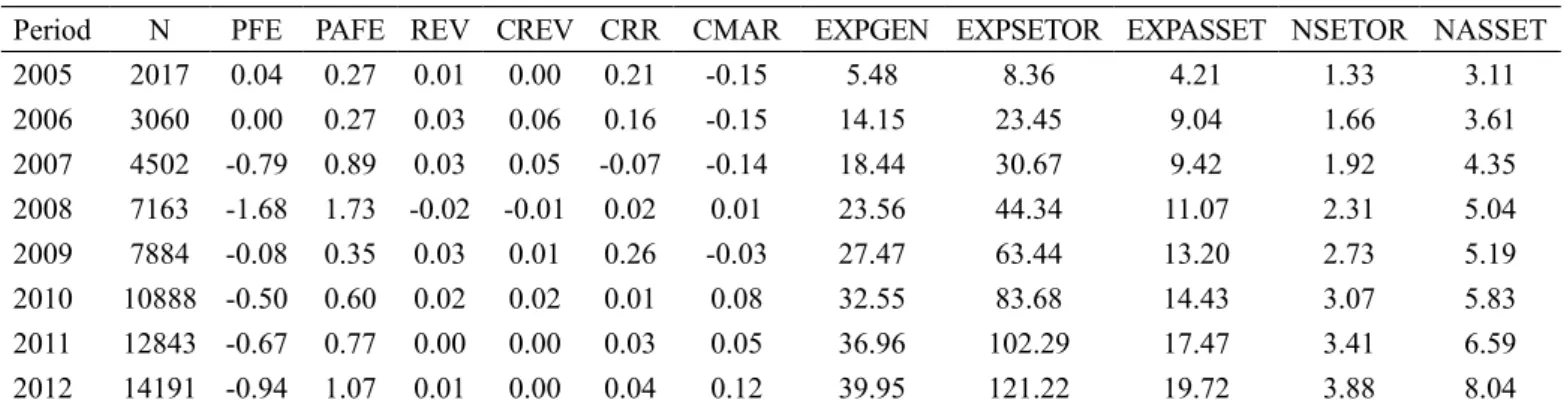
7.2. Evolution in time
To analyze the evolution over the years, it was possible to extract the current means of the variables used in the study, and Table 2 shows this extract. The bias over time changes according to the economic instability in the market, with excesses during the economic crisis in 2008 of -1.68. The explanation for this behavior is that possibly, analysts have not considered the impact of the crisis in the Brazilian market, which creates excessive optimism and consequently greater PAFE forecast errors.
In the period of crisis, individual and consensus reviews became negative, which shows the attempt to contain errors in the period. The reduction of individual and consensus revisions in the
last three years 2010-2011-2012 possibly afected the accuracy, causing the errors to increase over
recent years. This initial result shows the weakness in the accuracy of analysts, especially with the argument by Saito, Villalobos and Benetti (2008) on the low use of more sophisticated statistical techniques in this market.
In addition to accuracy, the cumulative returns of the recommendations were not as signiicant
in the last three years, obtaining returns of 1%, 3% and 4% respectively. Nonetheless, there was
shows that returns of recommendations are not always associated with improved accuracy, also observed by Lim (2001).
It was also possible to observe that both the experience and complexity of the portfolio in general, by asset and by sector, increments obtained over the years. The overall experience increased to 3.2 years, with the asset to 1.6 years and 10 years in the industry. This result shows that in Brazil, analysts remain always focused on a particular industry, alternating only the target asset in their portfolio.
The number of reports issued by analysts has grown considerably, as well as the average number of assets in the portfolio, which reached eight stocks. The average number of sectors that the analyst covers was close to four segments. Thus, despite the increase in coverage and issued reports, accuracy has been reduced in recent years, showing possible evidence that growth in the number of reports does not match the improvement in the quality of the results.
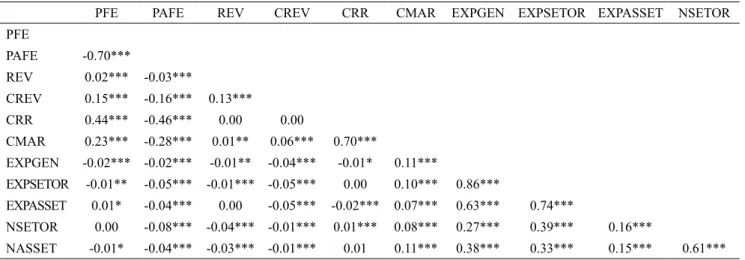
7.2. Correlation matrix
As the variables present evidence non-linearity for the development of correlations, we used the Spearman’s correlation between the variables. Regarding the result of the matrix, we obtained few strong and
signiicant correlations. They were considered weak below 0.3, medium till 0.6, and strong above 0.6. Based
on these criteria, we highlight the main relationships found.
The result of the matrix demonstrates, irstly, an inverse relationship between the bias PFE and the accuracy PAFE of -0.7. The Association presented conirms that the increased pessimism possibly causes
a more conservative behavior in the individual, contributing to the increase in accuracy. This conservative
efect also presented evidence of a positive association with returns from the recommendations CRR of 0.44.
This result explains that analysts who get more returns are more conservative in their forecasts.
Table 2. Annual Means of Variables.
Another important highlighted association is that the increase of accuracy is not directly associated with the increase of the recommendations returns. PAFE presented an association of -0.46 for CRR and -0.28 for the CMAR. This result corroborates with Lim (2001), for whom
accuracy will not always relect in positive returns due to conlicts that may occur between estimates
and recommendations by the actual analyst. The explanation for this association is that, at times, the analyst changes their recommendation even if not in accordance to their own forecast, due to informational asymmetry.
Finally, other relationships observed showed only minor associations. The independent
variables, experience and complexity of the portfolio showed signiicant relationships with each other, presenting collinearity. However, the models used in panel are not afected because of
multicollinearity (BALTAGI, 2008).
7.3. Analysis of learning through experience and complexity of the portfolio
Table 4 shows the evaluation results of the analysts’ experience and the complexity of the
portfolio. The irst results are of hypotheses 1, 2 and 3 associated with the learning of the analyst,
with both the accuracy as with the bias and the returns of the recommendations. The log(VOLM) control, which is the trading volume of assets in the period, has been previously used by Bonini et al (2010).
Based on the study by Asquith, Mikhail and Au (2005), the variable REVGRADE was inserted to control the imbalance between revisions for less (downgrades) and revisions for more
(upgrades). This control shows that investors react more signiicantly when reports show revisions
for less (downgrades).
Due informational asymmetry control purposes, we calculate the so-called variable
CONFLICT; this dummy variable is classiied with 1 when there is conlict to the rule according to
Bradshaw (2002) between the forecast and the recommendation and 0 when the rule is followed
and there is no conlict. Informational asymmetry comes from the imbalance between the indication
of the forecast and the analyst’s recommendation. Another control variable was the variation of the Bovespa index, and this choice was made due to the change in the market in 2008; probably because
of the economic crisis, the IBOV variable tries to control the efects of the economic movement.
PFE PAFE REV CREV CRR CMAR EXPGEN EXPSETOR EXPASSET NSETOR
PFE
PAFE -0.70***
REV 0.02*** -0.03***
CREV 0.15*** -0.16*** 0.13***
CRR 0.44*** -0.46*** 0.00 0.00
CMAR 0.23*** -0.28*** 0.01** 0.06*** 0.70***
EXPGEN -0.02*** -0.02*** -0.01** -0.04*** -0.01* 0.11***
EXPSETOR -0.01** -0.05*** -0.01*** -0.05*** 0.00 0.10*** 0.86***
EXPASSET 0.01* -0.04*** 0.00 -0.05*** -0.02*** 0.07*** 0.63*** 0.74***
NSETOR 0.00 -0.08*** -0.04*** -0.01*** 0.01*** 0.08*** 0.27*** 0.39*** 0.16***
NASSET -0.01* -0.04*** -0.03*** -0.01*** 0.01 0.11*** 0.38*** 0.33*** 0.15*** 0.61***
Table 3. Correlation matrix.
Note: *p < 0.1; **p < 0.05; ***p < 0.01.
PFE is the percentage of forecast error. PAFE is the absolute percentage of forecast error. REV is the percentage variation of individual forecast of analysts. CREV is the forecast’s percentage variation of analysts’ consensus. CRR is the cumulative return of the recommendation. CMAR is the cumulative return of the adjusted recommendation to the market. EXPGEN is the number of previous forecasts that the analyst issued. EXPSETOR the number of previous forecasts that the analyst has issued on a particular sector. EXPASSET is the number of previous forecasts that the analyst issued for a particular asset. NSETOR is the number of sectors that the analyst issued forecasts in the period. NASSET is the number of assets that the analyst issued forecasts in the period.
On the other hand, as according to Martinez (2007), the overall experience showed negative
efects with accuracy, refuting Mikhail, Walther and Willis (2003). It is possible that in Brazil, for the counting of these issued reports to be biased due to informational asymmetry from the diference between
forecast and recommendations. Somehow, a junior analyst with lower reputation, has no discretional power to bias their estimates, unlike a senior analyst who incurs in intentional bias. If the increase of issued reports are confrontational, as shown in Table 2, it can explain the reason for this contradictory relationship to learning through repetition.
In relation to the complexity of the analyst’s hedging portfolio, the results presented signiicant association for both of the variables NASSET and NSETOR. The variable NSETOR conirms the
evidence by Jacob, Lys and Neale (1999), Duru and Reeb (2002), Hirst, Hopkins and Wahlen (2004) and Lobo, Song and Stanford (2012) that the increase in the number of sectors is related to the increase in forecast errors and, consequently, associated with reduced accuracy.
In contrast, the NASSET variable indicated that the increase in the number of assets is linked to
improving accuracy and reducing errors, this efect is contradictory to the results by Jacob, Lys and Neale (1999). It is possible that, in Brazil, the analysis of assets within the same sector has a beneicial
association due to the lower amount of traded assets on the BM&FBovespa and in the portfolios of analysts.
Table 4. Experience and Complexity
Hypotheses 1 2 3
Dependent Variable PAFE PFE CMAR
EXPGEN 0.011*** -0.011*** 0.0001
(0.001) (0.001) (0.0001)
EXPSETOR -0.002*** 0.003*** 0.00002
(0.0003) (0.0002) (0.00004)
EXPASSET -0.002* 0.002* -0.0003
(0.001) (0.001) (0.0002)
NSETOR 0.038*** -0.044*** -0.001
(0.005) (0.005) (0.001)
NASSET -0.027*** 0.028*** -0.001
(0.003) (0.003) (0.001)
log(VOLM) 0.223*** -0.227*** -0.011**
(0.045) (0.045) (0.004)
CONFLICT -0.371*** 0.565*** -0.118***
(0.053) (0.050) (0.043)
IBOV -2.892*** 3.056*** -0.374***
(0.249) (0.258) (0.049)
REVGRADE 0.161** -0.144** 0.005
(0.063) (0.066) (0.011)
EXPGEN: CONFLICT 0.004*** -0.004*** 0.004***
(0.002) (0.001) (0.002)
EXPSETOR: CONFLICT 0.0004* -0.001*** -0.0004*
(0.0002) (0.0002) (0.0002)
EXPASSET: CONFLICT -0.004* 0.004** -0.005***
(0.002) (0.002) (0.001)
NSETOR: CONFLICT 0.007 -0.010 0.018***
(0.010) (0.011) (0.004)
NASSET: CONFLICT -0.005 0.003 0.004**
(0.005) (0.006) (0.002)
Observations 62,006 62,006 62,006
R2 0.030 0.032 0.011
Adjusted R2 0.029 0.032 0.011
Note: *p < 0.1; **p < 0.05; ***p < 0.01.
PAFE is the absolute percentage of forecast error. PFE is the percentage of forecast error. CMAR is the cumulative return of the adjusted recommendation to the market. EXPGEN is the number of prior forecasts periods that the analyst issued as a whole. EXPSETOR the number of previous forecasts that the analyst has issued on a particular sector. EXPASSET is the number of previous forecasts that the analyst issued for a particular asset. NSETOR is the number of sectors that the analyst issued forecasts in the period. NASSET is the number of previous forecasts that the analyst issued for a particular asset. log(VOLM) is the logarithm of the asset’s trading volume. CONFLICT is a dummy
representing the contradictory efect between the forecast and the recommendation of the analyst, with 1 when there is conlict, and 0 when there is none. REVGRADE is a diferentiation dummy of the revisions for less (downgrade) 1 and
investors. The variable was also signiicant from the interactions between the experience and accuracy metrics and demonstrates that analysts’ reports in Brazil need to be less conlictive and
have more technical rigor.
Regarding hypothesis 3, there were some signiicant efects pointing that experience is
associated with the recommendations returns, but only when these experiences are disassociated from forecasts. Although small, the EXPGEN showed that increasing the overall experience is positively related to the increase of abnormal returns and that the increase in EXPASSET is negatively associated with increasing returns. This observed relationship refutes the results by Mikhail, Walther and Willis (2003that experience is not related to returns. In other words, when
there is informational asymmetry, experience and complexity of the portfolio distort the efects of
the learn by doing assumptions.
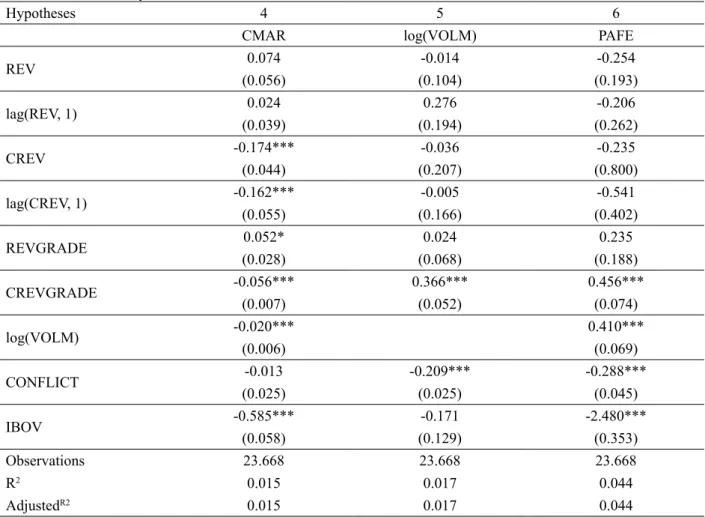
7.4. Learning analysis by informativity
The results of Table 5 show the correlations in the hypotheses of informativity. The irst model of the hypothesis 4, demonstrates a signiicant association of analysts’ abnormal returns in
relation to consensus revision, which was not observed with the individual revisions. The positive
relationship conirms the anchoring that individuals place on their peers, reinforcing evidence by Campbell and Sharpe (2009) and Williams (2013). Considering the increase in reports and conlicts
between forecast and recommendations, it is possible to assume that in some cases analysts are only replicating previous reports of their peers.
Despite evidence of increased eiciency in the Brazilian market Mobarek and Fiorante (2014), the association between consensus review and abnormal returns persists even for a lag, conirming
the argument by Givoly and Lakonishok (1979) and Brav and Lehavy (2003) of persistence of the
informational efect. The weak informativity in the market also conirms the research by Martinez
(2008) and Moshirian, Ng and Wu (2009). However, based on the informativity of the consensus revisions, it is possible to obtain abnormal earnings observing the movements of these revisions in the Brazilian market.
Regarding the model’s weakness of the hypothesis 5, the trading volume did not present a
good proxy to analyze the market’s informational efect. The result meets the variable defended
In considering hypothesis 6, the efect of informational consensus revisions intensiies the impact on returns when revisions are for less (downgrades) conirming the evidence by Asquith,
Mikhail and Au (2005). Hypothesis 6 shows that the analysts’ consensus revisions CREVGRADE are undermining target price forecasts and therefore, it explains the adverse relationship in preliminary abnormal returns.
The result of the association of the consensus conirms the hypothesis that analysts point
out anchoring moments on their peers and corroborates the argument by Williams (2013) that individuals are anchored on the similarities of their peers to issue their recommendations. However,
Table 5. Informativity
Hypotheses 4 5 6
CMAR log(VOLM) PAFE
REV 0.074 -0.014 -0.254
(0.056) (0.104) (0.193)
lag(REV, 1) 0.024 0.276 -0.206
(0.039) (0.194) (0.262)
CREV -0.174*** -0.036 -0.235
(0.044) (0.207) (0.800)
lag(CREV, 1) -0.162*** -0.005 -0.541
(0.055) (0.166) (0.402)
REVGRADE 0.052* 0.024 0.235
(0.028) (0.068) (0.188)
CREVGRADE -0.056*** 0.366*** 0.456***
(0.007) (0.052) (0.074)
log(VOLM) -0.020*** 0.410***
(0.006) (0.069)
CONFLICT -0.013 -0.209*** -0.288***
(0.025) (0.025) (0.045)
IBOV -0.585*** -0.171 -2.480***
(0.058) (0.129) (0.353)
Observations 23.668 23.668 23.668
R2 0.015 0.017 0.044
AdjustedR2 0.015 0.017 0.044
Note: *p < 0.1; **p < 0.05; ***p < 0.01.
CMAR is the cumulative return of the recommendation adjusted to the market. log(VOLM) is the logarithm of the asset’s trading volume. PAFE is the absolute percentage of forecast error. REV is the percentage of the expected price revision by the analyst. lag(REV,1) is the percentage of the expected price revision by the analyst lagged by one period. CREV is the percentage of the expected price revision by consensus. lag(CREV,1) is the percentage of the expected
price revision by consensus lagged by one period. REVGRADE is a diferentiation dummy of analysts’ individual revisions between the negative (downgrade) 1 and positive (upgrade) 0 variation. CREVGRADE is a diferentiation
the negative association with the returns and the positive association with the errors, show that this anchoring is damaging to the activity.
8. FINAL CONSIDERATIONS
In this study, we explored the association between learning, the complexity of the hedging portfolio and the informativity in target price forecasts and recommendations of sell-side analysts considering the informational asymmetry on the BM&FBovespa. The variables demonstrated that the Brazilian market presented optimism and excessive errors compared to other markets such as the North American.
Revisions by individual analysts presented associations with analysts’ consensus, which
conirmed the argument of anchoring on their peers by Campbell and Sharpe (2009) and Williams
(2013). The possible explanation for this association is that, the accuracy of consensus forecasts was greater than the individual accuracy. Whereas the average presents better results, analysts seek to observe their peers in order to conduct new analyses. As an example, the award of the returns of consensus recommendations were 6% per annum compared to 3% by analysts individually.
With regard to learning, the overall experience was 2.5 years, much lower than the 6.5 years of the North American market, as well as the experience with each asset being 1.2 years, much lower than 3 years, respectively. These results show less experienced professionals than in more developed markets, which explains the lower accuracy.
The average number of sectors in the portfolio of analysts was around 3 segments, with an average of 6 stocks in the portfolio, compared to the average of 14 stocks in a more recent survey in the North American market. This result shows how analysts in Brazil still cover less stocks in the
portfolio, possibly due to the lower amount of assets ofered in the market.
The increase in experience with sectors and assets, as well as the complexity of the portfolio,
conirmed the learn by doing principle in Brazil. But increasing experience in general presented a hindering efect on accuracy due to the observed informational asymmetry. The result of this
distortion are the positive recommendations returns, but defected target price forecasts.
One possible conclusion is that more experienced analysts in the market, with greater discretionary power, prefer to change their recommendations, contradicting their own target price forecasts in an attempt to intentionally bias the market. Thus, less experienced analysts cannot
cause such efect, but their lack of abilities and the low use of more sophisticated statistical models reduce its accuracy with assets and sectors, conirming the argument by Saito, Villalobos and
Benetti (2008).
(2009). Existing rankings in the Brazilian market should encourage the elimination of possible contradictions between forecasts and recommendations, enabling the increase in the quality of analysis results.
9. REFERENCES
ARELLANO, M. Computing robust standard errors for within-groups estimators. Oxford Bulletin of Economics and Statistics, v. 49, n. 4, p. 431-434, 1987.
ASQUITH, P.; MIKHAIL, M. B.; AU, A. S. Information content of equity analyst reports. Journal of Financial Economics, v. 75, n. 2, p. 245-282, fev. 2005.
BALTAGI, B. Econometric analysis of panel data. John Wiley & Sons, 2008.
BAMBER, L. S.; BARRON, O. E.; STEVENS, D. E. Trading volume around earnings
announcements and other inancial reports: Theory, research design, empirical evidence, and
directions for future research. Contemporary Accounting Research, v. 28, n. 2, p. 431-471, jun. 2011.
BARTH, M. E.; KASZNIK, R.; MCNICHOLS, M. F. Analyst coverage and intangible assets. Journal of accounting research, p. 1-34, 2001.
BEAVER, W. H. Perspectives on recent capital market research. The Accounting Review, v. 77, n. 2, p. 453-474, abr. 2002.
BONINI, S.; ZANETTI, L.; BIANCHINI, R.; SALVI, A. Target price accuracy in equity research. Journal of Business Finance & Accounting, v. 37, n. 9-10, p. 1177-1217, 2010.
BRADSHAW, M. T. The use of target prices to justify sell-side analysts’ stock recommendations. Accounting Horizons, v. 16, n. 1, p. 27-41, 2002.
BRADSHAW, M. T.; BROWN, L. D.; HUANG, K. Do sell-side analysts exhibit diferential target
price forecasting ability? Review of Accounting Studies, v. 18, n. 4, p. 930-955, 2013.
BRAV, A.; LEHAVY, R. An empirical analysis of analysts’ target prices: Short-term informativeness and long-term dynamics. The Journal of Finance, v. 58, n. 5, p. 1933-1968, 2003.
BREUSCH, T. S. Testing for autocorrelation in dynamic linear models. Australian Economic Papers, v. 17, n. 31, p. 334-355, 1978.
BREUSCH, T. S.; PAGAN, A. R. The lagrange multiplier test and its applications to model
speciication in econometrics. The Review of Economic Studies, p. 239-253, 1980.
BROWN, L. D. Analyst forecasting errors and their implications for security analysis: An alternative perspective. Financial Analysts Journal, p. 40-47, 1996.
BROWN, J. H.; CROCKER, D. K.; FOERSTER, S. R. Trading volume and stock investments. Financial analysts journal, p. 67-84, 2009.
CAMPBELL, S. D.; SHARPE, S. A. Anchoring bias in consensus forecasts and its efect on market
prices. Journal of Financial and Quantitative Analysis, v. 44, n. 2, p. 369, 2009.
CHUNG, K. H.; JO, H. The impact of security analysts’ monitoring and marketing functions
on the market value of irms. Journal of Financial and Quantitative Analysis, v. 31, n. 04, p. 493-512, 1996.
CLATWORTHY, M. A.; PEEL, D. A.; POPE, P. F. Evaluating the properties of analysts’ forecasts: A bootstrap approach. The British Accounting Review, v. 39, n. 1, p. 3-13, mar. 2007.
CLEMENT, M. B. Analyst forecast accuracy: Do ability, resources, and portfolio complexity matter? Journal of Accounting and Economics, v. 27, n. 3, p. 285-303, jul. 1999.
CLEMENT, M. B.; HALES, J.; XUE, Y. Understanding analysts’ use of stock returns and other analysts’ revisions when forecasting earnings. Journal of Accounting and Economics, v.51,n.3,p.279-299,abr.2011.
CONROY, R. M.; HARRIS, R. S. Analysts’ earnings forecasts in japan: Accuracy and sell-side optimism. Paciic-Basin Finance Journal, v. 3, n. 4, p. 393-408, dez. 1995.
DALMACIO, F. Z.; LOPES, A. B.; REZENDE, A. J.; NETO, A. S. An analysis of the relationship between corporate governance and accuracy of the analysts forecasts of the brazilian market. RAM Revista de Administração Mackenzie, v. 14, n. 5, p. 104-139, 2013.
DREMAN, D. N.; BERRY, M. A. Analyst forecasting errors and their implications for security analysis. Financial Analysts Journal, p. 30-41, 1995.
DURU, A.; REEB, D. M. International diversiication and analysts’ forecast accuracy and bias. The Accounting Review, v. 77, n. 2, p. 415-433, 2002.
EMERY, D. R.; Li, X. Are the wall street analyst rankings popularity contests? Journal of Financial and Quantitative Analysis, v. 44, n. 2, 2009.
FRANCIS, J.; SOFFER, L. The relative informativeness of analysts’ stock recommendations and earnings forecast revisions. Journal of Accounting Research, p. 193-211, 1997.
GIVOLY, D.; LAKONISHOK, J. The information content of inancial analysts’ forecasts of earnings: Some evidence on semi-strong ineiciency. Journal of Accounting and Economics, v. 1, n. 3, p. 165-185, dez. 1979.
GIVOLY, D.; LAKONISHOK, J. Properties of analysts’ forecasts of earnings: A review and analysis of the research. Journal of Accounting Literature, v. 3, n. 1, p. 117-52, 1984.
GLEASON, C. A.; LEE, C. M. Analyst forecast revisions and market price discovery. The Accounting Review, v. 78, n. 1, p. 193-225, 2003.
GODFREY, J. P. What is an analyst? Financial Analysts Journal, v. 9, n. 5, p. 103-105, 1953. GODFREY, L. G. Testing against general autoregressive and moving average error models when
the regressors include lagged dependent variables. Econometrica, v. 46, n. 6, p. 1293-1301, 1978.
HAUSMAN, J. A. Speciication tests in econometrics. Econometrica: Journal of the Econometric Society, p. 1251-1271, 1978.
HILARY, G.; HSU, C. Analyst forecast consistency. The Journal of Finance, v. 68, n. 1, p. 271-297, 2013.
JACKSON, A. R. Trade generation, reputation, and sell-side analysts. The Journal of Finance, v. 60, n. 2, p. 673-717, 2005.
JACOB, J.; LYS, T. Z.; NEALE, M. A. Expertise in forecasting performance of security analysts. Journal of Accounting and Economics, v. 28, n. 1, p. 51-82, nov. 1999.
KARAMANOU, I. Value relevance of analyst earnings forecasts in emerging markets. Advances in Accounting, v. 28, n. 1, p. 128-137, jun. 2012.
KERL, A. G. Target price accuracy. BuR - Business Research, v. 4, n. 1, p. 74-96, mar. 2011. LIM, T. Rationality and analysts’ forecast bias. The Journal of Finance, v. 56, n. 1, p. 369-385,
2001.
LOBO, G. J.; SONG, M.; STANFORD, M. Accruals quality and analyst coverage. Journal of Banking & Finance, v. 36, n. 2, p. 497-508, 2012.
MARTINEZ, A. L. Analysts’ optimism and selection bias. BBR-Brazilian Business Review, v. 4, n. 2, p. 104-118, 2007.
MARTINEZ, A. L. The efect of earnings projection revisions on stock returns in brazil. BBR-Brazilian Business Review, v.5, n.2, p.121-135, 2008.
MARTINEZ, A. L. Determinantes da acurácia das previsões dos analistas do mercado de capitais. Contabilidade, Gestão e Governança, v. 10, n. 2, 2009.
MARTINEZ, A. L.; DUMER, M. Adoption of IFRS and the properties of analysts’ forecasts: The brazilian case. Revista de Contabilidade e Organizações, v. 8, n. 20, abr. 2014.
MCNICHOLS, M.; O’BRIEN, P. C. Self-selection and analyst coverage. Journal of Accounting Research, p. 167-199, 1997.
MIKHAIL, M. B.; WALTHER, B. R.; WILLIS, R. H. Do security analysts improve their performance with experience? Journal of Accounting Research, v. 35, p. 131-157, 1997.
MIKHAIL, M. B.; WALTHER, B. R.; WILLIS, R. H. The efect of experience on security analyst
underreaction. Journal of Accounting and Economics, v. 35, n. 1, p. 101-116, 2003.
MOSHIRIAN, F.; NG, D.; WU, E. The value of stock analysts’ recommendations: Evidence from emerging markets. International Review of Financial Analysis, v. 18, n. 1-2, p. 74-83, mar. 2009. O’BRIEN, P. C. Individual forecasting ability. Managerial Finance, v. 13, n. 2, p. 3-9, 1987.
PETERSEN, M. A. Estimating standard errors in inance panel data sets: Comparing approaches.
Review of inancial studies, v. 22, n. 1, p. 435-480, 2009.
POMPIAN, M. Behavioral inance and wealth management: how to build optimal portfolios that
account for investor biases. John Wiley & Sons, 2011.
RAMNATH, S.; ROCK, S.; SHANE, P. The inancial analyst forecasting literature: A taxonomy
with suggestions for further research. International Journal of Forecasting, v. 24, n. 1, p. 34-75, 2008.
SCHIPPER, K. Analysts’ forecasts. Accounting Horizons, v. 5, n. 4, p. 105-121, 1991.
SO, E. C. A new approach to predicting analyst forecast errors: Do investors overweight analyst forecasts? Journal of Financial Economics, v. 108, n. 3, p. 615-640, jun. 2013.
WEINSTEIN, N. D. Unrealistic optimism about future life events. Journal of personality and social psychology, v. 39, n. 5, p. 806, 1980.
WILLIAMS, J. Financial analysts and the false consensus efect. Journal of Accounting Research, v. 51, n. 4, p. 855-907, 2013.
WOOLDRIDGE, J. M. Econometric analysis of cross section and panel data. MIT press, 2010. YU, F. F. Analyst coverage and earnings management. Journal of Financial Economics, v. 88, n.
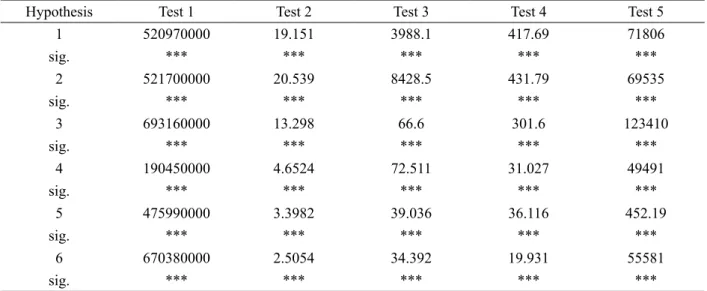
APPENDIX A. Statistical Tests of Models in Panel.
Table A1. Statistical Tests of Panel in Models.
Hypothesis Test 1 Test 2 Test 3 Test 4 Test 5
1 520970000 19.151 3988.1 417.69 71806
sig. *** *** *** *** ***
2 521700000 20.539 8428.5 431.79 69535
sig. *** *** *** *** ***
3 693160000 13.298 66.6 301.6 123410
sig. *** *** *** *** ***
4 190450000 4.6524 72.511 31.027 49491
sig. *** *** *** *** ***
5 475990000 3.3982 39.036 36.116 452.19
sig. *** *** *** *** ***
6 670380000 2.5054 34.392 19.931 55581
sig. *** *** *** *** ***
Note: *p < 0.1; **p < 0.05; ***p < 0.01.
The tests applied in the models of consensus analysis were (1): Lagrange’s Multiplier Test-time efects (Breusch-Pagan), (2) F test for individual efects, (3) Hausman’s test, (4) Breusch-Godfrey’s test for serial correlation in panel