MARCELO RESENDE¸
RESUMO
O artigo investiga a persistência dos lucros para firmas industriais no Brasil durante os períodos 1986-98 e 1994-1/1999-3. Uma formulação teórica simples justifica uma formulação auto-regressiva para lucros anormais. Uma forma forte de persistência pode então ser relacionada com a presença de uma raiz unitária. Testes de raiz unitária para painel permitem a consideração de períodos de tempo curtos. Os resultados assim obtidos para duas medidas diferentes de lucros anormais em geral favorecem a presença de uma raiz unitária. Portanto, apesar de um ambiente aparentemente mais competitivo na economia brasileira, pode-se observar lucros extremamente persistentes.
PALAVRAS-CHAVE
persistência dos lucros, testes de raiz unitária para painel
ABSTRACT
The paper investigates the persistence of profits for industrial firms in Brazil during the periods 1986-98 and 1994-1/1999-3. A simple theoretical framework justifies an autoregressive formulation for excess profits. A strong form of persistence can then be related to the presence of a unit root. Recently devel-oped panel data unit tests enable the consideration of short time periods. The results thus obtained for two different measures of excess profitability mostly favour the presence of a unit root. Therefore, de-spite an apparently more competitive environment in the Brazilian economy one can still observe ex-tremely persistent profits.
KEY WORDS
profit persistence, panel data unit root tests
JEL CLASSIFICATION L100, C230
Ø The author acknowledges research assistance from Marcos Lima, Cristina Hagler and Valquíria Silva. Moreover, financial support from FUJB and CNPq is gratefully acknowledged.
¸
Instituto de Economia, Universidade Federal do Rio de RJ, Av. Pasteur 250, Urca, 22290-240, Rio de Janeiro-RJ, Brazil Email: [email protected]
INTRODUCTION
Traditional microeconomic theory usually sustains the notion that the so-called abnor-mal profits could be diluted in the long run as a result of competitive pressures accru-ing from the entry of new firms. The empirical assessment of such mechanism has given rise to a broad empirical literature on profit persistence for developed countries (the works collected in Mueller (1990) are representative). Such efforts constitute at-tempts in dynamically characterizing the competitive process, and reveal a dissatisfacti-on with the static character of structure-cdissatisfacti-onduct-performance models (see e.g. Brozen, 1971a,b). The referred empirical literature has addressed the profit persistence issue by means of econometric models with autoregressive dynamics justified upon a simple theoretical framework (see Geroski, 1990). This class of models has not, however, been fully explored in terms of its diverse implications. In fact, one observes, in con-trast with the macroeconomic literature, a slow dissemination of the use of time series techniques in the context of Industrial Organization-IO that reflects to some extent the difficulties in obtaining long time series for microeconomic data (see Byers and Peel, 1994). In this sense, the large growth of the macroeconomic literature on unit roots triggered by Nelson and Plosser (1982) did not have comparable impacts in the con-text of the IO literature despite the fact that persistence is also an important issue in the latter literature.
1. PROFIT PERSISTENCE AND ECONOMETRIC ANALYSIS
1.1 Conceptual Digression
It is possible to construct simple theoretical frameworks that provide foundations for the empirical analysis of profit persistence. An influential example is given by Geroski (1990) who motivates a simple autoregressive empirical model with a simplified theo-retical model. The basic steps can be summarised as follows. Let ρ(t) ≡ π(t) – π p(t) denote firm’s excess profits at period t , where π(t) and π p(t) represent firm’s profita-bility at period t and the long-run competitive rate-of-return respectively. One can con-sider two general classes of factors determining changes in ρ(t). First, there are systematic factors (say “entry” E(t)) and a set of other factors orthogonal to the first class that can be generically referred as “luck” μ(t) that would be assumed as an i.i.d. normally distributed process with zero mean and variance δμ2. Next the author
concei-ves a simple expression relating changes in excess profitability to the two classes of ex-planatory factors:
(1)
where ∆ρ (t) ≡ρ(t) - ρ(t-1)
A difficulty associated with the previous expression refers to the existence of non-ob-servable components in E(t), including , for example, potential entry. The latent varia-ble character of this formulation requires then a link that expresses E(t) in terms of observable factors, a possibility is given as follows:
(2)
where ρ* denotes the equilibrium value of ρ(t) which does not induce further entry movements and φ > 0 stands for a speed parameter indicating the attractiveness of en-try. Even when ρ(t – 1) = ρ* , one can observe an exogenous flow of entry or exit given by ε(t) which it is assumed to be a normally distributed process with zero mean and va-riance σε2. By combining expressions (1) and (2) one can obtain expression (3) which
only involves observable variables
(3)
where α ≡ (θ0 - γ0φρ*), λ ≡ (γ0φ + γ1 + 1) and v(t)~N(0, δv2 = γ02 δε2 + δμ2).
)
(
)
1
(
)
(
)
(
t
θ
0γ
0E
t
γ
1ρ
t
μ
t
ρ
=
+
+
−
+
∆
)
(
]
)
1
(
[
)
(
t
t
*t
E
=
φ
ρ
−
−
ρ
+
ε
) ( ) 1 ( )
(t =
α
+λ
ρ
t− +v tIt is possible then to motivate a simple autoregressive formulation upon the aforemen-tioned approach, where λ would indicate the degree of persistence. A formal testing of the extreme persistence involved in the case of λ = 1 would not had been possible be-fore the advent of panel data unit root tests which allow for short time periods. It is worth mentioning that a similar panel autoregressive analogue to expression (3) could be readily obtained (with double subscripts). In fact, if one conceives firm specific de-pendencies in expressions (1) and (2) that would be indeed the case. Sector-specific idiosyncrasies are common in the entry literature (see e.g. Geroski, 1991, 1995 and Façanha and Resende, 2004) and firm-level specificities are not implausible in that context.
1.2 Panel Data Unit Roots
It is well known that traditional unit root tests possess low power against near unit root alternatives (see e.g. Diebold and Nerlove, 1990). The development of panel data unit root tests addresses this aspect and additionally allows to consider data sets with a short time dimension. Early treatments appear in Quah (1994). The most dissemina-ted results were developed by Levin and Lin (1993, 1994) and Im, Pesaran and Shin (2003) and surveys on the topic appear in Banerjee (1999) and Maddala and Wu (1999). The range of applications is still restrict. Examples of applications include Ber-nard and Jones (1996) in the context of productivity convergence, Culver and Papell (1997) on inflation, Fleissig and Strauss (2000) on purchasing power parity, Resende (2004) in terms of the test of Gibrat’s law and Resende and Lima (2005) for the asses-sment of market share instability.
Levin and Lin-LL consider unit root testing for different models with different degrees of heterogeneity across time and units. The main result obtained referred to simple Gaussian limiting distributions in contrast with functionals of Brownian motion obtai-ned in the traditional literature. One representative specification (model 5 of LL (1992)) for a generic variable y is given by:
with the null hypothesis H0: αi = βi = 0 ∀i. The alternative hypothesis is given by
H1 = βi = β < 0 ∀i. The referred test can be carried out by means of the t statistic obtai-ned upon a within-group estimator for panel. It can be shown that under the null of a
unit root . In the event of serially correlated errors, one
can consider augmented regressions and examine the ADF statistic which will possess the same limiting distribution. Further extensions pertaining serial correlation and he-teroskedasticity appear in Levin and Lin (1993). The various tests developed by Levin
T t
N i
y
yi,t = i + i,t 1 + i,t =1,..., =1,...,
∆
α
β
−ε
) 1 , 0 ( 875
. 1 25
.
and Lin possess some important limitations. The main limitation refers to a common parameter β across different units. This assumption will be too restrictive in the con-text of the alternative hypothesis. Im, Pesaran and Shin-IPS (2003), provide a panel data unit root test that relaxes such assumption. Considering the model given in ex-pression but with parameter β varying across units as given below:
IPS propose test where H0: βi = 0 ∀i and H1: ∃ i such that βi < 0. One therefore rela-xes the strong homogeneity assumption embodied in the LL tests. The simplest test proposed by IPS, the so called t-bar statistic is defined as the average of the individual Dickey-Fuller (DF) or augmented Dickey-Fuller (ADF), say τIstatistics:
where( ( - E(τ i⏐βI = 0)/(Var(τi⏐βI = 0)1/2 ) ~ N(0,1)
The means E(τi|βI = 0) and variances Var(τi|βI = 0) were obtained by IPS by means of Monte Carlo simulations for the same degree of augmenting in the different time seri-es (2 in the prseri-esent application). In the prseri-esent case we will consider the t-bar tseri-est for different excess profitability measures. The t-bar test for a model with a deterministic trend will also be considered to assess persistence though this formulation is not direc-tly implied from the previous presentation.
2. EMPIRICAL ANALYSIS
2.1 Data Sources
The main data source is the data bank on the 1000 largest firms in Brazil which is ge-nerated in an annual basis and comprises balance sheets and results accounts. This data bank is organized by the Centre of Entrepreneurial Studies and Finance – Getulio Var-gas Foundation-Brazil. It was possible to obtain annual data for the period 1986-98, for which was considered the largest possible (balanced) panel of industrial firms whi-ch included 330 firms in eawhi-ch period. Two profit rates definitions were considered: profit before taxes divided by total assets (GPTA) and profit after taxes divided by total
T t
N i
y
yi,t = i + i i,t 1 + i,t =1,..., =1,...,
∆
α
β
−ε
^
^
^ 1
1
, where
i
N
i
i i
i t
N =
β
β
= τ τ =
σ
∑
N _
assets (NPTA). In order to empirically implement the analysis outlined in the previous section, one generates sample means of the profit rates under the different definitions. For the sake of empirical implementation the profitability deviations are constructed
upon the period sample mean given generically by for all t. Similar
profita-bility deviations were constructed, for example, by Jenny and Weber (1990), Odagiri and Yamawaki (1990) and Schwalbach and Mahmood (1990) among others.
It is considered also a second data source provided by the data bank Economática. This source includes only quoted firms but have the advantage of possessing quarterly data and therefore allows a better characterisation of the post-liberalisation period. Specifi-cally it is possible to generate a balanced panel of 147 firms over the period 1994-1/ 1999-3.
2.2 Empirical Results
Table 1 shows the trade liberalisation process in Brazil which started in 1990 in terms of a declining trend in the nominal tariffs. This change coupled with the price stabilisa-tion following the Real plan in 1994 would in part signal a more competitive environ-ment.
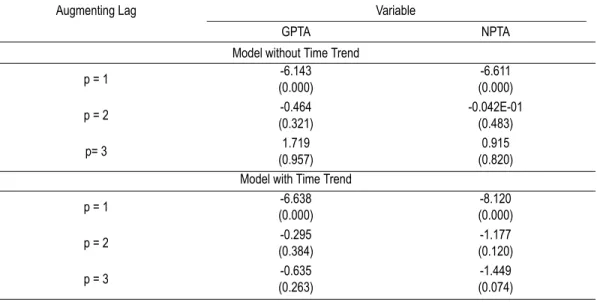
The results obtained in the panel data unit root testing for two measures of profitabili-ty (for annual data) are presented next in Table 2.1
When one considers the t-bar statistic, the results favour in most cases the existence of a unit root for the two excess profitability measures and this is the case whether one in-cludes or not a time trend component. Only for the augmenting lag of 1, the evidence favours the rejection of the null hypothesis of a unit root.
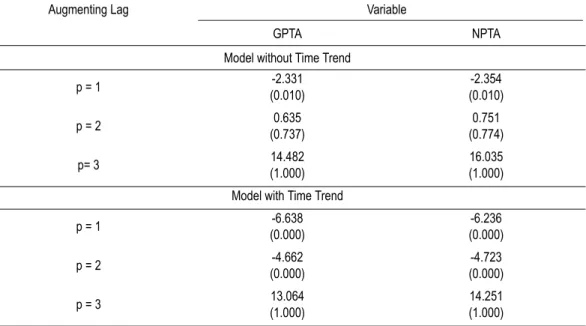
This first analysis, based on annual data, does not allow a proper separation of the post-liberalisation period. In this sense, we consider the results for the t-bar test in the context of quarterly data as presented in Table 3. Even though the coverage of that se-cond data source is more restrict, it can provide a robustness check for our analysis.2
1 The econometric estimations were carried with TSP 4.4, making use in particular of the panel data unit root code developed by Clint Cummins (panunit.tsp).
2 The annual and quarterly data analyses respectively possess T = 13 and T =23. We considered the closest tabulated values (in Table 2 of IPS) referring to T = 15 and T = 25. Despite this conservative approach that would slightly favour the rejection of null hypothesis of unit root, the results towards the non-rejec-tion are strong.
∑
=
≡ N i
i N
1
_ π
TABLE 1 – NOMINAL TARIFFS (%) FOR SELECTED INDUSTRY SECTORS IN BRAZIL
Note: sample means were computed over all sectors not only for the selected that are reported in the table. Source: Kume (1996).
TABLE 2 – PANEL DATA UNIT ROOT TESTS RESULTS (ANNUAL DATA-1986/98)
Note: p-values appear in parenthesis.
Sector Sep/89 Dec/90 Feb/91 Jan/92 Oct/92 Jul/93
Steel 15.2 14.3 10.1 8.1 6.5 5.5
Other metal work 34.0 34.8 27.6 23.4 19.9 16.3
Machines and tractors 38.7 37.1 28.4 24.5 20.2 19.1
Electrical material 41.2 44.1 35.2 29.8 23.5 18.8
Electronic equipment 39.4 40.6 35.2 28.8 24.3 20.7
Vehicles, trucks and buses 65.0 78.7 58.7 48.8 39.0 34.0 Other vehicles and parts 38.0 37.4 29.9 25.4 20.8 17.9
Wood and furnishing 25.8 25.4 16.4 11.1 9.8 9.5
Cellulose, paper and printing 24.3 23.6 13.4 10.9 9.5 9.3
Rubber industry 47.6 46.6 34.8 28.5 20.6 14.9
Various chemical products 25.5 21.1 16.2 13.7 11.3 10.9 Pharmaceutical and perfumery industry 34.4 31.5 20.8 16.9 13.8 12.8
Plastic articles 39.5 39.0 31.2 26.0 19.2 16.8
Textile industry 52.5 31.3 30.4 24.5 20.3 14.4
Clothing 75.0 51.1 48.3 38.8 29.3 20.0
Leather and footwear 35.8 29.6 24.8 20.5 16.0 14.2
Coffee industry 28.9 28.9 20.0 15.6 14.4 12.2
Drinks and other food products 43.5 43.5 36.9 30.4 20.5 16.3
Sample mean 31.6 30.0 23.3 19.2 15.4 13.2
Augmenting Lag Variable
GPTA NPTA
Model without Time Trend
p = 1 -6.143
(0.000)
-6.611 (0.000)
p = 2 -0.464
(0.321)
-0.042E-01 (0.483)
p= 3 1.719
(0.957)
0.915 (0.820) Model with Time Trend
p = 1 -6.638
(0.000)
-8.120 (0.000)
p = 2 -0.295
(0.384)
-1.177 (0.120)
p = 3 -0.635
(0.263)
TABLE 3 – PANEL DATA UNIT ROOT TESTS RESULTS (QUARTERLY DATA-1994-1/1999-3)
Note: p-values appear in parenthesis.
Once more, in a substantial part of the results, there is support for the existence of a unit root in a significant proportion of the cases in the case of the model with time trend. The evidence is, however, less compelling in the model with time trend. In any case, as mentioned before, the time trend formulation is not strictly consistent with the theoretical foundation that was presented before and thus the model without time trend will represent the most natural specification. The overall evidence appears to fa-vour the existence of a unit root and therefore an extreme form of persistence in profi-tability despite an apparently more competitive environment in Brazil.
It is worth mentioning that the quarterly data source confirms the strong persistence result that in fact had already been obtained by Resende (2000) for annual data. A work more closely related with the present paper is provided by Glen et al. (2001) that considered panel data unit root tests for 7 emerging countries (including Brazil), thou-gh no theoretical justification is provided for an autoregressive specification for the ex-cess profits equation as in the present paper. Moreover, the samples utilised were somewhat limited as considered a small number of very large firms. In the case of Bra-zil, the authors considered a panel in an annual basis with only 56 firms along the peri-od 1985-1995.3
Augmenting Lag Variable
GPTA NPTA
Model without Time Trend
p = 1 -2.331
(0.010)
-2.354 (0.010)
p = 2 0.635
(0.737)
0.751 (0.774)
p= 3 14.482
(1.000)
16.035 (1.000)
Model with Time Trend
p = 1 -6.638
(0.000)
-6.236 (0.000)
p = 2 -4.662
(0.000)
-4.723 (0.000)
p = 3 13.064
(1.000)
14.251 (1.000)
The results obtained in the present paper favour the notion that market power is likely to be pervasive in different sectors of the Brazilian manufacturing industry. Comple-mentary evidence in that direction was provided by Resende and Lima (2005) that de-tected low level of rivalry as implied by stability of market shares. Lima and Resende (2004), on the other hand, found a low degree of turnover on firm leadership. Taken together these results for Brazil complement the evidence on strong profit persistence found in this paper.
Finally, it is important to consider to what extent structural changes in the Brazilian economy are being considered in a proper manner in the previous analysis. In fact, in the context of univariate time-series there exists tests that consider structural breaks whereas in the panel unit root literature no analogous tests exist. An initial assurance with that respect is that the panel structure allows the consideration of shorter time in-tervals and therefore reduces the likelihood of occurrence of structural breaks that would be more likely in the context of longer univariate series as in the case of applied macroeconomics. Moreover, structural changes that would be likely to aid in dissipa-ting profit persistence are not clear cut for at least for two reasons. First, we attempted to isolate the post-liberalization period by means of the quarterly data analysis. Howe-ver, it is important to stress that tariff reduction is an element of the analysis but that the evolution of relative prices following changes in exchange rate is crucial. In fact, the competitive pressures from imported good diluted over time in some cases as is emblematic from the drastic reduction of imports of food products as observed in su-permarkets.
On the other hand, a second structural change that could in principle enhance the competitive environment, would be the more intense operation of antritrust agencies in Brazil. One needs, however, to exercise caution with that respect. Indeed, it appears that antitrust policy has been lenient. In the case of concentration acts that assess anti-competitive effects of mergers and acquisitions only one case was recently denied whe-reas in what concerns cartel practices, in less than ten cases firms were condemned (most notably three cases in gasoline retailing and two cases in steel production). It se-ems therefore that the competitive environment might not after all been subject to im-portant structural changes and that aforementioned persistence patterns are not entirely surprising.
FINAL COMMENTS
data unit root tests can provide formal testing of persistence in the context of short pa-nels. Despite the fact that a large proportion of the studied years could, in principle, be labelled as “competitive”, the evidence indicated that an extreme level of persistence as-sociated with the presence of a unit root in excess profitability cannot be discarded. This result emphasizes the importance of consolidating competition policies in Brazil which are still not mature and independent of those may indicate an already high pre-valence of market power in different industrial sectors. The paper also provides moti-vation for further dynamic econometric analysis in the context of IO. Dynamic panel data techniques can be especially useful in the typical situation where the panel is rela-tively short.
REFERENCES
Banerjee, A. Panel data unit roots and cointegration: an overview. Oxford Bulletin of
Economics and Statistics, Special Issue, p. 607-29, 1999.
Bernard, A.; Jones, C. Productivity growth across industries and countries. Review of
Economics and Statistics, 78, p. 135-146, 1996.
Brozen, Y. The antitrust task force deconcentration recommendation. Journal of Law
and Economics, 14, p. 279-92, 1971a.
_______. Bain’s concentration and rates of return revisited. Journal of Law and
Eco-nomics, 14, p. 351-69, 1971b.
Byers, J. D.; Peel, D. A. Linear and non-linear models of economic time-series: an
introduction with applications to industrial economics. In: Cable, J. (ed.),
Current issues in industrial economics. London: MacMillan, 1994.
Cubbin, J.; Geroski, P. A. The convergence of profits in the long-run: inter-firm and
inter-industry comparisons. Journal of Industrial Economics, 35, p. 427-42,
1987.
_______. The persistence of profits in the United Kingdom. In: Mueller, D. C.
(ed.), The dynamics of company profits. Cambridge: Cambridge University
Press, 1990, p. 147-167.
Culver, S. E.; Papell, D. H. Is there a unit root in the inflation rate? Evidence from
sequential break and panel data models. Journal of Applied Econometrics, 12, p.
435-444, 1997.
Diebold, F.X.; Nerlove, M. Unit roots in economic time series: a selected survey. In:
Fomby, T.; Rhodes, E. (eds.), Advances in econometrics: cointegration,
spuri-ous regressions and unit roots.Greenwich: JAI Press, 1990.
Dosi, G.; Malerba, F.; Marsili, O.; Orsenigo, L. Industrial structures and dynamics:
evidence, interpretations and puzzles. Industrial and Corporate Change, 6, p.
Façanha, L. O; Resende, M. Dinâmica multissetorial da indústria brasileira: um
es-tudo empírico. Estudos Econômicos, v. 34, n. 4, p. 693-723, out./dez. 2004.
Fleissig, A. R.; Strauss, J. Panel unit root tests of purchasing power parity for price
indexes. Journal of International Money and Finance, 19, p. 489-506, 2000.
Geroski, P. A. Modeling persistent profitability. In: Mueller, D. C. (ed.), The
dynam-ics of company profits. Cambridge: Cambridge University Press, 1990, p. 15-34.
_______. Market dynamics and entry. Oxford: Blackwell, 1991.
_______. What do we know about entry. International Journal of Industrial
Organi-zation, 13, p. 421-440, 1995.
Glen, J.; Lee, K.; Singh, A. Persistence of profitability and competittion in
emerg-ing markets. Economics Letters, 72, p. 257-253, 2001.
Goddard, J. A.; Wilson, J. O. S. The persistence of profit: a new empirical
interpre-tation. International Journal of Industrial Organization, 17, p. 663-687, 1999.
Im, K. S.; Pesaran, M. H.; Shin, Y. Testing for unit roots in heterogeneous panels.
Journal of Econometrics, 115, p. 53-74, 2003.
Jenny, F. Y.; Weber, A. P. The persistence of profits in France. In: Mueller, D. C.
(ed.), The dynamics of company profits. Cambridge: Cambridge University
Press, 1990, p. 123-128.
Jensen, J. B.; McGurkin, R. H. Firm performance and evolution: empirical
regulari-ties in the US microdata. Industrial and Corporate Change, 6, p. 25-47, 1997.
Karlsson, S.; Löthgren. On the power and interpretation of panel data unit root
tests. Economics Letters, 66, p. 249-55, 2000.
Kume, H. A política de importação no Plano Real e a estrutura de proteção efetiva.
Texto para Discussão n. 423, IPEA, 1996.
Levin, A.; Lin, C. Unit root tests in panel data: asymptotic and finite-sample
pro-perties. University of California, San Diego Working Paper, 1992, p. 92-23.
_______. Unit root tests in panel data: new results. University of California, San
Di-ego Working Paper, 1993, p. 93-56.
Lima, M, A.; Resende, M. Firm leadership stability in the Brazilian industry: an
em-pirical note. Economia Aplicada, v. 8, n. 4, p. 606-618, out./dez. 2004.
Maddala, G. S.; Wu, S. A comparative study of unit root tests with panel data and a
new simple test. Oxford Bulletin of Economics and Statistics, Special Issue, p.
631-52, 1999.
Maruyama, N.; Odagiri, H. Does the ´persistence of profits´ persist?: a study of
company profits in Japan, 1964-97. International Journal of Industrial
Odagiri, H.; Yamawaki, H. The persistence of profits in Japan. In: Mueller, D. C.
(ed.), The dynamics of company profits. Cambridge: Cambridge University
Press, 1990, p. 129-146.
Pesaran, M. H.; Smith, R.; Im, K. S. Dynamic linear models for heterogeneous
panels. In: Matyas, L.; Sevestre, P. (eds.), Econometrics of panel data:
hand-book of theory and applications. Boston: Kluwer Academic Publishers, 1995.
Quah, D. Exploiting cross-section variates for unit root inference in dynamic data.
Economics Letters, 44, p. 9-19, 1994.
Resende, M. Profits persistence in Brazil: a panel data study. Textos para Discussão n.
446, IE-UFRJ, 2000.
_______. Gibrat´s law and growth of cities in Brazil: a panel data investigation.
Ur-ban Studies, 41, p. 1537-1549, 2004.
Resende, M.; Lima, M. A. Market share instability in the Brazilian industry: a
dy-namic panel data analysis. Applied Economics, 37, p. 713-718, 2005.
Schohl, F. Persistence of profits in the long run. International Journal of Industrial
Organization, 8, p. 385-404, 1990.
Schwalbach, J.; Mahmood, T. The persistence of corporate profits in the Federal
Republic of Germany. In: Mueller, D. C. (ed.), The dynamics of company