DOI: 10.1590/1808-057x201702690
Using the Newcomb-Benford Law as a Deviation Identiication
Method in Continuous Auditing Environments: A Proposal for
Detecting Deviations over Time*
Wilton Bernardino da Silva
Universidade Federal de Pernambuco, Centro de Ciências Sociais Aplicadas, Departamento de Ciências Contábeis e Atuariais, Recife, PE, Brazil
Silvana Karina de Melo Travassos
Faculdade de Ciências Sociais Aplicadas, Departamento de Administração, Campina Grande, PB, Brazil
Jose Isidio de Freitas Costa
Tribunal de Contas do Estado de Pernambuco, Assessoria de Pesquisa e Inteligência, Recife, PE, Brazil
Received on 10.21.2015 – Desk acceptance on 11.08.2015 – 3rd version approved on 08.31.2016
ABSTRACT
his paper used the Newcomb-Benford Law (NB Law) to analyze 210,899 contracts issued by sixty management units in two states in the Brazilian Northeast in 2010. In this article we seek to address the following question: What proposal emerges from the need to identify inancial deviations over time in terms of NB Law compliance in continuous auditing scenarios? To this end, the goal of the paper is to analyze this compliance with the aim of identifying deviations over time. he analysis focuses on irst signiicant digit distribution. Graphical analysis of observed frequencies and time series of relative discrepancies reveals the formation of typical patterns of divergences from Public Tenders Law (Federal Law n. 8.666/93). From the results obtained, we conclude that time series analysis of NB Law compliance can improve the accuracy of sampling procedures in continuous auditing.
Keywords: Newcomb-Benford Law, irst digit, time series analysis, continuous auditing, public spending.
1 INTRODUCTION
h e essence of the Newcomb-Benford Law (NB Law) was discovered by Simon Newcomb in 1881, when he noticed the fact that books containing logarithmic tables, in various libraries, presented evidence of greater wear in their i rst pages. Since the initial pages of these books contained the values of logarithms of numbers that began with lower digits (digits 1, 2, and 3, for example), Newcomb concluded that people looked for values of logarithms that began with lower digits much more than those that began with higher digits (digits 7, 8, and 9, for example). Newcomb (1881), in his article titled Note on the Frequency of Use of the Diff erent Digits in Natural Numbers, concluded that “the law of the probability of the occurrence of numbers is such that all the mantissas of their logarithms are equally probable”. Also along this line of work, Benford (1938) laid out the same conclusions as Newcomb, presenting more than 20,000 results of adjustments using the Law, in various databases from diff erent branches of research.
In the context of studies regarding i nancial deviations, the NB Law pattern has been used as an auditing procedure, applied to analyzing the conformity of a set of i nancial data by detecting deviations in relation to the expected pattern of occurrence for the digits of an analyzed position. In this regard, previously studies conducted by Carslaw (1988), Nigrini (1996), Nigrini and Mittermaier (1997), Watrin, Struff ert, and Ullmann (2008), among others, stand out.
Auditing procedures can be understood as techniques applied by an auditor in order to evaluate the legitimacy of the processes and rules of an entity from the public or private sector. According to Mills (1994), auditing consists of carrying out an evaluation, offi cially recognized and systematized by those interested, in order to ensure that an applicable system, program, product, service, or process, present all of the characteristics, criteria, and parameters required. According to Attie (1998, p.25), auditing can be seen as an accounting specialty focused on testing the effi ciency and eff ectiveness of implanted asset controls, with the aim of expressing an opinion regarding a particular set of information given over for analysis.
Auditing procedures, in general, are supported in various topics of statistical inference, among which punctual and interval estimations for proportions and
Z-test and the χ2-test present a problem when signii cantly large samples are used, dei ned as the “excess power” problem (Nigrini & Mittermaier, 1997; Nigrini, 2000; Krakar & Žgela, 2009). h is sensitivity of the tests to large sample sizes can be understood when small deviations from NB Law patterns are marked as being statistically signii cant, even when they are considered irrelevant in terms of auditing analysis. Suh, Headrick, and Minaburo (2011) used Monte Carlo simulations and identii ed the problem in large samples. Additionally, these authors propose a regression procedure based on inferences via bootstrapping, with the aim of identifying unusual patterns in i nancial data, using the i rst two signii cant digits.
h is paper aims to analyze Newcomb-Bedford Law compliance in continuous auditing scenarios, as a proposal for identifying deviations over time. For this, analyses were carried out regarding the NB Law pattern in i rst signii cant digit distribution in 210,899 contracts issued by 60 management units in two states in the Brazilian Northeast in 2010. In a i rst analysis, nine graphs were constructed with the frequency results observed and their respective coni dence interval to apply the Z statistic to the digits 1 to 9, showing visually the eff ect of sample size when using the Z-test. In the following analysis, a proposal was presented for analyzing the NB Law digit pattern of over time, using time series of relative discrepancies.
h e question that guides this paper is the following:
What proposal emerges from the need to identify deviations over time, in relation to analyzing Newcomb-Bedford Law compliance, in continuous auditing scenarios? With this aim, the use of a measure of relative percentage variation is proposed, which is indicated by relative discrepancy. Such a measure becomes an alternative to the Z and chi-squared tests, which assume independence, which cannot be guaranteed in time series data.
related to the topic of study and some statistical inference techniques widely used in frequency of digits analyses based on the NB Law; section 3 discusses the methodology
used in this study; then, in section 4, the results are presented from the empirical analyses carried out, and i nally, section 5 contains the paper’s i nal remarks.
2 THEORETICAL FRAMEWORK
2.1 Continuous Auditing
h ere are various dei nitions for auditing. In a wider context, it can be understood as an evaluation that is offi cially recognized and systematized by those interested, with the aim of ensuring that the system, program, service, or process audited has all of the characteristics, criteria, and parameters required (Costa, 2012).
For Arens, Elder, and Beasley (2004), continuous auditing (CA) would work as a system of computerized accounting, in which auditors can execute tests over the year, in order to identify signii cant or uncommon transactions, as well as determining whether any alteration has been carried out in this computerized system of control.
Continuous auditing is characterized as producing simultaneous results, or in short time periods, at er the occurrence of the relevant event being controlled, making it possible for the auditor to detect the occurrence of an event that is outside the norms or outside the controls. h erefore, continuous auditing processes depend on the existence of computerized systems of control and data stored in electronic format (Vasarhelyi & Halper, 1991).
h e execution of this simultaneous control, to be carried out in a continuous auditing process, involves timeliness as its best feature when compared to the traditional a posteriori auditing model (Costa, Santos, & Travassos, 2012). For Lima and Vieira (2002), simultaneous control is carried out in parallel with the controlled events, it thus being considered the most eff ective, given the possibility of stopping the eff ects of any irregular activity that might be detected. Murcia, Souza, and Borba (2008) highlight, however, that the cost of its implantation would only be economically viable via the use of automated execution.
h e implementation of automated auditing routines has become a reality, especially in the area of risk analysis for granting credit, carried out by credit card companies. To this end, Costa et al. (2012) emphasize the relevance of carrying out automatic tests to verify the fuli llment of bidding limits in public spending contracts, to verify the i scal good standing of goods and service suppliers, and to monitor deviations in spending behavior in relation to forecasted values.
h is study seeks to contribute to the literature by highlighting the importance of using these techniques in public sector audits via an application in which accounting metrics methods were used focused on analyzing NB Law compliance in a continuous auditing environment, with the additional aim of identifying deviations over time, based on the interdisciplinary methodology used by Nigrini (1996), Carslaw (1988), Krakar and Žgela (2009), and Žgela (2011).
2.2 The Newcomb-Benford Law
Pioneering studies regarding the NB Law were developed by Newcomb (1881) and Benford (1938), in which the authors showed that the probabilities of occurrence of numbers beginning with lower digits are higher than the probabilities of occurrence of numbers beginning with higher digits. In the context of the h eory of Probabilities, authors such as Hill (1995,1996), Pinkham (1961), and Raimi (1969) showed that the NB Law applies in data of a numerical nature that present invariance with regards to scale and that arise in a random nature. h us, data on i nancial l ows have received considerable attention in the literature as apt for applications using the NB Law.
An initial study regarding the Newcomb-Benford Law in a context applied to social sciences was carried out by Varian (1972). In this paper, the author observes aspects of the law in public planning i nancial data and concludes favorably regarding the use of the NB Law in helping to detect i nancial irregularities.
In the study from Nigrini (1999), the author shows evidence of the NB Law pattern in the exponential growth of a variable over time. h e author considers a mutual fund growing at a rate of 10% a year. Supposing that the fund’s resources start at an initial level of 100 million, the i rst signii cant digit of the total value of resources is 1 and will only change when the total value of the fund’s resources reaches the amount of 200 million. h is change in the i rst signii cant position (from 1 to 2) will only occur if there is a 100 million increase in the fund’s resources. Given that the growth rate is 10% a year, 10 years are needed for this to happen. If the change in the i rst digit was from 5 to 6 (changing the resources from 500 million to 600 million), given the same growth rate, this timeframe would be only 2 years. For a change from
900 million to 1 billion, at the same rate of growth, the time needed would be 1 year and 1 month. h is behavior is characteristic of the NB Law pattern.
In a study involving taxpayers in the United States, Nigrini (1996) showed evidence of the NB Law pattern in i nancial information in tax returns declarations. Other authors, such as Huxley (1999), Ashcrot , Bae, and Norvell (2002), Kumar and Bhattacharya (2002), and Posch (2004), also used the NB Law pattern in their studies as a tool for supporting auditing processes.
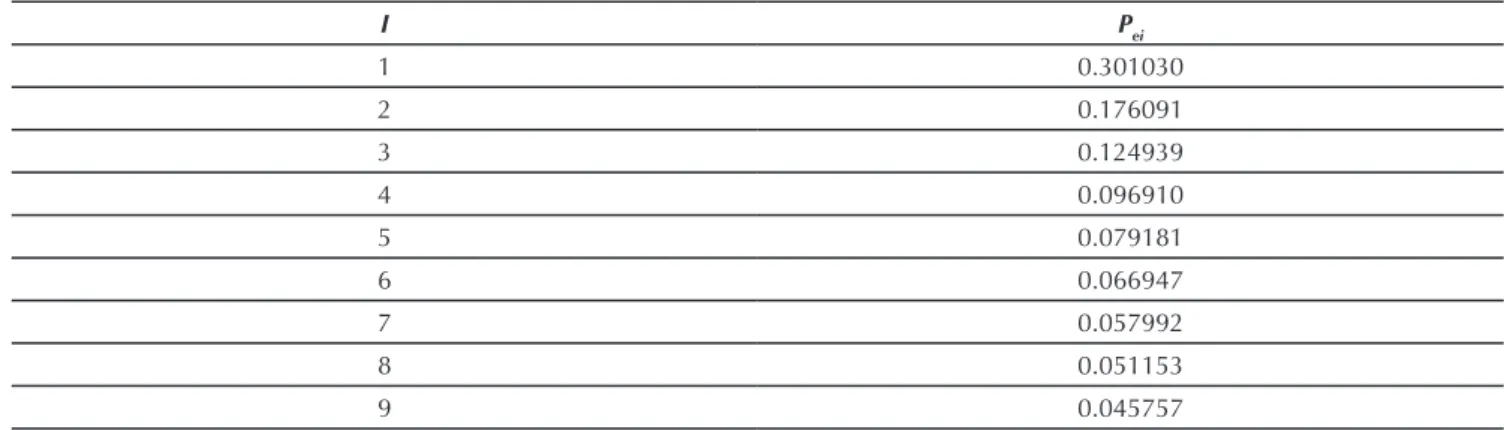
h e reduction in the probabilities of occurrence of the digits 1 to 9 as i rst signii cant digits was initially obtained by Beford (1938), and widely used and perfected by Hill (1995). h e probability � � of digit d occurring as the i rst signii cant digit is obtained by the equation
Table 1Probability of Occurrence of the First Signifi cant Digit
I P
ei
1 0.301030
2 0.176091
3 0.124939
4 0.096910
5 0.079181
6 0.066947
7 0.057992
8 0.051153
9 0.045757
Source: Prepared by the authors.
� � = ���10 1 +1
�
Using equation (1), the probabilities of occurrences for the i rst digit are shown in Table 1. h e probabilities listed in Table 1 are obtained by the equation ���,�= 1, … , 9 of the NB Law, considering the digits from 1 to 9 in the i rst signii cant position. As can be observed, the probabilities
associated with the digits 1 to 5 are greater than with the digits 6 to 9, which would contradict common sense that the occurrences of the digits are associated with equiprobable events. h e NB Law reinforces that this behavior does not in fact prevail.
In an application for Brazil, Santos, Ribeiro, Lagioia, Alves, and Araújo (2009) evaluated use of the NB Law in the area of tax auditing for the Tax on Services of Any Nature (ISS). For this, the authors analyzed records of tax invoices issued by an advertising company between 2002 and 2005. h e results obtained showed the existence of possible deviations regarding the issuing and bookkeeping of the tax invoices of the company concerned, which were coni rmed by the results of an inspection.
Some studies apply the NB Law in contracts resulting from state public spending, which was coni rmed in the study from Santos, Diniz, and Corrar (2005). h e authors applied the accounting metrics computerized auditing model using the NB Law together with the Z-test and the χ2-test in a sample formed of approximately 104 thousand contracts, with usefulness being found in the analysis in terms of it determining the standard spending behavior practiced by public administrators. h e results obtained showed indications of overbilling and breaking up of expenses, with the aim of bypassing the limit established by Federal Law n. 8.666 (Public Tenders Law, 1993) for public sector acquisitions.
Another paper which presents the application of the NB Law in contracts was carried out by Ribeiro, Montenegro, Santos, and Galvão (2005), who reproduced the accounting metrics model created by Nigrini (2000), also used by Santos, Diniz, and Ribeiro (2003) in the context of accounting auditing to analyze the contracts of 20 municipalities in the state of Paraíba.
In 2010, Diniz, Corrar, and Slomski investigated whether non-random elements of human behavior could be determinants in the modii cation of expense values in municipal legal reporting. h e authors opted to select 225,421 contracts from 40 investigated municipalities, in accordance with volumes of resources managed, dividing the sample into large and small municipalities (Diniz et al., 2010).
Another study which applies the NB Law pattern in contracts was conducted by Costa (2012), who developed and applied an accounting metrics model for detecting i nancial deviations based on the NB Law to analyze 335,830 contracts issued in the 2010 i nancial year by 60 Management Units (MUs) in three Brazilian states. Based on this study, the author presented a NB Law proposal to the Courts of Auditors. In 2012, Costa et al. analyzed compliance in public spending by federal bodies and applied the NB Law to 134,281 contracts issued by 20 MUs in two Brazilian states for the i rst and second digits (Costa, Santos & Travassos, 2012).
Costa, Silva, Travassos, and Santos (2013) analyzed NB Law compliance in a continuous auditing environment, in 210,899 contracts issued by 60 Management Units (MUs) in two states in the Brazilian Northeast during 2010. Costa, Travassos, Soeiro, and Santos (2013) used accounting metrics in detecting the occurrence of signii cant deviations in the distribution of the i rst digit in state public spending, in relation to the standard distribution dei ned in the NB Law, in 109,888 contracts issued by 20 MUs in two states in the Northeast, ten MUs in each state.
2.3 Statistical Inference in Frequencies of Digits Analyses
Some statistical tests have been used in studies with an emphasis on i nancial deviation detection analyses, such as those from Carslaw (1988) and Nigrini (1996), among others. Among the tests used, the Z-test and X² -test stand out.
In the context of the NB Law, the -test can be used for inferences regarding the frequencies of the digits 0 to 9, when individually observed for the i rst signii cant digits in a set of numerical information. h e corresponding test statistic is given by
�= ��� − ���
��(1− ���) ,
in which ���=���� , ���=����,n being the sample
size, pei the expected probabilities, and poi the frequencies observed. h us, at a level of signii cance of α = 0.05, H0A(the null hypothesis being tested) is rejected when Z
< - Zcritical or if Z > Zcritical. For a level of signii cance of α =
0.05, the hypothesis of inexistence of signii cant deviations (H0A) will be rejected when Z < -1.96 or Z > 1.96.
Using the Z statistic given in equation (2), margins of tolerance [�����] can be obtained for the frequencies
observed (poi, i = 1,2, ...,9), in line with the NB Law, expressed as follows:
Using the χ2-test, the interest of analysis lies in investigating whether the frequencies of the digits in a particular position (for example, the frequencies of the
digits 1 to 9 in the i rst signii cant position) follow the patterns established by the NB Law. To carry out the χ2 -test, the following test statistic is used:
�����= ���− ��
��� 1− ���
� ,���+ ��
��� 1− ���
� ,�= 1,2,⋯, 9.
�=∑�=19 ����− ���)
2
��� ,
in which ���=���� and ���=���� are the absolute
frequencies observed and expected for digit i, i = 1, ...9 in the i rst signii cant position, and n represents the sample size. h us, at a level of signii cance of α = 0.05, H0B (the hypothesis of global adjustment of frequencies
in accordance with the NB Law) is rejected when the statistic χ2 > 15.507.
As observed by some authors, the Z-test and the χ2-test present a problem when signii cantly large samples are used, leading to tests with very low error rates, and thus with considerably high powers (Nigrini & Mittermaier, 1997; Krakar & Žgela, 2009; Suh et al., 2011). h is fact is known in the literature as “excess of power”. According to Nigrini and Mittermaier (1997), the Z-test rejects the null hypothesis in samples of more than 100,000 elements in size, even when the diff erences between the frequencies observed and the NB Law probabilities are considered as immaterial from the auditing point of view. According to Krakar and Žgela (2009), the χ2-test also presents this same problem in samples of more the 10,000 elements in size. h is paper proposes the use of a measure of relative percentage variation, which is defined as relative discrepancy, in a time series analysis of frequencies observed for the digits 1 to 9 in the i rst signii cant position. Such a measure was also used by Žgela (2011) in a study regarding percentage variations occurring between 2001 and 2011 in the DAX index in the German capital market. However, the analyses were carried out using accumulated information for the whole period (at the end of 2011). Using relative discrepancies, it is possible
to construct time series without there being the problem of “excess power”, as highlighted in Nigrini and Mittermaier (1997), Nigrini (2000), and Krakar and Žgela (2009). h ere is a notable advantage in using relative discrepancy time series compared to the proposal analyzed in Suh et al., (2011): the study proposed by these authors, although it follows a robust simulation strategy, is computationally more exhaustive, which can create diffi culties for its implementation in large databases. However, the use of it in a future study is suggested, which could compare the two methodologies.
In this paper, the studies were conducted using data on contracts issued by 60 management units, divided between two states in the Brazilian northeast, in 2010. h us, the use of the Z and χ2 tests can lead to unreliable results, given that these tests assume the use of independent samples. Moreover, the use of these tests in quite large samples tends to lead to the problem of “excess power”. h is can be observed when a i xed level of signii cance is used, and the sample size increases indei nitely. In this case, it is noted that the coni dence intervals for the proportions observed tend to be close to zero in length.
Another important aspect of a practical nature is the fact that in two samples with large diff erences in sizes (n1
>> n2 , a comparison between the coni dence intervals constructed with the use of the statistic would tend to be uninformative, given that in this case the relative chance of i nding information that is non-compliant with the NB Law in an n2 sized sample is greater than it is for an
n1 sized sample.
3
3 METHODOLOGICAL PROCEDURES
The methodology used in this study consisted of carrying out two empirical analyses regarding the relative frequencies of the digits 1 to 9 observed in the i rst signii cant position in a set of contracts issued by 60 MUs in two states in the Brazilian northeast (states S1 and S2). In the analyses, 30 MUs are considered per state, based on data related to 2010. In a i rst study, for each state, the information on the observed proportions was grouped by digit into each MU from states S1 and S2. h e information was totaled for the end of 2010; that is, the quantities in contracts issued over the whole of 2010 were accumulated for each management unit in each one of states S1 and S2. At this point, the intention is to show how the NB Law pattern is observed more in the MUs that issued the greatest number of contracts in 2010.
Subsequently, the time series of relative discrepancies in observed frequencies were evaluated relative to the respective probabilities expected by the NB Law. h e series were constructed with the data grouped by state and analyzed by signii cant digit.
In the focus of this study, relative discrepancies are defined as the ratios of the differences between the frequencies of digits observed (calculated from the data) and the respective probabilities expected by the NB Law [(poi – pei), i = 1, ..., 9], over the respective expected probabilities (Cribari & Silva, 2011). For example, considering the digit 1 in the i rst signii cant position, the expression of discrepancy relative to the probability expected by the NB Law (given by ��1≈0.301), in period t, is calculated using the following expression:
��1(t) =��1
t − ��1
��1 ,
in which p01 (t) denotes the relative frequency of the digit 1 in the i rst signii cant position in the tth period of time. With regards to the analysis results, these suggest that the use of time series information regarding the frequencies of digits observed allows for the periods when the greatest
deviations are formed to be identii ed, as well as making it possible to carry out a more detailed study regarding management units that present specii c deviation patterns, adding information to sampling procedures in continuous auditing environments.
4 RESULTS ANALYSIS
For the i rst analysis, the relative frequencies of each digit (1 to 9) were calculated, organizing the contracts issued in 2010 by management unit (MUs 1 to 30 in each state) and by state (states S1 and S2). h e aim of this study lies in evaluating, in a general way, the behavior of the frequencies of the digits 1 to 9 in the i rst signii cant position as the number of contracts issued increases.
Based on accepting the hypothesis that the NB Law is a mathematical law that governs the natural distribution of the digits that compose numbers, the occurrence of deviations in the distribution of digits, with regards to complying with the frequencies predicted in the aforementioned Law, would show evidence of human interference (Diniz et al., 2010). h us, the deviations marked as a result of the analyses would be indications of human interference in the natural behavior of numbers, with this interference, in turn, being a possible indication of the occurrence of errors or frauds.
In the context of this analysis, focused on determining the compliance deviations observed for each digit, it is emphasized that positive relative discrepancies will signal a set of information that is more relevant to an auditing sampling process which aims to collect contract values that are non-compliant with the NB Law (Costa et al., 2012).
To explain this fact, suppose that x contract values are added to a set of contract values complying with the NB Law, the former starting with each one of the digits 1 to 8, thus totaling 8x additions (x in each digit). In this case, in an analysis carried out solely for the digit 9, it would not be possible to locate the contracts added, while in an analysis for the digits 1 to 8 this would be possible. Even though the quantities added to the digits are the same (x
for each digit), the chances of i nding a non-compliant element inserted would be greater in a sample formed of elements starting with the digit 8. h is occurs because the proportion of contracts altered in the group of values
beginning with the digit 8 would have a superior value to the respective proportions related to the other digits (Costa, 2012).
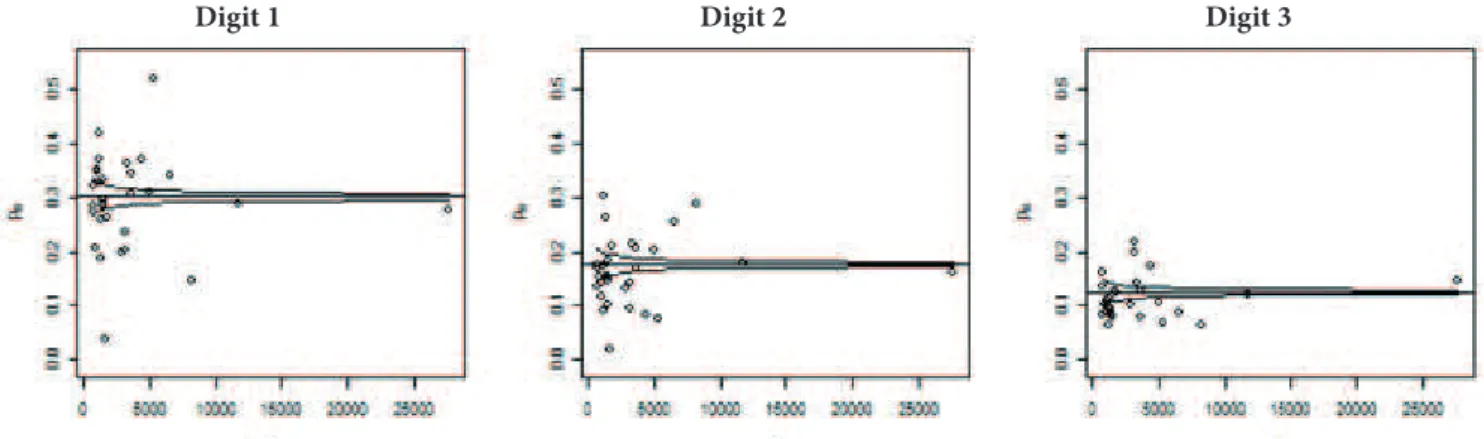
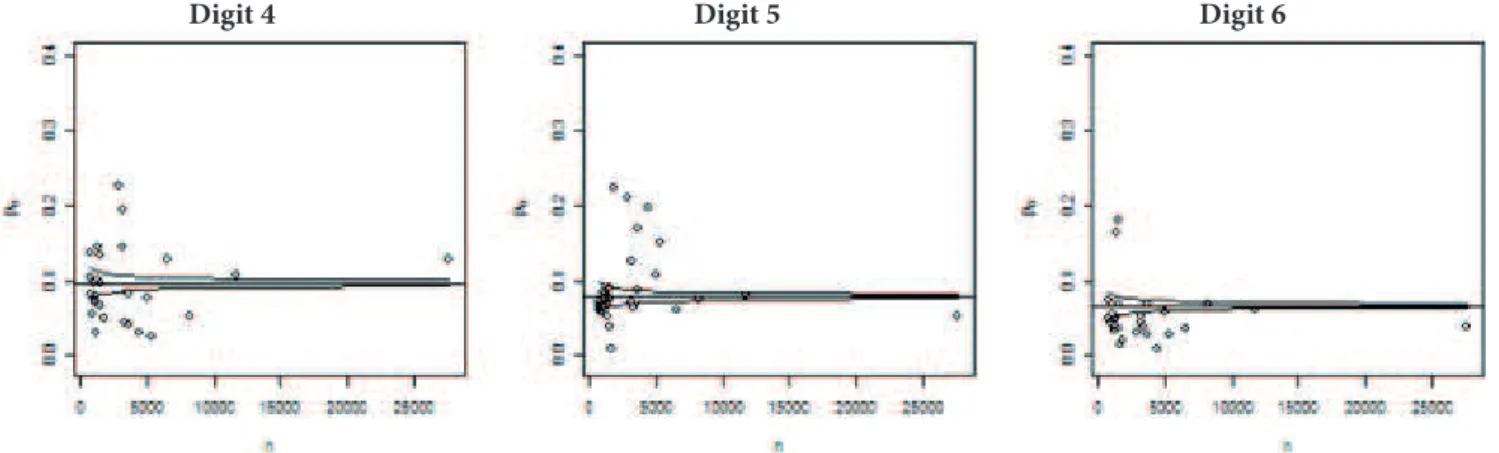
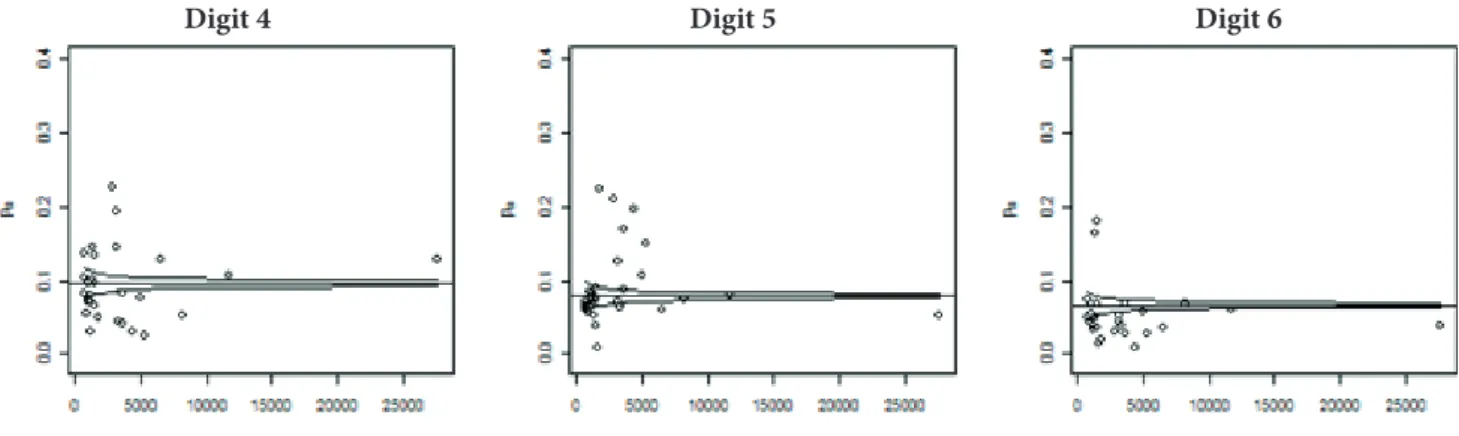
Figures 1 to 6 contain the graphs of observed relative frequencies (frequencies for the i rst signii cant position on the y axis) against the number of contracts issued by each MU in 2010 (x axis). h e numbers of contracts recorded on the horizontal axis (x axis) were obtained directly from the historic databases for each MU in the corresponding year of analysis. Figures 1 to 3 refer to state S1 and i gures 4 to 6 refer to state S2. In each graph, the margins of coni dence are also shown for each frequency observed (limits of tolerance for NB Law compliance). h e coni dence intervals were constructed as described in expression (3) in section 2.3, this being α = 0.05 (that is, the degree of coverage considered is 95%). As can be observed, in all of the i gures, as the number of contracts (n) increases, there is a tendency towards NB Law compliance. h is fact was highlighted most in MUs 1 and 2 in state S1, with 27,691 and 11,809 contracts each, respectively, and for MUs 3 and 12 in state S2, with 21,796 and 11,006 contracts.
In general terms, in both states a greater spread of observed frequencies around the expected frequencies (established by the NB Law) is noted, when the number of contracts is lower than 5,000. Also in the context of this analysis, one fact to be observed is that graphs such as those in Figures 1 to 6 allow a general and comparative analysis to be carried out regarding all of the digits, signaling the MUs that present the greatest deviations from the NB Law via observed frequencies that are very far from the established coni dence bands.
However, when structured as thus, this analysis does not allow for the period over the course of 2010 to be analyzed. Additionally, given the significantly high number of contracts, with α being i xed, the coni dence intervals for the observed proportions tend to be close to zero in length. h is is due to the fact that, at a i xed nominal level (i xed α value), the power of the Z-test tends towards a value close to 1 as the sample size increases indei nitely. h ese coni dence intervals would show the “excess power” eff ect cited by Nigrini and Mittermaier (1997) and Krakar and Žgela (2009).
Figure 1Graphs of observed frequencies for state S1 at the end of 2010 for the digits 1, 2, and 3.
Source: Prepared by the authors.
Figure 2Graphs of observed frequencies for state S1 at the end of 2010 for the digits 4, 5, and 6.
Source: Prepared by the authors.
Digit 4 Digit 5 Digit 6
Figure 3 Graphs of observed frequencies for state S1 at the end of 2010 for the digits 7, 8, and 9.
Source: Prepared by the authors.
Digit 7 Digit 8 Digit 9
Figure 4 Graphs of observed frequencies for state S2 at the end of 2010 for the digits 1, 2, and 3.
Source: Prepared by the authors.
In the following analysis, the use of time series of relative discrepancies is proposed, as dei ned in expression (5) in section 3. h is analysis aims to observe the behaviors of deviations from the NB Law probabilities over the course of 2010, and not only at the end of this period. As discussed in sections 2.3 and 3, the use of relative discrepancies allows time analyses to be carried out, which would not be adequate with the use of Z statistic values, since the Z-test assumes the use of independent samples. Moreover, there is a loss in comparative aspects in analyses of samples with big diff erences in size.
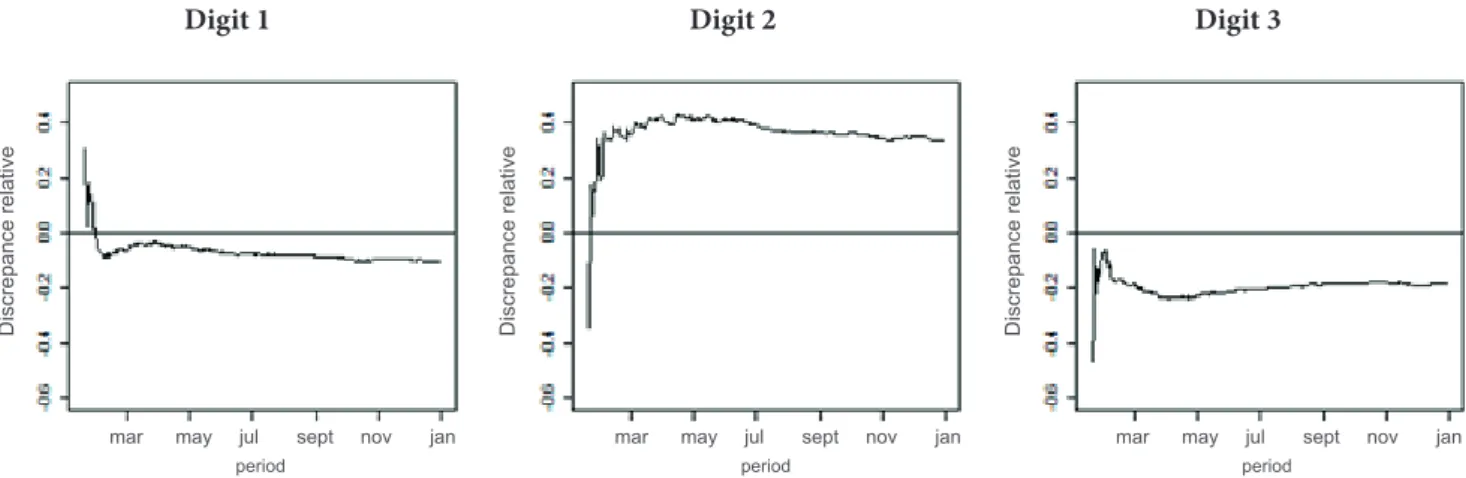
Figures 7 to 9 contain the time series graphs of relative discrepancies for the digits from 1 to 9 in the period from 01/17/2010 to 12/31/2010, considering the total values of contracts issued by the management units from state S2. It is worth noting that in all of the analyses, the choice
of starting date for the time series fuli lled a minimum number n = 100 contracts. h e pattern of deviations observed in Figure 7, with excessive occurrence of the digit 7 and absence of the digits 6, 8, and 9, was already identii ed by Costa et al. (2012), Costa (2012), and Costa, Travassos et al.(2013) in an analysis carried out regarding the behavior of public spending, with it being interpreted by the authors that the exemption limit for public tender processes (set out in Federal Law n. 8.666/93) probably inl uence the behavior of public spending.
h e deviations suggest, given that the limit to spending on purchases and services not involving engineering is up to R$ 8,000.00, the occurrence of a possible displacement of the values starting with the digits 6, 8, and 9 to the digit ‘7’, in values lower than the legal limit established, thus avoiding the need to carry out bidding processes.
Figure 5Graphs of observed frequencies for state S2 at the end of 2010 for the digits 4, 5, and 6.
Source: Prepared by the authors.
Digit 4 Digit 5 Digit 6
Figure 6Graphs of observed frequencies for state S2 at the end of 2010 for the digits 7, 8, and 9.
Source: Prepared by the authors.
Figure 7Time series graphs of relative discrepancies for state S2 in the period from 01/17/2010 to 12/31/2010 for digits 1, 2, and 3.
Source: Prepared by the authors.
Figure 8 Time series graphs of relative discrepancies for state S2 in the period from 01/17/2010 to 12/31/2010 for digits 4, 5, and 6.
Source: Prepared by the authors.
Figure 9Time series graphs of relative discrepancies for state S2 in the period from 01/17/2010 to 12/31/2010 for digits 7, 8, and 9.
Source: Prepared by the authors.
Digit 1 Digit 2 Digit 3
Discrepance relative
mar may jul sept nov jan period
Discrepance relative
mar may jul sept nov jan period
Discrepance relative
mar may jul sept nov jan period
Digit 4 Digit 5 Digit 6
Discrepance relative
mar may jul sept nov jan period
Discrepance relative
mar may jul sept nov jan period
Discrepance relative
mar may jul sept nov jan period
Digit 7 Digit 8 Digit 9
Discrepance relative
mar may jul sept nov jan period
Discrepance relative
mar may jul sept nov jan period
Discrepance relative
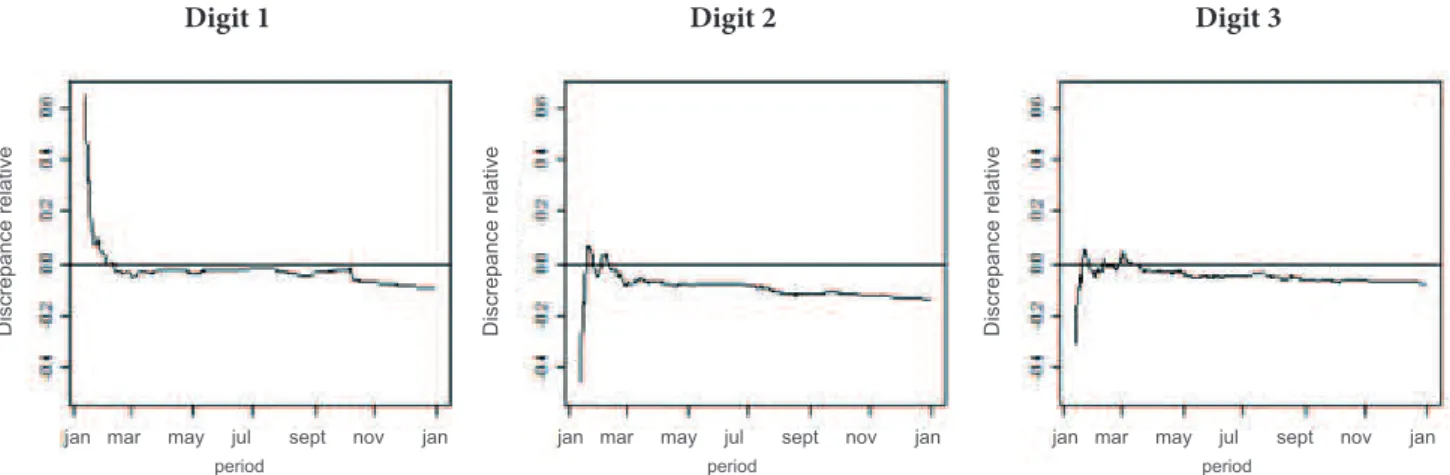
Observing Figures 10 to 12, related to state S1 in the period from 01/31/2010 to 12/31/2010, it is noted once more that the pattern of deviations observed for the digits 6, 7, 8, and 9 also suggest the bidding limit having a possible inl uence over state S1’s spending, given that deviations due to the absence of the digits 6 and 9 were
observed, accompanied by a deviation due to an excess in the digit 7. h e digit 8, although it presented a deviation due to excess at er 01/27/2010, showed evidence of the inl uence of bidding limits, given that 1,279 contracts out of the 5,878 contracts beginning with the digit 8 are equal in value to the bidding limit of up to R$ 8,000.00; that is, 21.76% of the total.
Figure 10 Time series graphs of relative discrepancies for state S1 in the period from 01/13/2010 to 12/31/2010 for the digits 1, 2, and 3.
Source: Prepared by the authors.
Figure 11Time series graphs of relative discrepancies for state S1 in the period from 01/13/2010 to 12/31/2010 for the digits 4, 5, and 6.
Source: Prepared by the authors.
Digit 4 Digit 5 Digit 6
Digit 7 Digit 8 Digit 9
Digit 1 Digit 2 Digit 3
Discrepance relative
jan mar may jul sept nov jan period
Discrepance relative Discrepance relative
jan mar may jul sept nov jan period
jan mar may jul sept nov jan period
Discrepance relative
jan mar may jul sept nov jan period
Discrepance relative Discrepance relative
jan mar may jul sept nov jan period
jan mar may jul sept nov jan period
Figure 13 presents the time series graph of relative discrepancies observed for the digit 8, removing 1,279 contracts from the sample with values equal to the bidding limit (R$ 8,000.00), within the same period considered in i gures 7 to 9. As can be observed, in contrast with
the graph for the digit 8 in Figure 12, there is a change in the behavior of the time series (before typically rising, and at er typically falling). h us, it is concluded that the excesses of the digit 8 were caused principally by the great number of contracts issued with values equal to this limit (R$ 8,000.00) over the whole of 2010.
Figure 13Graph of relative discrepancies observed for the digit 8 in the fi rst signifi cant position, considering all of the MUs from state S1 in the period from 01/31/2010 to 12/31/2010.
Source: Prepared by the authors.
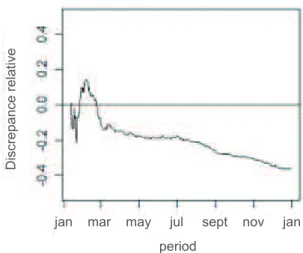
With a particular focus in the second analysis, two management units in state S2 (MUs 8 and 15) were identified as presenting positive variations over the i nancial period analyzed, which were mostly compensated for by the end of 2010. Figure 14 presents the time series graph of relative discrepancies observed for the digit 2 in the i rst signii cant position for the contract values reported by MU 15 in state S2 in 2010.
Observing Figure 14, a rising behavior for relative discrepancy is noted from the beginning of January until the end of June 2010, reaching its maximum positive
deviation of 87% on 07/25/2010. Despite the occurrence of this expressive deviation in the i rst semester, it is seen that in the following semester there was an inverse behavior, with a gradual reduction in deviations until reaching a level of 23.5% at the end of the i nancial period. In the case of MU 15, the frequency observed for the digit 2 was 0.217 for 2010, a value outside the coni dence interval with 95% coverage (Ic = [0.161, 0.190]). h us, the two-tailed Z-test rejects the null hypothesis that the frequency observed for the digit 2 is equal to the probability established by the NB Law (≈ 0,176) at a level of signii cance of α = 0.05.
Discrepance relative
jan mar may jul sept nov jan
Figure 15 shows the graph of relative discrepancies corresponding to the digit 7, considering the i nancial information on MU 8 from state S2. As can be observed, in the period between the end of May and the beginning of June the relative discrepancy values presented a rapid and signii cant increase, reaching their maximum point on 06/16/2010, with a positive deviation of 68.63%. From
this point on, a reduction in the deviations is seen until the close of the 2010 i nancial year, with a relative discrepancy of 7.41%. Unlike MU 15, in the case of MU 8 the frequency observed for the digit 7 at the end of 2010 was 0.062, a value within the coni dence interval with 95% coverage (Ic = [0.049, 0.066]).
Figure 14Graph of relative discrepancies observed for the digit 2 in the fi rst signifi cant position, considering MU 15 from state S2 in the period from 01/31/2010 to 12/31/2010.
Source: Prepared by the authors.
Figure 15Graph of relative discrepancies observed for the digit 7 in the fi rst signifi cant position, considering MU 8 from state S2 in the period from 01/31/2010 to 12/31/2010.
Source: Prepared by the authors.
h e previous two examples show that carrying out a time series analysis such as that proposed in this study both allows for peaks in deviations occurring in the period analyzed to be identii ed, as well as making it possible to determine with greater precision the elements of interest
based on the expression ��7 � =��7 � − �� �7
�7 , the quantity
��7�
��7� + 1=
��7� − ��7
��7 represents the relative chance of i nding contracts that caused deviations due to excess in the set of contract values beginning with the digit 7. In the case of
Discrepance relative
jan mar may jul sept nov jan
period
Discrepance relative
jan mar may jul sept nov jan
is close to 40.47%.
From the result above, it is seen that the use of relative discrepancies, unlike the Z and χ2 tests, which become more rigorous when the number of elements analyzed
increases, impairing NB Law compliance analyses, rel ects the proportion of deviations observed, independent of sample size.
5 FINAL REMARKS
h is paper analyzed NB Law compliance as a proposal for identifying deviations over time in continuous auditing environments, using 210,899 contracts issued by 60 MUs in two states in the Brazilian Northeast in 2010. h ese contracts were analyzed for the distribution of the i rst signii cant digit, at the end and over the course of that year.
Based on monitoring in a computerized environment, using graphical analysis of observed frequencies and time series of relative discrepancies (see i gures 1 to 12), the formation of typical patterns of possible irregularities or digressions from Public Tenders Law (Federal Law n. 8.666/93) was verii ed. h is law grants coercive powers to external controlling bodies in relation to investigated irregularities in processing public spending. Figures 1 to 12 show possible features of public spending being broken up into lower values or ones equal to the spending limit, which is a practice used to bypass carrying out public tender processes, as well as to allocate public spending to a favorite supplier, as discussed in studies from Costa et al. (2012) and Costa (2012).
In using relative discrepancies over time, it was also identii ed that MU 8 from state S2 presented the occurrence of signii cant deviations over the period (Dr = 68.63%), in contrast with the deviation observed at the end of the period (of only 7.41%), even causing the non-rejection of the null hypothesis (H0A) for the analyzed digit 7. Similarly, it was shown in this paper that NB Law compliance analyses, carried out using relative discrepancies, also allow to identify the risk of i nding elements with excessive occurrence to be found for the
digits analyzed, independent of sample size, unlike what is observed with the Z and χ2 tests, which become more rigorous when the number of elements analyzed increases. h us, implanting simultaneous controls in computerized auditing environments was found to be relevant, as well as their promptness and greater eff ectiveness, given that they are carried out over the course of or shortly at er an occurrence. h is short timeframe not only means a greater chance of success, but also the possibility of stopping the eff ects of any irregular activity that might be detected (Costa et al., 2012; Costa, 2012).
It was shown, in section 4, that a continuous auditing environment based on the methodological approach involving the NB Law contributes in helping auditing teams construct pathways, due to greater eff ectiveness over the course of or shortly at er the occurrence of events to be inspected; that is, time and volume limits for processing information are extended. h us, convinced the analyst, when selecting the data that will compose their samples for analysis, he suggests to the auditor the relevant points to be observed regarding deviations in public spending patterns, directly contributing to the planning of their audits.
It is clear that this article, in light of the results observed from carrying out a time series analysis of NB Law compliance, both makes it possible to identify peaks in deviations occurring in the period analyzed, as well as allowing for elements to be more precisely identii ed which are of interest when forming samples for applying this approach in continuous auditing environments.
REFERENCES
Arens, A. A.; Elder, R. J., & Beasley, M. S. (2004). Auditing and Assurance Services (10th ed.). Upper Saddle River: Prentice Hall.
Ashcrot , P., Bae, B., & Norvell, J. (2002). Application of digital analysis in the audit. Today’s CPA, (5), 31-35. Retrieved from http://www.csub.edu/~bbae/publication/digital%20
analysis%20in%20audit.todays%20cp a%202002.pdf.
Attie, W. (1998). Auditoria, conceitos e aplicações (3a ed.). São Paulo: Atlas.
Benford, F. (1938). h e law of anomalous numbers. Proceedings of the American Philosophical Society, 78(4), 551-572.
Carslaw, C. A. P. N. (1988, April). Anomolies in income numbers: evidence of goal oriented behavior. Th e Accounting Review, 2(63), 321-327.
Costa, J. I. F. (2012). Desenvolvimento de metodologias contabilométricas aplicadas à auditoria contábil digital: uma proposta de análise da lei de Newcomb-Benford para os Tribunais de Contas. Master’s Degree, Universidade Federal de Pernambuco, Recife, PE, Brasil.
Address for correspondence:
para o primeiro e segundo dígito em dois estados brasileiros. Revista Contabilidade &. Finanças, 23(60), 187-198.
Costa, J. I. F., Silva, W. B., Travassos, S. K. M., & Santos, J. (2013) Análise de Conformidade da Lei de Newcomb-Benford no Ambiente de Auditoria Contínua: Uma Proposta de Identii cação de Desvios no Tempo. In Anais do 37º Encontro Nacional da Associação Nacional de Pós-Graduação e Pesquisa em Administração, Rio de Janeiro, RJ, Brasil.
Costa, J. I. F., Travassos, S. K. M., Soeiro, T. M., & Santos, J. S. (2013). Statistical analysis in detection of deviation occurrence in the distribution of i rst signii cant digit of state public spending in relation to the standard distribution dei ned in Newcomb-Benford’s law. In 10ªConferência Internacional sobre Sistemas de Informação e Gestão de Tecnologia, São Paulo, SP, Brasil.
Cribari-Neto, F., & Silva, W. B. (2011). A new heteroskedasticity-consistent covariance matrix estimator for the linear
regression model. AStA Advances in Statistical Analysis, 95(2), 129-146.
Diniz, J. A., Corrar, L. J., & Slomski, V. (2010). Análise digital: uma abordagem cognitiva na detecção de não conformidade em prestações de contas municipais. Anais do 10º Congresso USP de Controladoria e Contabilidade, São Paulo, SP, Brasil. Hill, T. P. (1995). Base-invariance implies Benford’s law.
Proceedings of the American Mathematical Society, 123(3), 887-895.
Hill, T. P. (1996). A Statistical derivation of the signii cant-digital law. Statistical Science, 10(4), 354-363.
Huxley, S. J. (1999). Why Benford’s law works and how to do digit analysis on spreadsheets. Proceedings of the Annual International Conference of the Decision Sciences Institute, Athens, Greece.
Krakar, Z., & Žgela, M. (2009). Application of Benford’s law in payment systems auditing. Journal of Information and Organizational Sciences, 33(1), 39-51.
Kumar, K., & Bhattacharya, S. (2002). Benford’s law and its application in i nancial fraud detection. Th e Advances in Financial Planning and Forecasting,11, 57-70.
Lei n. 8.666, de 21 de junho de 1993 (1993). Regulamenta o art. 37, inciso XXI, da Constituição Federal, institui normas para licitações e contratos da administração pública, e dá outras providências. Brasília. Retrieved from http://www.planalto.
gov.br/ccivil_03/Leis/L8666cons.htm.
Lima, A. L. P., & Vieira, S. S. C. (2002). Auditoria e controle, Caderno 1, n. 1.
Mills, A. C. (1994). A auditoria da qualidade: uma ferramenta para avaliação constante e sistemática da manutenção da qualidade (5a ed.). São Paulo: Makron Books.
Murcia, F. D., Souza, F. C., & Borba, J. A. (2008). Continuous audit: a literature review. Revista Organizações em Contexto (online), 4(7), 1-17.
Newcomb, S. (1881). Note on the frequency of use of the diff erent digits in natural numbers. American Journal of Mathematics, 4(1), 39-40.
Nigrini, M. J. (1996). A taxpayer compliance application of Benford’s law. Th e American Taxation Association 1, 72-91. Nigrini, M. J. (1999). I´ve got your number. Journal of
Accountancy, 187(5), 79-83.
Nigrini, M. J. (2000). Digital Analysis Using Benford’s Law: Tests& Statistics for Auditors. Vancouver: Global Audit Publications. Nigrini, M. J., & Mittermaier, L. J. (1997). h e use of Benford’s Law
as an aid in analytical procedures. Auditing,16(2), 52-68. Pinkham, R. S. (1961). On the distribution of i rst signii cant digits. Annals of Mathematical Statistics, 32(4), 1223-1230. Posch, P. N. (2004). Ziff ernanalyse in der Fälschungsaufspürung.
Benford’s Gesetz und Steuererklärungen in h eorie und Praxis. Unpublished manuscript. Retrieved from http://www.
posch.net/paper/posch_faelschungenbenford.pdf.
Raimi, R. (1969). h e peculiar distribution of i rst signii cant digits. Scientifi c American, 221(6), 109-120.
Ribeiro, J. C., Montenegro, G. B., Santos, J., & Galvão, K. S. (2005). Aplicação da Lei de Newcomb-Benford na Auditoria. Caso notas de empenho dos Municípios do Estado da Paraíba. In Anais do 5º Congresso USP de Controladoria e Contabilidade, São Paulo, SP, Brasil.
Santos, J., Diniz, J. A., & Ribeiro, J. F., Filho (2003). A Lei de Newcomb-Benford: uma aplicação para determinar o DNA-equivalente das despesas no setor público. In Anais do 3º Congresso USP de Controladoria e Contabilidade, São Paulo, SP, Brasil.
Santos, J., Diniz, J. A., & Corrar, L. J. (2005). O foco é a Teoria Amostral nos campos da auditoria contábil tradicional e da auditoria digital: testando a Lei de Newcomb- Benford para o primeiro dígito nas contas públicas. Brazilian Business Review, 2(1), 71-89.
Santos, J., Ribeiro, J. F., Filho, Lagioia, U., Alves, B. F. A., Filho, & Araújo, I. J. C. (2009). Aplicações da lei de Newcomb-Benford na auditoria tributária do Imposto sobre Serviços de Qualquer Natureza (ISS). Revista Contabilidade & Finanças, 20(49), 79-94.
Suh, I. S., Headrick, T. C, & Minaburo, S. (2011). An Eff ective and Effi cient Analytic Technique: A Bootstrap Regression Procedure and Benford’s Law. Journal of Forensic & Investigative Accounting, 3(3), 25-45.
h omas, J. K. (1989). Unusual patterns in reported earnings. The Accounting Review64(4), 773-787.
Varian, H. R. (1972). Benford’s Law. Th e American Statistician, 26(3), 65-66.
Vasarhelyi, M. A., & Halper, F.B. (1991). h e continuous audit of online systems. Auditing: A Journal of Practice and Th eory, 10(1), 110-125.
Watrin, C., Struff ert, R., & Ullmann, R. (2008). Benford’s Law: an instrument for selecting tax audit targets? Review of Managerial Science, 2(3), 219–237.