PATTERN IN INTERACTION IN THE MAIZE YIELD TRIAL
Vojka B. Babić1*, Milosav M. Babić1, Mile R. Ivanović2 and
Milomir R. Filipović1
1
Maize Research Institute, Slobodana Bajića 1, 11185 Belgrade-Zemun, Serbia
2
Institute of Field and Vegetable Crops, Maksima Gorkog 30, 21000 Novi Sad, Serbia
Abstract: In making decisions on the development of varieties and the
identification of certain growing regions, the effects of genotype (G) and genotype by environment (GxE) are very important. Although the main genotype effect and the interaction effect should be partitioned, there is still a need for their integration in the yield, as both simultaneously affect a ranking of the particular genotype within a certain environment. The AMMI (Additive Main Effect and Multiplicative Interaction) analysis, as a hybrid model, provides appropriate partitioning. The AMMI2 model, capturing 98.4% of the treatment sum of squares, was used, and 12 observed environments were classified into three target environments. Hence, out of 15 commercial maize hybrids, used in the trial, the hybrids ZP-677, ZP-570 and ZP-732 were selected as carriers of maximum yields in three target environments. In this way, it was shown that even in a relatively small region a narrow adaptation of genotypes can be exploited.
Key words: AMMI, GxE interaction, maize hybrids, target environments.
Introduction
Plant breeders very often carry out trials of a very wide scope, and then make their decision, almost exclusively, on the average values of the additive main effects, neglecting the interaction. It is widely known that the genotype by environment (GxE) interaction limits breeding efficiency. With the aim to optimise grain yield, having in mind that superior genotype does not win always and everywhere (GxE interaction), it is necessary to subdivide large growing regions into smaller target environments. That subdivision can be done more accurately by taking into account pattern in interaction effects (using of specific response of genotypes represented by GxE interaction) in order to group larger numbers of environments into a smaller number of target environments. The target environment does not necessarily mean a continual region in geographical sense,
but more in a sense of expression of a similar interaction response of investigated genotypes in terms of grain yield (Ebdon and Gauch, 2002a, b). It happens quite often that the conditions of the microenvironment and cultural practices differ within and among states found in the same agroclimatic zone (Badu-Apraku et al., 2003). The defined target environment in a geographical sense is very important as it is useful not only for hybrid recommendation, but also for a rational and efficient choice of test sites and directed breeding (M’Benga, 1989).
Kempton (1984) provided the first essential application of the AMMI analysis in yield trials. Afterwards Gauch and Zobel (1988, 1997), and Gauch (1990, 2006) in their studies, presented a significant accuracy of estimates and statistical efficiency of the AMMI model. The same authors (Gauch and Zobel, 1989) also showed its application in more efficient and precise selection. This study pointed to the AMMI biplot graph as an exceptional statistical facility for understanding the complex of GxE interactions. The numerous following studies emphasised the worthiness of the AMMI model in interpreting the complex of GxE interactions (Crossa, 1990; Gunjača, 2001; Gunjača et al., 2007). AMMI represents a model family from AMMI0 to AMMIF. Since the model encompasses several sources: genotype main effect, environment main effect and the interaction with 0-F interaction’s PCA axes (IPCA), the choice has actually to be made in regard to the number of IPCA axes to include in the model. Moreno-Gonzalez et al. (2003a, b) recommend the RMSPD (root mean square predictive difference) factor as a good quality criterion in the process of choosing the most suitable AMMI model for a given set of data.
Practically, the greatest benefit of the AMMI analysis application is better understanding of genotypes, environments and the complex of their interactions, which can be applied to making the recommendations about particular hybrids for certain environments as well as to the reduction of the number of test environments by defining the target environments. The basic assumption of the present study was that more detailed information about the structure of interaction, provided by AMMI analysis, enables more accurate investigated commercial maize hybrids grain yield estimation. Such approach would contribute to better exploitation of yield potential for specific (narrow) adapted maize hybrids.
Materials and Methods
and elementary plot size of 7,392 m2. The following 15 widely grown commercial maize hybrids were selected for the study (FAO 400-700; the number in the brackets is the number of days from emergence to tasselling): ZP-42a (67), ZP-480 (68), 500 (69), ZP-533 (69), ZP-570 (70), ZP-580 (74), ZP-599 (69), check-600 (73), 633 (72), 677 (71), 701 (72), 704 (74), 732 (73), ZP-735 (77), and ZP-753 (73). Standard maize production technology was used.
AMMI model combines ANOVA and PCA in a single analysis with both additive and multiplicative parameters and it is presented by the following equation:
Yger = + g + e + n gn en + ge + ger, where
Yger-the yield of genotype g in environment e for replicate r, -the grand mean,
g-the genotype deviation, e-the environment deviation, n-the singular value for
PCA axis n, gn-the genotype eigenvector for axis n, en-the environment
eigenvector, ge-the residual, ger-the error.
By applying AMMI equation in ammiwins analysis (Gauch, 1996), AMMI expected grain yield for all hybrids in each environment is provided. It was a basis for defining groups of environments, target environments with the same hybrid, AMMI estimated, as the best yielding. Degrees of freedom established by Gollob's method (Gauch, 1992)were accepted.
Results and Discussion
Based on the analysis of variance with the AMMI model, it is noticeable that the participation of the main genotype effect in the treatment sum of squares (SS) amounted to 3%, while the participation of the GxE interaction was 6%, which all together amounted to 9%. As the selection of genotypes, and thereby target environments, is exclusively based on the genotype and the interaction effect, which usually contains only 10 to 40% of the overall variation (Gauch and Zobel, 1997), it can be concluded that statistical analyses very often pay the greatest attention to irrelevant features of the data, thus making a decent decision difficult. Applying AMMI analysis to yield data provides partitioning interaction effects into several principal components (IPCA) and the noise-rich residual that does not contain the pattern.
AMMI1 model captures 97.1% of the treatment sum of squares (SS), while AMMI2, that includes two IPCA axes, captures 98.1% of the treatment SS. Because the interaction has many more degrees of freedom than genotype and environmental main effects, most of noise appears in the interaction. It amounted to 32% for the given yield trial. IPCA1 axis was burdened with 9% of noise and captured 54% of information included into the interaction sum of square, while IPCA2 axis captured 17% of this information. The AMMI model with two IPCA axes captured 90% of the sum of squares of the interaction without the noise and left the residual of 0.444 t ha-1 that was 4.5% of the grand mean. Even residual was significant, accounting for 29% sum of squares for interaction out of which 76.8% were ‘noise’, therefore the AMMI2 model was selected for the present study. Similarly, the relation of the pattern and the noise in the treatment sum of squares amounted to 41.8 since the ratio of the pattern and the noise for the interaction is only 2.1, which is lower by 20 times. According to this, it can be concluded that useful information gained from the interaction could be very quickly lost due to the noise. Therefore, due to the fact that the higher-order IPCA axes are more burdened by the noise, the models AMMI1 and AMMI2 that include one or two IPCA axes are most frequently used.
Table 1. Analysis of variance for AMMI2 model for the maize grain yield.
Source of variation DF SS % of noise MS
Environments 11 7,047.57 0.2 640.69**
Blocks 36 109.33 33.3 3.04**
Genotypes 14 220.26 6.4 15.73**
GxE 154 487.89 32.0 3.17**
IPCA1 24 262.13 9.3 10.92**
IPCA2 22 83.46 26.7 3.79**
Residual 108 142.29 76.8 1.32*
Error 504 509.85 1.01
Treatment 179 7,755.72 43.33
Total 719 8,374.90 11.65
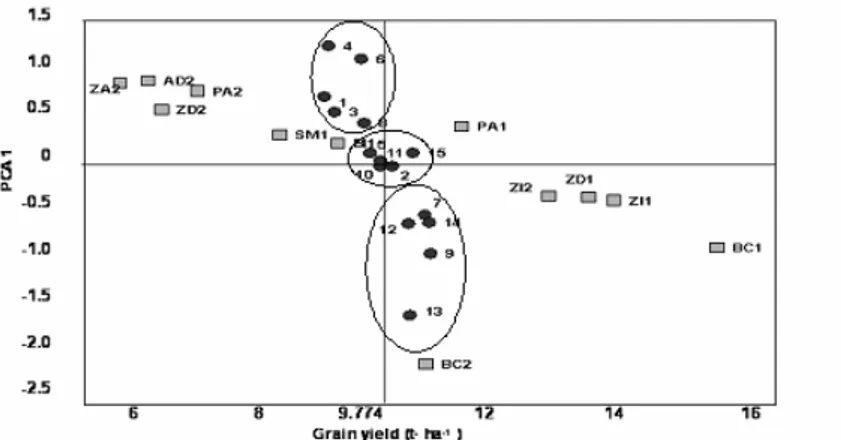
check-600 (10), check-500 (2) and ZP-704 (15), with an average grain yield and values of the IPCA1 score near zero are placed in the second group. As the first IPCA axis accounts for most of the variability of interaction that is the closest to linearity, it means that low values for IPCA1 score for this group of genotypes indicate a weak interaction. The most favourable genotype of this group is the hybrid ZP-704 (15), having at the same time, the highest grain yield and a weak interaction. It makes the hybrid ZP-704 (15) widely recommendable, particularly for the locations with positive values of IPCA1 (PA1, BI1, SM1, ZD2, PA2, AD2, ZA2). The hybrid ZP-704 (15) can be also recommended for the cases when it is more important to obtain stabile grain yield over years rather than maximum grain yield. This is a typical situation for small scaled farmers in Serbia that are at the same time maize producers and consumers, using most or all of their maize production for animal feeding. The hybrids ZP-677 (9), ZP-753 (12), ZP-732 (13), ZP-580 (7) and ZP-735 (14), with above average grain yield and negative values of the IPCA1 score, belong to the third group. At the same time, it is clear that this group has the highest yielding potential. In comparison with genotypes with low values of interaction, this group of genotypes had high negative values of the first IPCA. It indicates that their expected grain yield will be higher in environments that have negative values of the first IPCA. Those environments (ZI2, ZD1, ZI1 and BC1) at the same time are environments that have the highest average grain yield. The expected grain yield for this group of genotypes will be lower in environments with positive values of the first IPCA (Figure 1).
Figure 1. AMMI1 biplot for the maize grain yield (Grain yield - IPCA1).
Hybrids: 1. ZP 42a; 2. check 500; 3. ZP 480; 4. ZP 533; 5. ZP 599; 6. ZP 570; 7. ZP 580; 8. ZP 633; 9. ZP 677; 10. ZP 704; 11. ZP 701; 12. ZP 753; 13. ZP 732; 14. ZP 735; 15. check 600.
It is noticeable that hybrids of the FAO maturity group 400-500 are placed in the upper half of the biplot. Genotypes of the FAO maturity group 600-700 are placed near zero, while negative values of the IPCA1 score are characteristic for the hybrids of the latest maturity group. The rank correlation of the growing season length and the IPCA1 score for genotypes was significant (r = 0.61, p < 0.05), indicating a possible dependence between interaction response and hybrid growing season length. In addition, it is noticeable that positive values of interactions and average grain yields below the grand mean were characteristic for the environments ZA2, AD2, ZD2 and PA2. The average grain yield close to the mean and small positive interaction were characteristic for the environments SM1, BI1 and PA2. High yields and small negative interactions were detected for environments ZI2, ZD1 and ZI1. The environments BC1 and BC2 had high values of interaction and the average yields above the grand mean. A significant correlative relationship between IPCA1 score for environments and available precipitation (r = 0.60, p < 0.05) during a growing season indicate that the part of the pattern in the interaction was due to the difference in precipitation, which pointed to the second prevalent factor that had affected the interaction and stability of the observed maize hybrids.
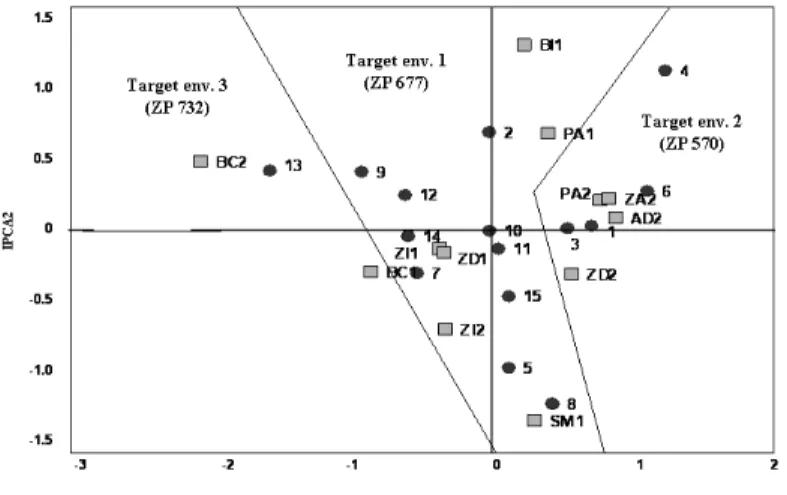
Figure 2. AMMI2 biplot for the maize grain yield with target environments.
Hybrids: 1. ZP 42a; 2. check 500; 3. ZP 480; 4. ZP 533; 5. ZP 599; 6. ZP 570; 7. ZP 580; 8. ZP 633; 9. ZP 677; 10. ZP 704; 11. ZP 701; 12. ZP 753; 13. ZP 732; 14. ZP 735; 15. check 600.
Environments: BC1. Bečej1; ZI1. Z.Polje irr.1; ZD1. Z. Polje dlf.1; BI1. Bijeljina 1; PA1. Pančevo1; SM1. S. Mitrovica1; BC2. Bečej2; ZI2. Z. Polje irr.2; ZD2. Z. Polje dlf.2; PA2. Pančevo2; ZA2. Žarkovci2; AD2. Adaševci2.
main effects for grain yields. By the application of these data, out of 15 commercial hybrids included in the studies, the following ones were distinguished: ZP-677 (9), ZP-570 (6) and ZP-732 (13) as carriers of maximum expected grain yields in at least two environments. In this way, based on a specific response of winning genotypes, 12 environments were classified into three target environments (Table 2).
Each genotype is defined by three dimensions: average grain yield, IPCA1 and IPCA2 scores. In this way, the planes of each genotype are defined by height (defined by grain yield level or deviation from grand mean) and slope in space (defined by values of the first and second IPCA). Lines in AMMI2 biplot (Figure 2), where bordering areas of ‘winning’ for three winning genotypes are projections of intersections of winning genotypes planes to the two-dimensional space. A computer program solves this question by dividing the space of AMMI2 biplot in 100x100 fields (for example) and defining each field as a hypothetical environment as well as by counting AMMI expected grain yield of the investigated hybrids. On the basis of the winning genotypes, the space of IPCA1-IPCA2 of biplot is divided into the polygon areas, target environments.
Table 2. Expected yield of hybrids in target environments 1, 2 and 3.
Target environment 1
Expected yield of ZP-677
Target environment 2
Expected yield of ZP- 570
Target environment 3
Expected yield of ZP-732 Z. Polje irr. 1 14.489 Z. Polje dlf 2 6.436 Bečej 1 16.768 Z. Polje dlf 1 14.041 Pančevo 2 7.336 Bečej 2 14.320 Bijeljina 1 10.069 Žarkovci 2 6.199
Pančevo 1 11.643 Adaševci 2 6.648 S.Mitrovica 1 8.114
Z. Polje irr. 2 13.210 Irrigated-irr.; dryland farming-dlf.
geographical sense (north-central part of Vojvodina region) and can be considered as agroecologically specific one.
Regarding the recommendation for growing of particular maize hybrid, the location is of particular interest, not combination year by location. On the basis of the presented investigation it is possible to give a clear recommendation for the location of Bečej and the hybrid ZP 732 (13), as the top yielding. For locations Z. Polje and Pančevo, we recommend the hybrid ZP 677 (9) for years with enough precipitation or irrigation provided. For dry years with no irrigation provided, better results would be achieved with ZP 570 (6). The hybrid ZP 704 (15), having at the same time the above average grain yield and the lowest interaction, also can be recommended for the cases when it is more important to obtain stabile grain yield over years rather than maximum grain yield. This is a typical situation for small scaled farmers in Serbia. It is also clear that the location of Bečej should be used as a test location, primarily for late maturity maize hybrids (FAO 600-700), and this location should be kept in a case of test location network reduction.
Conclusion
A yield trial with many genotypes and environments generates multivariate data with high dimensionality, but ordinarily the main causal factors affecting yield are rather few. The pattern in AMMI biplot often reflects casual factors like rainfall and length of the growing season, even though the data literally concern something else, yield. The greatest benefit of the AMMI analysis application is better understanding of genotypes, environments and the complex of their interactions. The hybrids ZP-677, ZP-570 and ZP-732 were distinguished as carriers of maximum yields in the observed region. By their interaction response twelve environments were classified into three target environments. The hybrid ZP 704, having at the same time above average grain yield and the lowest interaction can be widely recommended.
References
Badu-Apraku, B., Abramu, F.J., Menkir, A., Fakorede, M.A.B., Obeng-Antwi, K., The, C. (2003): Genotype by environment interactions in the regional early maize variety trials in west and central Africa. Maydica 48:93-104.
Crossa, J. (1990): Statistical analyses of multilocation trials. Advances in Agron. 44:55-85.
Ebdon, J.S., Gauch, H.G.Jr. (2002a): Additive main effect and multiplicative interaction analysis of national turfgrass performance trials. Crop Sci. 42:489-496.
Ebdon, J.S., Gauch, H.G.Jr. (2002b): Additive main effect and multiplicative interaction analysis of national turfgrass performance trials. Crop Sci. 42:497-506.
Gauch, H.G.Jr. (1992): Statistical analysis of regional yield trials: AMMI analysis of factorial designs. Elsevier science publishers B.V., Amsterdam, Netherlands.
Gauch, H.G.Jr. (1996): Documentation for AMMIWINS: AMMI winners. http://www.microcomputerpower.com/matmodel/ammiwins.
Gauch, H.G.Jr. (2006): Statistical analysis of yield trials by AMMI and GGE. Crop Sci. 46:1488-1500.
Gauch, H.G.Jr., Zobel, R.W. (1988): Predictive and postdictive success of statistical analyses of yield trials. TAG 76:1-10.
Gauch, H.G.Jr., Zobel, R.W. (1989): Accuracy and selection success in yield analyses. TAG 77:473-481.
Gauch, H.G.Jr., Zobel, R.W. (1997): Identifying mega-environments and targeting genotypes. Crop Sci. 37:311-326.
Gunjača, J. (2001):Interakcija genotip x okolina u nebalansiranim serijama pokusa. Doktorska teza, Sveučilište u Zagrebu, Hrvatska.
Gunjača, J., Knezović, Z., Pecina, M. (2007): Genotipe by environment interaction in variety trials. Cereal Research Commun. 35:425-428.
Kempton, R.A. (1984): The use of biplots in interpreting variety by environment ineractions. J. Agric. Sci., Cambridge 103:123-135.
M’Benga, M. (1989): The use of genotype x environment interactions to enhance maize (Zea mays L.) cultivar and test site selection in the eastern part of Gambia. M.S. Thesis. Cornell University, USA.
Moreno-Gonzalez, J., Crossa, J., Cornelius, P.L. (2003a): Additive main effects and multiplicative interaction model I. Crop Sci. 43:1967-1975.
Moreno-Gonzalez, J., Crossa J., Cornelius, P.L. (2003b): Additive main effects and multiplicative interaction model II. Crop Sci. 43:1976-1982.
SISTEMATSKA VARIJACIJA UNUTAR INTERAKCIJSKOG EFEKTA U SORTNOM OGLEDU KUKURUZA
Vojka B. Babić1*, Milosav M. Babić1, Mile R. Ivanović2 i
Milomir R. Filipović1
1
Institut za kukuruz, Slobodana Bajića 1, 11185 Beograd-Zemun, Srbija
2
Institut za ratarstvo i povrtarstvo, Maksima Gorkog 30, 21000 Novi Sad, Srbija
R e z i m e
Prilikom donošenja odluka koje se tiču razvoja sorti i identifikacije određenih rejona gajenja, samo je efekat genotipa (G) i interakcije genotipa sa spoljašnjom sredinom (GxE) relevantan. Iako glavni genotipski efekat i efekat interakcije treba razdvojiti, sa druge strane, postoji potreba za njihovim integrisanjem u prinosu jer oba istovremeno utiču na rang određenog genotipa u datoj sredini. AMMI analiza (Additive Main Effect and Multiplicative Interaction), koja predstavlja hibridni model, to omogućava. Koristeći AMMI2 model, koji je obuhvatio 98,4% sume kvadrata tretmana, 12 spoljašnjih sredina je grupisano u tri ciljne sredine. Od 15 ispitivanih hibrida kukuruza, tri hibrida su odabrana kao nosioci maksimalnih prinosa u tri ciljne sredine. Na taj način je prezentovano da se, i u relativno malom regionu, može iskoristiti uska prilagođenost genotipa, za postizanje visokih prinosa.
Ključne reči: AMMI, GxE interakcija, hibridi kukuruza, ciljna sredina.
Primljeno: 15. septembra 2011. Odobreno: 23. novembra 2011.