AMTD
7, 5533–5558, 2014A compact PTR-ToF-MS instrument for
airborne measurements
M. Müller et al.
Title Page
Abstract Introduction
Conclusions References
Tables Figures
◭ ◮
◭ ◮
Back Close
Full Screen / Esc
Printer-friendly Version Interactive Discussion
Discussion
P
a
per
|
Discus
sion
P
a
per
|
Discussion
P
a
per
|
Discussion
P
a
per
|
Atmos. Meas. Tech. Discuss., 7, 5533–5558, 2014 www.atmos-meas-tech-discuss.net/7/5533/2014/ doi:10.5194/amtd-7-5533-2014
© Author(s) 2014. CC Attribution 3.0 License.
This discussion paper is/has been under review for the journal Atmospheric Measurement Techniques (AMT). Please refer to the corresponding final paper in AMT if available.
A compact PTR-ToF-MS instrument for
airborne measurements of VOCs at high
spatio-temporal resolution
M. Müller1, T. Mikoviny2,3,5, S. Feil4, S. Haidacher4, G. Hanel4, E. Hartungen4, A. Jordan4, L. Märk4, P. Mutschlechner4, R. Schottkowsky4, P. Sulzer4, J. H. Crawford2, and A. Wisthaler1,5
1
Institut für Ionenphysik und Angewandte Physik, Universität Innsbruck, Innsbruck, Austria
2
Chemistry and Dynamics Branch, Science Directorate, NASA Langley Research Center, Hampton (VA), USA
3
Oak Ridge Associated Universities, Oak Ridge (TN), USA
4
Ionicon Analytik GmbH, Innsbruck, Austria
5
Department of Chemistry, University of Oslo, Oslo, Norway
Received: 5 May 2014 – Accepted: 6 May 2014 – Published: 5 June 2014 Correspondence to: A. Wisthaler ([email protected])
AMTD
7, 5533–5558, 2014A compact PTR-ToF-MS instrument for
airborne measurements
M. Müller et al.
Title Page
Abstract Introduction
Conclusions References
Tables Figures
◭ ◮
◭ ◮
Back Close
Full Screen / Esc
Printer-friendly Version Interactive Discussion
Discussion
P
a
per
|
Discus
sion
P
a
per
|
Discussion
P
a
per
|
Discussion
P
a
per
Abstract
Herein, we report on the development of a compact proton-transfer-reaction time-of-flight mass spectrometer for airborne measurements of volatile organic compounds (VOCs). The new instrument resolves isobaric ions with a mass resolving power (m/∆m) of∼1000, provides accuratem/zmeasurements (∆m <3 mDa), records full 5
mass spectra at 1 Hz and thus overcomes some of the major analytical deficiencies of quadrupole-MS based airborne instruments. 1 Hz detection limits for biogenic VOCs (isoprene,α-pinene), aromatic VOCs (benzene, toluene, xylenes) and ketones (ace-tone, methyl ethyl ketone) range from 0.05 to 0.12 ppbV, making the instrument well-suited for fast measurements in the continental boundary layer. The instrument detects 10
and quantifies VOCs in locally confined plumes (<1 km) which improves our capa-bility of characterizing emission sources and atmospheric processing within plumes. A deployment during the NASA 2013 DISCOVER-AQ mission generated high vertical and horizontal resolution in situ data of VOCs and ammonia for validation of satellite retrievals and chemistry transport models.
15
1 Introduction
Volatile organic compounds (VOCs) are ubiquitous in the Earth’s troposphere and many of them are intimately involved in HOx–NOx–O3chemistry and in secondary
or-ganic aerosol formation. VOCs potentially impact regional air quality and global climate which puts them among the key target species of many field measurement campaigns. 20
Airborne measurements of VOCs put a high demand on instrumental sensitivity and time response. VOC mixing ratios range from pptV (1 pptV=10−12v/v) levels in the up-per or remote atmosphere to double or even triple digit ppbV (1 ppbV=10−9v/v) levels in biomass burning or industrial plumes. Sampling from a jet aircraft at typical ground speeds of 100 to 200 m s−1 converts into a spatial resolution of 6 to 12 km for a 1 min 25
AMTD
7, 5533–5558, 2014A compact PTR-ToF-MS instrument for
airborne measurements
M. Müller et al.
Title Page
Abstract Introduction
Conclusions References
Tables Figures
◭ ◮
◭ ◮
Back Close
Full Screen / Esc
Printer-friendly Version Interactive Discussion
Discussion
P
a
per
|
Discus
sion
P
a
per
|
Discussion
P
a
per
|
Discussion
P
a
per
|
chromatograph (GC), collects 40 s integrated samples every 2 min; whole air sampling (WAS) grabs 1 min integrated samples into a pre-evacuated canister every 1–2 min dur-ing intensive sampldur-ing periods (Hornbrook et al., 2011; and references therein). This is often too low when operating over urban areas, in the proximity of point sources (e.g. forest or agricultural fires or industrial sources) and during extensive vertical profiling, 5
i.e. when it is essential to be able to resolve large gradients over very small distances. Higher frequency measurements of a large set of VOCs can only be achieved via direct chemical ionization mass spectrometry (CIMS). In direct CIMS, the sample is not sub-jected to time-intensive pre-concentration procedures and chromatographic separation but it is directly and continuously introduced into an ion-molecule reactor for ioniza-10
tion. Analyte-specific ions are then monitored at high time resolution (1–10 Hz) using a mass spectrometer (MS). Airborne direct CIMS was pioneered by F. Arnold’s group in the mid-1980ies (Arnold and Hauck, 1985) and was followed by a breakthrough in the form of proton-transfer-reaction mass spectrometry (PTR-MS) (Crutzen et al., 2000). In the past 16 years, PTR-MS instruments have been successfully deployed on a vari-15
ety of research aircraft and the reader is referred to the thorough review by De Gouw and Warneke (2007) and the references given therein. The PTR-MS instruments that were hitherto flown on research aircraft used quadrupole filters for mass analysis. The quadrupole mass spectrometer (QMS) is usually operated in the selected ion monitor-ing (SIM) mode, i.e. a series of pre-selectedm/z signals are sequentially measured 20
for 0.5 to 1.0 s. For 10 analytes, this transfers into an overall time resolution of 5 to 10 s which causes the PTR-MS to be slower than most 1 Hz airborne air pollution sensors (e.g. O3, NO, NO2, CO, CH4, etc.). A number of groups have used orthog-onal acceleration time-of-flight mass spectrometers (oa-TOF-MS) in combination with a glow-discharge drift tube ion source (Blake et al., 2004; Ennis et al., 2005; Tanimoto 25
AMTD
7, 5533–5558, 2014A compact PTR-ToF-MS instrument for
airborne measurements
M. Müller et al.
Title Page
Abstract Introduction
Conclusions References
Tables Figures
◭ ◮
◭ ◮
Back Close
Full Screen / Esc
Printer-friendly Version Interactive Discussion
Discussion
P
a
per
|
Discus
sion
P
a
per
|
Discussion
P
a
per
|
Discussion
P
a
per
with polluted air at the airport, etc.). Herein, we report on the development and perfor-mance of a compact proton-transfer-reaction time-of-flight mass spectrometer (PTR-ToF-MS) that has flown on the NASA P-3B Airborne Science Laboratory during the DISCOVER AQ mission (http://discover-aq.larc.nasa.gov). We show that the newly de-veloped instrument is capable of generating full mass scan information at 1 Hz and of 5
resolving a series of isobaric interferences known from conventional PTR-QMS stud-ies. Examples of field data are presented to demonstrate the analytical power of the new airborne PTR-ToF-MS instrument in characterizing point emissions of VOCs and in measuring vertical trace gas profiles at high spatial resolution.
2 Experimental
10
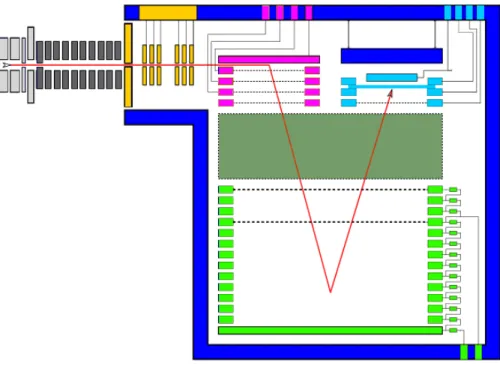
The new airborne PTR-ToF-MS instrument (Fig. 1) includes (i) a direct chemical ion-ization source (glow discharge–ion drift tube), (ii) ion transfer optics that deliver ions from the drift tube to the MS, (iii) a newly developed compact oa-TOF-MS for ion mass analysis, (iv) a vacuum system that reduces the pressure in the ion source and in the mass spectrometer, (v) a data acquisition system that records all instrument operation 15
parameters and the mass spectra, (vi) an aircraft inlet system that delivers outside air to the instrument in the aircraft cabin and (vii) an in-flight zeroing and calibration system. Each of these components are described in detail below.
2.1 Ion source
The instrument is equipped with the conventional glow discharge–drift tube ion source 20
housed in a thermostat-controlled (50◦C) enclosure. H3O+ ions generated in a glow
AMTD
7, 5533–5558, 2014A compact PTR-ToF-MS instrument for
airborne measurements
M. Müller et al.
Title Page
Abstract Introduction
Conclusions References
Tables Figures
◭ ◮
◭ ◮
Back Close
Full Screen / Esc
Printer-friendly Version Interactive Discussion
Discussion
P
a
per
|
Discus
sion
P
a
per
|
Discussion
P
a
per
|
Discussion
P
a
per
|
proton affinity than water are ionized via non-dissociative proton transfer reactions with the H3O+ ions. The yield of protonated analyte ions is linear for VOCs in their typical
atmospheric concentration range. The ionization method, its technical details and limi-tations, and its application for atmospheric VOC measurements have been thoroughly reviewed by De Gouw and Warneke (2007).
5
2.2 Ion transfer lenses
The ion transfer optics guide the ions from the ion-molecule reactor to the orthogonal extraction region of the MS and consist of a drift tube extraction lens and two einzel lens stacks for ion beam transfer and focusing. The first lens following the drift tube extraction lens acts as a skimmer lens. The total voltage gradient across the ion transfer 10
lens system is about 40 V.
2.3 oa-ToF-MS
A conventionally designed compact oa-ToF-MS is used for mass analysis (Fig. 1). The multi-stage orthogonal ion accelerator consists of a pusher and 4 mesh electrodes (ref-erence, pull, grid and drift tube cage). Ions are typically extracted at 80 kHz with a max-15
imum extraction frequency of 120 kHz. After V-shaped reflection in a double stage ion mirror the ions are post-accelerated before impinging on a multichannel plate (MCP) stack operated between 2000 and 2700 V. The extending dead time of the MCP is between 1.2 and 1.4 ns. The flight tube has a total length of 190 mm.
2.4 Vacuum system
20
Fine and high vacuum is maintained by three turbomolecular pumps coupled to the ion-molecule reactor (∼2 mbar), the ion transfer lens system (few 10−5mbar) and the oa-ToF-MS (<10−6mbar), respectively. A four-stage diaphragm pump backs the turbo pumps. The turbomolecular pumps and the oa-ToF-MS are spring mounted for shock and vibration isolation (Fig. 2).
AMTD
7, 5533–5558, 2014A compact PTR-ToF-MS instrument for
airborne measurements
M. Müller et al.
Title Page
Abstract Introduction
Conclusions References
Tables Figures
◭ ◮
◭ ◮
Back Close
Full Screen / Esc
Printer-friendly Version Interactive Discussion
Discussion
P
a
per
|
Discus
sion
P
a
per
|
Discussion
P
a
per
|
Discussion
P
a
per
2.5 Data acquisition system
The MCP signals are sent to a constant fraction discriminator (CFD) and a time-to-digital converter (TDC) with a minimum bin time of 27.43 ps. The used bin time is 219.48 ps. The non-extending dead time of the CFD-TDC system is 5.5 ns. At 80 kHz and a total acceleration voltage of 2300 V, the mass spectrum ranges from m/z 10 5
tom/z 214 containing 43 286 data bins. A Labview®-based data acquisition software generates time-of-flight mass spectra with customary spectral integration times ranging from 50 ms to 1 min. The mass spectra are displayed in real-time with several diagnostic options (zooming, averaging,m/z calibration, single peak fitting and mass resolution diagnosis). In addition, the time series of selected m/z signals can be displayed in 10
real time. The mass spectral data and all operational parameters of the instrument are saved into hdf5 files (The HDF Group, Hierarchical Data Format, version 5, 1997–2013; http://www.hdfgroup.org/HDF5/). The user defines the maximum length of the hdf5 files either by time or by number of spectra.
2.6 Inlet system
15
A 50 cm long inlet probe, mounted on a window plate, extends outside the boundary layer of the airplane. The outermost section of the winglet contains a heated copper block. A∼2 m long heated silanized stainless steel line extends from the inlet probe to the instrument rack. The inlet line temperature is set to 45◦C. The inlet line is directly coupled to a three-stage diaphragm pump (Vacuubrand GmbH & CO KG, Wertheim, 20
AMTD
7, 5533–5558, 2014A compact PTR-ToF-MS instrument for
airborne measurements
M. Müller et al.
Title Page
Abstract Introduction
Conclusions References
Tables Figures
◭ ◮
◭ ◮
Back Close
Full Screen / Esc
Printer-friendly Version Interactive Discussion
Discussion
P
a
per
|
Discus
sion
P
a
per
|
Discussion
P
a
per
|
Discussion
P
a
per
|
2.7 In-flight zeroing and calibration system
Outside air is sampled through a separate air inlet into a swing piston compressor (KNF Neuberger, Freiburg, Germany). The pressurized side of the compressor is main-tained at 1200 mbar using an electronic pressure controller (Bronkhorst High-Tech B.V., Ruurlo, NL). The compressor feeds a noble metal (Pt/Pd) catalyst (Parker Balston, 5
Haverhill, MA) maintained at a controlled temperature of 320◦C. The flow through the catalyst is controlled to 2 slpm using a downstream electronic flow controller (Horiba STEC, Kyoto, Japan). The catalyst efficiently destroys all VOC in the air without aff ect-ing the humidity levels of the matrix. For instrument zeroect-ing, this flow of VOC-free air is periodically backflushed via the main sampling inlet. Zeroing is carried out at dif-10
ferent altitude levels to determine the humidity dependence of the instrumental back-ground signals. For in-flight calibration, the flow of VOC-free air is spiked with∼5 ppbV of the target VOCs. Spiking is also carried out at different altitudes to characterize any humidity dependence of instrumental response factors. We use a certified 11-component VOC mixture (∼1 ppmV of methanol, acetonitrile, acetaldehyde, acetone, 15
isoprene, methyl ethyl ketone, benzene, toluene,m-xylene, 1,3,5-timethylbenzene,α -pinene; Apel Riemer Environmental Inc., Broomfield, CO, USA) for instrument calibra-tion. A small compressed gas cylinder (length: 513 mm, diameter: 133 mm) containing the VOC standard is placed in a thermostat-controlled (40◦C) enclosure. An electronic mass flow controller with a piezoelectric control valve (Horiba STEC, Kyoto, Japan) is 20
used to deliver a constant calibration gas flow of 10 sccm throughout the entire flight. A three-way valve is used to divert the calibration gas flow into the zero air flow or dis-card it into an exhaust line. A multi-point calibration in the 0–15 ppbV range is carried out on the ground before each flight. The accuracy of the mixing ratios in the standard and the accuracy of the calibration and dilution flows define the total accuracy of the 25
AMTD
7, 5533–5558, 2014A compact PTR-ToF-MS instrument for
airborne measurements
M. Müller et al.
Title Page
Abstract Introduction
Conclusions References
Tables Figures
◭ ◮
◭ ◮
Back Close
Full Screen / Esc
Printer-friendly Version Interactive Discussion
Discussion
P
a
per
|
Discus
sion
P
a
per
|
Discussion
P
a
per
|
Discussion
P
a
per
2.8 Post-flight data analysis
The PTR-TOF Data Analyzer software (https://sites.google.com/site/ptrtof/) is used for data analysis (Müller et al., 2013, and references therein). This software corrects ion count rates, accurately calibrates the mass axis, separates isobaric ions and lists the
m/zvalues of detected ions. It generates high time-resolved (0.1–1 s) data using the 5
stick spectra approach wherein signals are counted in dynamic m/z intervals and scaled to more accurate 1 min data. We use a non-extending dead time of 5.5 ns, an extending dead time of 1.2 ns, 1 min spectral averaging for cumulative peak analysis, and a residual analysis factor of 3 as input parameters. The intrinsic H3
18
O+, H3 18
O+ (H2O) and H318O+ (H2O)2 signals (m/z 21.022, m/z 39.033 and m/z 55.039) are 10
used for mass axis calibration and reference peak shape determination. The data are further processed using the PTR-TOF Data Plotter which is an analysis module in the PTR-TOF Data Analyzer toolbox. This software subtracts instrumental backgrounds and applies instrumental response factors. The final output is the time series of volume mixing ratios of selected VOCs.
15
3 Results
3.1 Sensitivity, detection limit, precision
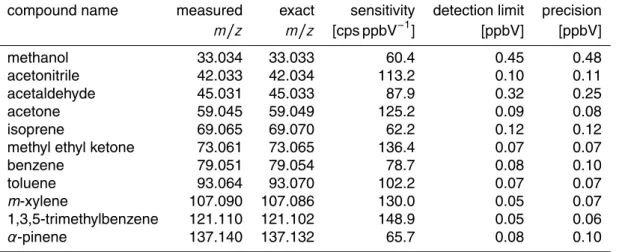
Table 1 summarizes the typical performance characteristics obtained from a calibra-tion with the diluted 11-component VOC mixture. Instrument sensitivities range from 60.4 cps ppbV−1 for methanol to 148.9 cps ppbV−1 for 1,3,5-trimethylbenzene. 2σ de-20
AMTD
7, 5533–5558, 2014A compact PTR-ToF-MS instrument for
airborne measurements
M. Müller et al.
Title Page
Abstract Introduction
Conclusions References
Tables Figures
◭ ◮
◭ ◮
Back Close
Full Screen / Esc
Printer-friendly Version Interactive Discussion
Discussion
P
a
per
|
Discus
sion
P
a
per
|
Discussion
P
a
per
|
Discussion
P
a
per
|
is, however, low for signals with m/z >70 and detection limits are generally below 0.1 ppbV. The 1σabsolute precision at 1 ppbV for 1 Hz data ranges from 0.06 ppbV for 1,3,5-trimethylbenzene to 0.48 ppbV for methanol. The 1σ relative precision at 10 ppb for 10 Hz data ranges from ±8 to ±16 % (data not included in the table). Figure 3 shows the calibration curves obtained for four aromatic VOCs (benzene, toluene,m -5
xylene, 1,3,5-trimethylbenzene), two biogenic hydrocarbons (isoprene,α-pinene) and four oxygenated compounds (methanol, acetaldehyde, acetone, methyl ethyl ketone). The achieved performance is sufficient to generate 1 Hz VOC data in the continental boundary layer. 10 Hz eddy covariant airborne flux measurements should be possible for selected species. In the remote boundary layer and the upper troposphere longer 10
signal integration times may be required.
3.2 Mass resolving power, mass accuracy
The typical mass resolving power (m/∆m) at full width half maximum (FWHM) for methanol and acetone is 900 and 1200, respectively. Although this is significantly lower than reported for Ionicon’s high-end PTR-TOF 8000 instrument, a series of im-15
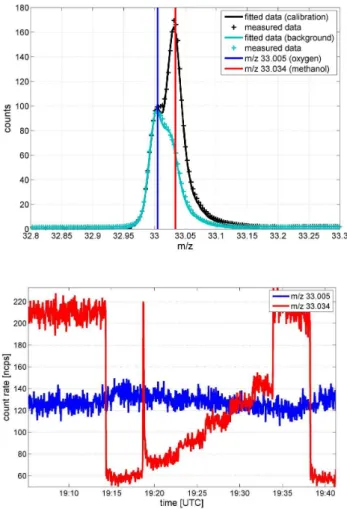
portant isobaric peaks can be resolved in post-analysis using the cumulative peak approach (Müller et al., 2011; Titzmann et al., 2010). We show this on the example of protonated methanol, CH5O+, with a calculated exact m/z of 33.033, and proto-nated molecular oxygen, HO+2, with a calculated exact m/z of 33.003. HO+2 ions are formed from endothermic proton transfer reactions during ion extraction into the high 20
vacuum region. The HO+2 abundance is humidity-dependent, which causes the instru-mental background of PTR-QMS systems atm/z 33 to vary with absolute humidity. Figure 4a depicts two 1 min average PTR-ToF-MS mass spectra aroundm/z33. The data obtained during instrument zeroing are shown as cyan crosses, the calibration data (10 ppbV of methanol) data are shown as black crosses. The corresponding color 25
AMTD
7, 5533–5558, 2014A compact PTR-ToF-MS instrument for
airborne measurements
M. Müller et al.
Title Page
Abstract Introduction
Conclusions References
Tables Figures
◭ ◮
◭ ◮
Back Close
Full Screen / Esc
Printer-friendly Version Interactive Discussion
Discussion
P
a
per
|
Discus
sion
P
a
per
|
Discussion
P
a
per
|
Discussion
P
a
per
in red). These results demonstrate that two isobaric peaks atm/z33 are well resolved and accurately positioned (∆m≤1.0 mDa) even with a relatively low mass resolving power of 900. Figure 4b shows the 1 Hz time series of the two isobaric signals ob-tained during a multi-step calibration. Supplied methanol volume mixing ratios were 10, 0, 1, 2, 3, 4, 5 and 10 ppbV, respectively. The methanol spike between 0 and 1 ppbV 5
occurred when a valve was manually opened. This time series demonstrates that the HO+2 signal is not affected by any short- or long-term variation in the CH5O+ signal. Data analysis with the PTR-TOF Data Analyzer software reliably resolves the two iso-baric signals. An analogous argumentation can be made for protonated carbon dioxide, CHO+2, with a calculated exactm/zof 44.997 and protonated acetaldehyde, C2H5O+, 10
with a calculated exactm/zof 45.033.
The new airborne PTR-ToF-MS does not only resolve organic ions from their inor-ganic isobars. An important pair of resolvable orinor-ganic isobars consists of protonated formic acid, CH3O+2, with a calculated exact m/z of 47.013, and protonated ethanol,
C2H7O+, with a calculated exact m/z of 47.049. The differentiation between
proto-15
nated isoprene, C5H+9, with a calculated exact m/z of 69.070 and protonated furan, C4H5O+, with a calculated exactm/zof 69.033, is of particular interest to the PTR-MS
community. Furan is known to be emitted from biomass burning which complicates the interpretation of the PTR-QMSm/z69 signal in fire plumes. Figure 5a shows a 1 min average PTR-ToF-MS mass spectrum aroundm/z69 obtained on 29 September 2013, 20
when the NASA P-3B overflew an agricultural crop residue fire near Dublin, GA, USA. Two distinct peaks are observed, a dominating peak centered atm/z69.034 which cor-responds to C4H5O+ (protonated furan) and a smaller C5H+9 peak atm/z 69.070 on
its right shoulder corresponding to protonated isoprene and isomers (e.g. pentadienes or methylbutadienes). The 1 min time series of the two isobaric signals recorded dur-25
AMTD
7, 5533–5558, 2014A compact PTR-ToF-MS instrument for
airborne measurements
M. Müller et al.
Title Page
Abstract Introduction
Conclusions References
Tables Figures
◭ ◮
◭ ◮
Back Close
Full Screen / Esc
Printer-friendly Version Interactive Discussion
Discussion
P
a
per
|
Discus
sion
P
a
per
|
Discussion
P
a
per
|
Discussion
P
a
per
|
The given examples have already demonstrated the excellent absolute mass ac-curacy of the measurements in the lower mass range, i.e. where the mass axis is calibrated using the intrinsicm/z 21.022, 39.033 and 55.039 signals. For VOCs with a higherm/zvalue, e.g.α-pinene with a calculated exactm/zof 137.132, the absolute mass accuracy is lower (8.0 mDa in the case ofα-pinene). The addition of an external 5
mass calibrant withm/z >100 would significantly improve the accuracy of measured
m/z’s for higher molecular weight ions. We also find that the measured accuratem/zis highly reproducible with 2σvariations in the range between 0.5 mDa and 2 mDa (3 mDa for methanol). We conclude that the new airborne PTR-ToF-MS instrument, which was originally conceived for nominal mass analysis only, performed unexpectedly well in 10
resolving isobaric peaks and measuring accuratem/zvalues.
3.3 Field data
The high time resolution PTR-ToF-MS data are particularly useful for determining
∆VOC/∆CO (or ∆VOC/∆CO2) emission ratios from point sources (e.g. from forest
or agricultural fires, industrial and traffic sources) or enhancement ratios in pollution 15
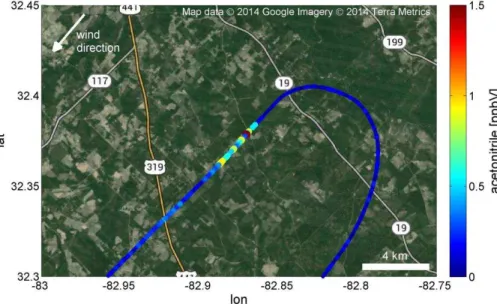
plumes. This is particularly true for small-scale plumes (<1 km) which are not resolv-able with slower analytical techniques including PTR-QMS. Figure 6 shows the geo-graphic extension of the crop residue fire plume intercepted near Dublin, GA, USA on 29 September 2013. Enhanced acetonitrile concentrations (>200 pptV) are observed over a flight path of 4.5 km. CO data are typically recorded at 1 Hz which results in 20
about 40 data points within the plume. The new PTR-ToF-MS instrument provides VOC data at the same rate, which allows deriving emission or enhancement ratios for both identified compounds and unidentified m/z signals. Since CO data are not yet available for this flight, we use acetonitrile as our reference compound to derive two emission ratios as ∆X/∆CH3CN from the scatter plot shown as Fig. 7. We find 25
AMTD
7, 5533–5558, 2014A compact PTR-ToF-MS instrument for
airborne measurements
M. Müller et al.
Title Page
Abstract Introduction
Conclusions References
Tables Figures
◭ ◮
◭ ◮
Back Close
Full Screen / Esc
Printer-friendly Version Interactive Discussion
Discussion
P
a
per
|
Discus
sion
P
a
per
|
Discussion
P
a
per
|
Discussion
P
a
per
this paper to put these results in a broader scientific context. These data are shown to demonstrate that even a 40 s (or less) plume transect is sufficient to derive VOC emission or enhancement ratios and to correlate PTR-ToF-MS signals to data from any other fast air pollutant sensor.
Figure 8 shows all enhancedm/zsignals in the agricultural fire plume. Them/z sig-5
nals that are usually monitored by conventional PTR-QMS are highlighted in dark grey. It becomes immediately evident that conventional PTR-QMS measurements only ac-count for a fraction of the emitted organic mass and that more research needs to be done to identify the remaining signals. The use of PTR-ToF-MS supersedes the need for pre-selecting the signals to be monitored which is an important prerequisite for gen-10
erating new scientific knowledge.
Figure 9a shows data from an urban overflight on 21 January 2013 over Bakersfield, CA, USA. Elevated toluene concentrations are seen east of Highway 99 (Golden State Highway) and in the vicinity of Bakersfield Municipal Airport. The corresponding time series is shown in Fig. 9b. Two toluene spikes are visible at 21:23:55 UTC (highway) 15
and 21:24:50 UTC (airport). Notably, elevated C8-alkylbenzene and benzene levels are
only seen from the traffic source and not over the airport. The toluene-to-benzene ratio derived from a bivariate regression analysis of the 5 s traffic emission spike is 4.0. These data are shown to exemplify the value of airborne PTR-ToF-MS measurements in identifying and characterizing point sources of VOCs in an urban environment. 20
Figure 10 shows vertical profiles of ammonia and 3 VOCs (methanol, formic acid and acetic acid) as obtained during the NASA DISCOVER-AQ mission in January and early February 2013 over Fresno, CA. We focus on these four species as they are currently also observable from space with the TES and IASI instruments and thus of interest to the satellite remote sensing community and to NASA. The 1 Hz ammonia data suffer 25
AMTD
7, 5533–5558, 2014A compact PTR-ToF-MS instrument for
airborne measurements
M. Müller et al.
Title Page
Abstract Introduction
Conclusions References
Tables Figures
◭ ◮
◭ ◮
Back Close
Full Screen / Esc
Printer-friendly Version Interactive Discussion
Discussion
P
a
per
|
Discus
sion
P
a
per
|
Discussion
P
a
per
|
Discussion
P
a
per
|
measured during 10 research flights over a period of 3 weeks. A single profile starting at 20:03:27 UTC on 22 January 2013 is shown in red. These data demonstrate the capability of the new airborne PTR-ToF-MS to generate high vertical resolution (down to 8 m) VOC data for validation of satellite retrievals and chemistry transport models. All PTR-ToF-MS data are publicly available at the NASA LaRC Airborne Science Data 5
Center for Atmospheric Composition (http://www-air.larc.nasa.gov/index.html).
4 Conclusion
An airborne PTR-ToF-MS instrument for high spatio-temporal VOC measurements (1 Hz, 110 m horizontal, 8 m vertical) has been successfully developed and deployed. 2σ-detection limits range from tens to hundreds of pptV, which makes the instrument 10
well suited for 1 Hz VOC measurements in the continental boundary layer. The new instrument resolves isobaric ions, provides accuratem/zmeasurements and records full mass spectra at 1 Hz which constitutes a significant improvement over conventional airborne PTR-QMS measurements. VOC sources are detectable and quantifiable even if the resulting plumes are spatially constrained to less than 1 km. Deployment of the 15
new instrument during the NASA DISCOVER-AQ mission generated vertical profile data of VOCs and NH3for satellite retrievals and chemistry transport model validation.
Future deployments may include airborne eddy-covariant flux measurements of VOCs.
Acknowledgements. The development of the PTR-ToF-MS was funded through the Austrian Space Applications Programme (ASAP 8, #833451). ASAP is sponsored by the Austrian
Min-20
istry for Transport, Innovation and Technology (BMVIT) and administered by the Aeronautics and Space Agency (ALR) of the Austrian Research Promotion Agency (FFG). Tomas Mikoviny was funded through the NASA Postdoctoral Program which is administered for NASA by Oak Ridge Associated Universities (ORAU). DISCOVER-AQ is part of the NASA Earth Venture-1 (EV-1) program.
AMTD
7, 5533–5558, 2014A compact PTR-ToF-MS instrument for
airborne measurements
M. Müller et al.
Title Page
Abstract Introduction
Conclusions References
Tables Figures
◭ ◮
◭ ◮
Back Close
Full Screen / Esc
Printer-friendly Version Interactive Discussion
Discussion
P
a
per
|
Discus
sion
P
a
per
|
Discussion
P
a
per
|
Discussion
P
a
per
References
Arnold, F. and Hauck, G.: Lower stratosphere trace gas detection using aircraft-borne ac-tive chemical ionization mass spectrometry, Nature, 315, 307–309, doi:10.1038/315307a0, 1985.
Blake, R. S., Whyte, C., Hughes, C. O., Ellis, A. M., and Monks, P. S.: Demonstration of
proton-5
transfer reaction time-of-flight mass spectrometry for real-time analysis of trace volatile or-ganic compounds, Anal. Chem., 76, 3841–3845, doi:10.1021/ac0498260, 2004.
Crutzen, P. J., Williams, J., Pöschl, U., Hoor, P., Fischer, H., Warneke, C., Holzinger, R., Hansel, A., Lindinger, W., Scheeren, B., and Lelieveld, J.: High spatial and temporal resolu-tion measurements of primary organics and their oxidaresolu-tion products over the tropical forests
10
of Surinam, Atmos. Environ., 34, 1161–1165, doi:10.1016/S1352-2310(99)00482-3, 2000. Ennis, C. J., Reynolds, J. C., Keely, B. J., and Carpenter, L. J.: A hollow cathode proton
transfer reaction time of flight mass spectrometer, Int. J. Mass Spectrom., 247, 72–80, doi:10.1016/j.ijms.2005.09.008, 2005.
De Gouw, J. and Warneke, C.: Measurements of volatile organic compounds in the Earth’s
15
atmosphere using proton-transfer-reaction mass spectrometry, Mass Spectrom. Rev., 26, 223–257, doi:10.1002/mas.20119, 2007.
Graus, M., Müller, M., and Hansel, A.: High resolution PTR-TOF: quantification and for-mula confirmation of VOC in real time, J. Am. Soc. Mass Spectr., 21, 1037–1044, doi:10.1016/j.jasms.2010.02.006, 2010.
20
Hornbrook, R. S., Blake, D. R., Diskin, G. S., Fried, A., Fuelberg, H. E., Meinardi, S., Mikoviny, T., Richter, D., Sachse, G. W., Vay, S. A., Walega, J., Weibring, P., Weinheimer, A. J., Wied-inmyer, C., Wisthaler, A., Hills, A., Riemer, D. D., and Apel, E. C.: Observations of non-methane organic compounds during ARCTAS – Part 1: Biomass burning emissions and plume enhancements, Atmos. Chem. Phys., 11, 11103–11130,
doi:10.5194/acp-11-11103-25
2011, 2011.
Jordan, A., Haidacher, S., Hanel, G., Hartungen, E., Märk, L., Seehauser, H., Schottkowsky, R., Sulzer, P., and Märk, T. D.: A high resolution and high sensitivity proton-transfer-reaction time-of-flight mass spectrometer (PTR-TOF-MS), Int. J. Mass Spectrom., 286, 122–128, doi:10.1016/j.ijms.2009.07.005, 2009.
AMTD
7, 5533–5558, 2014A compact PTR-ToF-MS instrument for
airborne measurements
M. Müller et al.
Title Page
Abstract Introduction
Conclusions References
Tables Figures
◭ ◮
◭ ◮
Back Close
Full Screen / Esc
Printer-friendly Version Interactive Discussion
Discussion
P
a
per
|
Discus
sion
P
a
per
|
Discussion
P
a
per
|
Discussion
P
a
per
|
Müller, M., George, C., and D’Anna, B.: Enhanced spectral analysis of C-TOF aerosol mass spectrometer data: iterative residual analysis and cumulative peak fitting, Int. J. Mass Spec-trom., 306, 1–8, doi:10.1016/j.ijms.2011.04.007, 2011.
Müller, M., Mikoviny, T., Jud, W., D’Anna, B., and Wisthaler, A.: A new software tool for the analysis of high resolution PTR-TOF mass spectra, Chemometr. Intell. Lab., 127, 158–165,
5
doi:10.1016/j.chemolab.2013.06.011, 2013.
Tanimoto, H., Aoki, N., Inomata, S., Hirokawa, J., and Sadanaga, Y.: Development of a PTR-TOFMS instrument for real-time measurements of volatile organic compounds in air, Int. J. Mass Spectrom., 263, 1–11, doi:10.1016/j.ijms.2007.01.009, 2007.
Titzmann, T., Graus, M., Müller, M., Hansel, A., and Ostermann, A.: Improved peak analysis of
10
AMTD
7, 5533–5558, 2014A compact PTR-ToF-MS instrument for
airborne measurements
M. Müller et al.
Title Page
Abstract Introduction
Conclusions References
Tables Figures
◭ ◮
◭ ◮
Back Close
Full Screen / Esc
Printer-friendly Version Interactive Discussion
Discussion
P
a
per
|
Discus
sion
P
a
per
|
Discussion
P
a
per
|
Discussion
P
a
per
Table 1.1 Hz measurement performance results (measured accurate m/z, calculated exact m/z, instrumental sensitivity, 2σdetection limit and precision at 1 ppbV) for a set of 11 VOCs.
compound name measured exact sensitivity detection limit precision m/z m/z [cps ppbV−1
] [ppbV] [ppbV]
methanol 33.034 33.033 60.4 0.45 0.48
acetonitrile 42.033 42.034 113.2 0.10 0.11
acetaldehyde 45.031 45.033 87.9 0.32 0.25
acetone 59.045 59.049 125.2 0.09 0.08
isoprene 69.065 69.070 62.2 0.12 0.12
methyl ethyl ketone 73.061 73.065 136.4 0.07 0.07
benzene 79.051 79.054 78.7 0.08 0.10
toluene 93.064 93.070 102.2 0.07 0.07
m-xylene 107.090 107.086 130.0 0.05 0.07
1,3,5-trimethylbenzene 121.110 121.102 148.9 0.05 0.06
AMTD
7, 5533–5558, 2014A compact PTR-ToF-MS instrument for
airborne measurements
M. Müller et al.
Title Page
Abstract Introduction
Conclusions References
Tables Figures
◭ ◮
◭ ◮
Back Close
Full Screen / Esc
Printer-friendly Version Interactive Discussion
Discussion
P
a
per
|
Discus
sion
P
a
per
|
Discussion
P
a
per
|
Discussion
P
a
per
|
AMTD
7, 5533–5558, 2014A compact PTR-ToF-MS instrument for
airborne measurements
M. Müller et al.
Title Page
Abstract Introduction
Conclusions References
Tables Figures
◭ ◮
◭ ◮
Back Close
Full Screen / Esc
Printer-friendly Version Interactive Discussion
Discussion
P
a
per
|
Discus
sion
P
a
per
|
Discussion
P
a
per
|
Discussion
P
a
per
|
’s
AMTD
7, 5533–5558, 2014A compact PTR-ToF-MS instrument for
airborne measurements
M. Müller et al.
Title Page
Abstract Introduction
Conclusions References
Tables Figures
◭ ◮
◭ ◮
Back Close
Full Screen / Esc
Printer-friendly Version Interactive Discussion
Discussion
P
a
per
|
Discus
sion
P
a
per
|
Discussion
P
a
per
|
Discussion
P
a
per
|
AMTD
7, 5533–5558, 2014A compact PTR-ToF-MS instrument for
airborne measurements
M. Müller et al.
Title Page
Abstract Introduction
Conclusions References
Tables Figures
◭ ◮
◭ ◮
Back Close
Full Screen / Esc
Printer-friendly Version Interactive Discussion
Discussion
P
a
per
|
Discus
sion
P
a
per
|
Discussion
P
a
per
|
Discussion
P
a
per
|
AMTD
7, 5533–5558, 2014A compact PTR-ToF-MS instrument for
airborne measurements
M. Müller et al.
Title Page
Abstract Introduction
Conclusions References
Tables Figures
◭ ◮
◭ ◮
Back Close
Full Screen / Esc
Printer-friendly Version Interactive Discussion
Discussion
P
a
per
|
Discus
sion
P
a
per
|
Discussion
P
a
per
|
Discussion
P
a
per
|
AMTD
7, 5533–5558, 2014A compact PTR-ToF-MS instrument for
airborne measurements
M. Müller et al.
Title Page
Abstract Introduction
Conclusions References
Tables Figures
◭ ◮
◭ ◮
Back Close
Full Screen / Esc
Printer-friendly Version Interactive Discussion
Discussion
P
a
per
|
Discus
sion
P
a
per
|
Discussion
P
a
per
|
Discussion
P
a
per