www.atmos-chem-phys.net/15/845/2015/ doi:10.5194/acp-15-845-2015
© Author(s) 2015. CC Attribution 3.0 License.
Characterization of biomass burning emissions from cooking fires,
peat, crop residue, and other fuels with high-resolution
proton-transfer-reaction time-of-flight mass spectrometry
C. E. Stockwell1, P. R. Veres2,3, J. Williams4, and R. J. Yokelson1
1University of Montana, Department of Chemistry, Missoula, MT, USA
2Cooperative Institute for Research in Environmental Sciences, University of Colorado, Boulder, CO, USA 3Chemical Sciences Division, Earth System Research Laboratory, National Oceanic and
Atmospheric Administration, Boulder, CO, USA
4Max Planck Institute for Chemistry, Atmospheric Chemistry Department, 55128 Mainz, Germany Correspondence to:R. J. Yokelson ([email protected])
Received: 23 July 2014 – Published in Atmos. Chem. Phys. Discuss.: 29 August 2014 Revised: 9 December 2014 – Accepted: 9 December 2014 – Published: 23 January 2015
Abstract. We deployed a high-resolution proton-transfer-reaction time-of-flight mass spectrometer (PTR-TOF-MS) to measure biomass-burning emissions from peat, crop residue, cooking fires, and many other fire types during the fourth Fire Lab at Missoula Experiment (FLAME-4) laboratory cam-paign. A combination of gas standard calibrations and com-position sensitive, mass-dependent calibration curves was applied to quantify gas-phase non-methane organic com-pounds (NMOCs) observed in the complex mixture of fire emissions. We used several approaches to assign the best identities to most major “exact masses”, including many high molecular mass species. Using these methods, approximately 80–96 % of the total NMOC mass detected by the PTR-TOF-MS and Fourier transform infrared (FTIR) spectroscopy was positively or tentatively identified for major fuel types. We report data for many rarely measured or previously unmea-sured emissions in several compound classes including aro-matic hydrocarbons, phenolic compounds, and furans; many of these are suspected secondary organic aerosol precursors. A large set of new emission factors (EFs) for a range of glob-ally significant biomass fuels is presented. Measurements show that oxygenated NMOCs accounted for the largest frac-tion of emissions of all compound classes. In a brief study of various traditional and advanced cooking methods, the EFs for these emissions groups were greatest for open three-stone cooking in comparison to their more advanced counter-parts. Several little-studied nitrogen-containing organic
com-pounds were detected from many fuel types, that together accounted for 0.1–8.7 % of the fuel nitrogen, and some may play a role in new particle formation.
1 Introduction
Biomass burning (BB) injects large amounts of primary, fine carbonaceous particles and trace gases into the global atmo-sphere and significantly impacts its physical and chemical properties (Crutzen and Andreae, 1990; Bond et al., 2004, 2013). While BB emissions are recognized as the second largest global atmospheric source of gas-phase non-methane organic compounds (NMOCs) after biogenic emissions, a significant portion of the higher molecular weight species remains unidentified (Christian et al., 2003; Warneke et al., 2011; Yokelson et al., 2013). It is widely accepted that the addition of large amounts of these highly reactive species into the atmosphere alters chemistry on local to global scales (Andreae and Merlet, 2001; Andreae et al., 2001; Karl et al., 2007). NMOCs particularly impact smoke evolution by rapid formation of secondary organic aerosols (SOA) and secondary gases including photochemical ozone (O3)(Reid et al., 1998; Trentmann et al., 2005; Alvarado and Prinn, 2009; Yokelson et al., 2009; Vakkari et al., 2014).
atmo-spheric impacts of fire at all scales (Trentmann et al., 2005; Mason et al., 2006; Alvarado and Prinn, 2009; Alvarado et al., 2009; Wiedinmyer et al., 2011). Estimating or modeling the potential of smoke photochemistry to generate secondary aerosols or O3 requires realistic estimates of NMOC
emis-sions in fresh smoke and knowledge of the chemical pro-cessing environment. Measurements capable of identifying and quantifying rarely measured and presently unidentified emissions of NMOCs, in particular the chemically complex low volatility fraction, are vital for advancing current under-standing of the BB impact on air quality and climate.
Proton-transfer-reaction time-of-flight mass spectrometry (PTR-TOF-MS) is an emerging technique that simultane-ously detects most NMOCs present in air samples, including oxygenated organics, aromatics, alkenes, and nitrogen (N)-containing species at parts per trillion detection limits (pptv) (Jordan et al., 2009; Graus et al., 2010). The instrument uses H3O+reagent ions to ionize NMOCs via proton transfer
re-actions to obtain high-resolution mass spectra of protonated NMOCs with a low degree of molecular fragmentation at a mass accuracy sufficient enough to determine molecular for-mulas (CwHxNyOz).
Although there are many advantages to PTR-TOF-MS over conventional PTR quadrupole mass spectrometers (in-creased mass range, high measurement frequency, and high mass resolution) there remain several difficulties involving PTR technology, including (1) detection being limited to molecules with a proton affinity greater than water, (2) com-plicated spectra due to parent ion fragmentation or cluster ion formation, and (3) the inability of the method to isolate iso-mers. Despite the limitations of this technology, PTR-TOF-MS is ideal for studying complex gaseous mixtures such as those present in BB smoke.
This study was carried out as part of a large-scale ex-periment to characterize the initial properties and aging of gas- and particle-phase emissions in smoke from globally significant fuels. Experiments were conducted from Octo-ber to NovemOcto-ber 2012 during the fourth Fire Lab at Mis-soula Experiment (FLAME-4) as detailed by Stockwell et al. (2014). A major goal of the study focused on the identifi-cation and quantifiidentifi-cation of highly reactive NMOCs in order to (1) better characterize the overall chemical and physical properties of fresh BB emissions; (2) better understand the distribution of emitted carbon across a range of volatilities in fresh and aged smoke; and (3) improve the capability of current photochemical models to simulate the climatic, ra-diative, chemical, and ecological impacts of smoke on local to global scales. In a companion paper, the FLAME-4 emis-sions were compared extensively to field measurements of fire emissions and were shown to be representative of “real-world” BB either as is or after straightforward adjustment procedures detailed therein (Stockwell et al., 2014). In this work, we describe the first application (to our knowledge) of PTR-TOF-MS technology to laboratory BB smoke to char-acterize emissions from a variety of authentic globally
sig-nificant fuels. We report on several new or rarely measured gases and present a large set of useful emission ratios (ERs) and emission factors (EFs) for major fuel types that can in-form/update current atmospheric models.
2 Experimental details
2.1 Missoula fire sciences laboratory
The US Forest Service Fire Sciences Laboratory (FSL) in Missoula, MT houses a large indoor combustion room de-scribed in detail elsewhere (Christian et al., 2003; Burling et al., 2010; Stockwell et al., 2014). In short, fuels are burned on a bed located directly below a 1.6 m diameter exhaust stack. The room is slightly pressurized by outdoor air that gener-ates a large flow, entraining the fire emissions up through the stack. Emissions are drawn into sampling lines fixed in the stack at a platform height 17 m above the fuel bed. Past studies demonstrated that temperature and mixing ratios are constant across the width of the stack at the platform height, confirming well-mixed emissions (Christian et al., 2004).
Burns were conducted using two separate configurations as described in Stockwell et al. (2014). In this paper we will focus on 125 of the 157 burns. During these fires, well-mixed fresh smoke was sampled directly from the combus-tion stack by PTR-TOF-MS roughly 5 s after emission. Re-sults obtained during the remaining burns that investigate photochemically processed smoke composition in dual smog chambers with a suite of state-of-the-art instrumentation are presented elsewhere (Tkacik et al., 2014).
2.2 Biomass fuels
Descriptions and ignition methods of each fuel type burned during FLAME-4 are detailed in Stockwell et al. (2014). Authentic globally significant fuels were collected, includ-ing African savanna grasses; US grasses; US and Asian crop residue; Indonesian, temperate, and boreal peat; temperate and boreal coniferous canopy fuels; woods in traditional and advanced cooking stoves; shredded tires; and trash. The range of fuel loading was chosen to simulate real-world con-ditions for the investigated fuel types with global examples of biomass consumption shown in Akagi et al. (2011). 2.3 Proton-transfer-reaction time-of-flight mass
spectrometer
Real-time analysis of NMOCs was performed using a com-mercial PTR-TOF-MS 8000 instrument from Ionicon Ana-lytik GmbH (Innsbruck, Austria) that is described in detail by Jordan et al. (2009). The PTR-TOF-MS sampled contin-uously at a frequency of 0.2 Hz through heated PEEK tubing (0.0003 m o.d., 80◦C) positioned facing upward to limit
and a typical mass range fromm/z10 to 600. The drift tube was operated at 600 V with a pressure of 2.3 mbar at 80◦C
(E/N∼136 Td, with E as the electric field strength and N as the concentration of neutral gas; 1 Td=10−17V cm2). A dynamic dilution system was set up to reduce the con-centration of sampled smoke and minimize reagent ion de-pletion. Mass calibration was performed by permeating 1,3-diiodobenzene (protonated parent mass atm/z330.85; frag-ments at m/z 203.94 and 204.94) into a 1 mm section of Teflon tubing used in the inlet flow system. The high mass ac-curacy of the data allowed for the determination of the atomic composition of protonated NMOC signals where peaks were clearly resolved. The post-acquisition data analysis to re-trieve counts per second based on peak analysis was per-formed according to procedures described in detail elsewhere (Müller et al., 2013, 2011, 2010). An initial selection of ions (∼68 masses up tom/z∼143) was chosen based upon in-cidence and abundance for post-acquisition analysis. In se-lect cases (nominally one fire of each fuel type), additional compounds (∼50 masses) were analyzed and are reported separately within this paper. A reasonable estimation proce-dure showed that the peaks selected for analysis accounted for > 99 % of the NMOC mass up tom/z 165 in our PTR-TOF-MS spectra. An earlier BB study (Yokelson et al., 2013) using mass scans tom/z214 found that∼1.5 % of NMOC mass was present atm/z> 165.
Calibration of the PTR-TOF-MS was performed every few days at the FSL using a bottle gas standard (Apel-Riemer Environmental). Calibrations were performed by adding a known quantity of calibration gas directly to the end of the PTR-TOF-MS sample inlet. The calibration mixture in-cluded formaldehyde (HCHO), methanol (CH3OH),
acetoni-trile (CH3CN), acetaldehyde (CH3CHO), acetone (C3H6O),
dimethyl sulfide (C2H6S), isoprene (C5H8), methyl vinyl
ketone (C4H6O), methyl ethyl ketone (C4H8O), benzene
(C6H6), toluene (C6H5CH3), p-xylene (C8H10),
1,3,5-trimethylbenzene (C9H12), andα-pinene (C10H16).
The normalized sensitivity of the instrument (ncps ppbv−1) was determined for calibrated compounds
based on the slope of the linear fit of signal intensities (normalized to the H3O+ signal, ∼106cps) versus a range of volumetric mixing ratios (VMR). Multipoint calibra-tion curves varied due to instrumental drift and dilucalibra-tion adjustments accordingly, and average calibration factors (CFs, ncps ppbv−1) were determined throughout the field
campaign as described by Warneke et al. (2011) and were used to calculate concentrations.
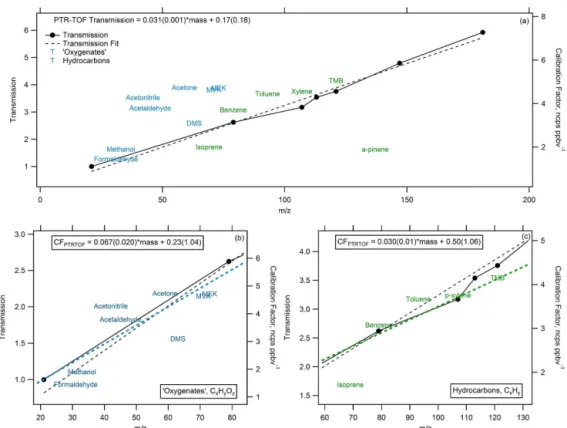
Quantification of the remaining species was performed us-ing calculated mass-dependent calibration factors based on the measured calibration factors. Figure 1a shows the spread in the normalized response of compounds versus mass (la-beled by compound name) overlaid with the linearly fitted mass-dependent transmission curve (black markers and dot-ted line). It is clear from Fig. 1a that the oxygenadot-ted species (blue labels) and the hydrocarbon species (green labels)
ex-hibit a slightly different mass-dependent behavior; however, both groups show a linear increase with mass that is similar to that observed for the transmission efficiency (Fig. 1b and c). To reduce bias, mass-dependent calibration factors were determined using a linear approximation for oxygenated and hydrocarbon species separately (Fig. 1b and c).α-Pinene was not included in the linear approximation for hydrocarbons as this compound is well known to be susceptible to substantial fragmentation in the drift tube. Sulfur (S)- and N-containing compounds were considered collectively, and together they more closely follow the trend of the oxygenated species. Thus, in cases where a compound contains a non-oxygen heteroatom (such as methanethiol), the mass-dependent cal-ibration factor was determined using the relationship estab-lished using the oxygenated species. Calibration factors were then determined according to the exact mass for all peaks where the chemical formula has been determined. Our ap-proach does not yet account for the potential for ions to frag-ment and/or cluster; however, we expect this impacts less than 30 % of NMOC and usually to a small degree for any individual species. These latter issues change the mass distri-bution of observed carbon but should not have a large effect on the total observed carbon.
It is difficult to assess the overall error introduced using this method of calibration factor approximation, as only a limited number of comparable measurements of calibration factors are available. The deviation of measured calibration factors for species contained in the gas standard from the lin-ear approximation yields a range of errors (21±19 %) with a maximum of 50 % observed in all cases (excludingα-pinene for reasons detailed above). While PTR-TOF-MS is typically known as a soft ionization method, fragmentation is common among higher molecular weight species and therefore needs to be considered as a limitation of this technique. For the in-dividual species identified it would be misleading to give a set error based on this limited analysis; however, in the ab-sence of any known molecular fragmentation, a maximum error of 50 % is prescribed although larger errors are possi-ble for compounds with N and S heteroatoms. Better meth-ods for the calculation of mass-dependent calibration factors by compound class should be developed in the near future to improve the accuracy of volatile organic compound (VOC) measurements using PTR-TOF-MS.
2.4 OP-FTIR
To enhance application of the MS data, emission ratios to carbon monoxide (CO) were calculated where possible using measurements from an open-path Fourier transform infrared (OP-FTIR) spectrometer described elsewhere (Stockwell et al., 2014). The system includes a Bruker Matrix-M IR cube spectrometer with an open White cell that was positioned to span the width of the stack to sample the continuously ris-ing emissions. The spectral resolution was set to 0.67 cm−1
Figure 1. (a)The normalized response of calibration factors (“CF,” ncps ppbv−1) versus mass (calibrated species labeled by name) overlaid with the linearly fitted mass-dependent transmission curve (black markers and dotted line). Separate linear approximations of(b)oxygenated (blue) and(c)hydrocarbon (green) species used to calculate approximate calibration factors for all observed masses where explicit calibra-tions were not available.
greater than 95 %. Other gas-phase species quantified by this method included carbon dioxide (CO2), methane (CH4),
ethyne (C2H2), ethene (C2H4), propylene (C3H6),
formalde-hyde (HCHO), formic acid (HCOOH), methanol (CH3OH),
acetic acid (CH3COOH), glycolaldehyde (C2H4O2), furan
(C4H4O), water (H2O), nitric oxide (NO), nitrogen
diox-ide (NO2), nitrous acid (HONO), ammonia (NH3), hydrogen
cyanide (HCN), hydrogen chloride (HCl), and sulfur dioxide (SO2)and were obtained by multi-component fits to selected regions of the mid-IR transmission spectra with a synthetic calibration non-linear least-squares method (Griffith, 1996; Yokelson et al., 2007).
The OP-FTIR system had the highest time resolution with no sampling line, storage, fragmentation, or clustering arti-facts; thus, for species in common with PTR-TOF-MS, the OP-FTIR data was used as the primary data. The results from the intercomparison (for methanol) of OP-FTIR and PTR-TOF-MS show excellent agreement using an orthogonal dis-tance regression to determine slope (0.995±0.008) and the R2coefficient (0.789). This result is consistent with the good
agreement for several species measured by both PTR-MS and OP-FTIR observed in numerous past studies of labora-tory BB emissions (Christian et al., 2004; Karl et al., 2007; Veres et al. 2010; Warneke et al., 2011).
2.5 Emission ratio and emission factor determination
Excess mixing ratios (denoted 1X for each species “X”) were calculated by applying an interpolated background cor-rection (determined from the pre- and post-fire concentra-tions). The molar emission ratio (ER) for each species “X” relative to CH3OH (1X/1CH3OH) is the ratio between
the integral of 1X over the entire fire and the integral of 1CH3OH over the entire fire. We selected CH3OH as the
species in common with the OP-FTIR to serve as an inter-nal standard for the calculation of the fire-integrated ERs of each species X to CO (Supplement Table S1). We do this by multiplying the MS-derived ER (1X/1CH3OH) by the
FTIR-derived ER (1CH3OH/1CO), which minimizes
er-ror due to occasional reagent ion depletion or the different sampling frequencies between instruments that would im-pact calculating1X to1CO directly. Several fires have been excluded from this calculation as data were either not col-lected by OP-FTIR and/or PTR-TOF-MS or, alternatively, methanol data could not be applied for the conversion be-cause (1) the mixing ratios remained below the detection limit or (2) methanol was used to assist ignition purposes during a few fires. In the case of the tire fires only, the lat-ter issue with CH3OH was circumvented by using HCOOH
dis-cussed in Sect. 2.3., ∼50 additional masses were analyzed for selected fires and the ERs (to CO) for these fires are in-cluded in the bottom panels of Table S1. The combined ERs to CO from the FTIR and PTR-TOF were then used to cal-culate emission factors (EFs, g kg−1 dry biomass burned)
by the carbon mass-balance method (CMB) based on the assumption that all of the burned carbon is volatilized and that all of the major carbon-containing species have been measured (Ward and Radke, 1993; Yokelson et al., 1996, 1999; Burling et al., 2010). EFs were previously calculated solely from FLAME-4 OP-FTIR data as described in Stock-well et al. (2014), and a new larger set of EFs, which in-cludes more carbon-containing species quantified by PTR-TOF-MS, is now shown in Supplement Table S2. With the additional carbon compounds quantified by PTR-TOF-MS, the EFs calculated by CMB decreased∼1–2 % for most ma-jor fuels with respect to the previous EFs reported in Stock-well et al. (2014). In the case of peat and sugar cane fires, the OP-FTIR-derived EFs are now reduced by a range of ∼2– 5 % and 3.5–7.5 %, respectively. Along with these small re-ductions, this work now provides EFs for many additional species that were unavailable in Stockwell et al. (2014). Fi-nally, the EFs reported in Supplement Table S3 were adjusted (when needed) according to procedures established in Stock-well et al. (2014) to improve laboratory representation of real-world BB emissions. This table contains the EF we rec-ommend other workers use and it appears in the Supplement only because of its large size. In addition to the comparisons considered in Stockwell et al. (2014), we find that our EFs in Table S3 are consistent (for the limited number of overlap species) with additional, recent field studies including Kudo et al. (2014) for Chinese crop residue fires and Geron and Hays (2013) for North Carolina (NC) peat fires.
Fire emissions are partially dependent on naturally chang-ing combustion processes. To estimate the relative amount of smoldering and flaming combustion that occurred over the course of each fire, the modified combustion efficiency (MCE) is calculated by (Yokelson et al., 1996)
MCE= 1CO2
1CO2+1CO=
1
1+1CO 1CO2
. (1)
Though flaming and smoldering combustion often occur si-multaneously, a higher MCE value (approaching 0.99) des-ignates relatively pure flaming combustion (more complete oxidation), a lower MCE (0.75–0.84) designates pure smol-dering combustion, and thus an MCE of ∼0.9 represents roughly equal amounts of flaming and smoldering. Each fire-integrated MCE is reported in Tables S1–S3.
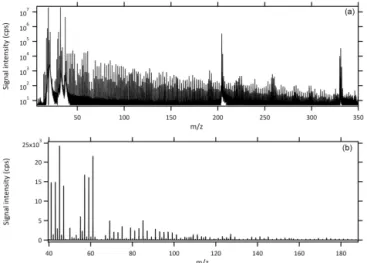
Figure 2.A typical full mass scan of biomass burning smoke from the PTR-TOF-MS on a logarithmic(a)and a smaller range linear (b)scale. The internal standard (1,3-diiodobenzene) accounts for the major peaks∼m/z331 and fragments at peaks nearm/z204 and 205.
3 Results
3.1 Peak assignment
As exemplified by a typical PTR-TOF-MS spectrum of di-luted smoke (Fig. 2a), the complexity of BB smoke emissions presents challenges to mass spectral interpretation and ulti-mately emissions characterization. Figure 2b shows a smaller mass range of the smoke sample shown in Fig. 2a on a lin-ear scale to illustrate the typical relative importance of the masses (note the intensity of acetaldehyde (m/z 45) and acetic acid plus glycolaldehyde (m/z61), which together ac-count for almost 25 % of the total signal). Although the spec-tra are very complex, systematic treatment of the burn data, assisted at somem/zby extensive published “off-line” anal-yses, can generate reasonable assignments for many major peaks and result in useful emissions quantification.
As described earlier, the PTR-TOF-MS scans have suf-ficiently high resolution to assign molecular formulas (CwHxNyOz) to specific ion peaks by matching the
identified species have, to our knowledge, typically not been directly observed in BB smoke but have been frequently ver-ified as major products with off-line techniques in the exten-sive literature describing biomass pyrolysis experiments of various fuel types (Liu et al., 2012; Pittman Jr. et al., 2012; Li et al., 2013; more citations in Table S4). Several tentative assignments are supported by off-line analyses being pub-lished elsewhere (Hatch et al., 2014); for example, simulta-neous grab samples analyzed by two-dimensional gas chro-matography (2D-GC) support tentative assignments for fu-ran methanol, salicylaldehyde, and benzofufu-ran. In the case of N-containing formulas, the suggested compounds have been observed in the atmosphere, tobacco smoke, or lab fire smoke at moderate levels (Lobert, 1991; Ge et al., 2011; etc). Se-lect studies supporting these assignments are referenced in the mass table with alternative possibilities also listed. An exhaustive list of all the many papers supporting the assign-ments is beyond the scope of this work. Several remaining compounds are also classified as tentative assignments as the identities designated are thought to be the most structurally likely. We anticipate that some or even many of the tentative assignments (and a few of the confirmed assignments) will be refined in future years as a result of more studies becom-ing available. We offer the tentative assignments here as a realistic starting point that improves model input compared to an approach in which these species are simply ignored. 3.2 Unidentified compounds
The identities of several compounds remain unknown, es-pecially at increasing mass where numerous structural and functional combinations are feasible. However, compared to earlier work at unit mass resolution (Warneke et al., 2011; Yokelson et al., 2013), the high-resolution capability of the PTR-TOF-MS has enhanced our ability to assign mass peaks while always identifying atomic composition. With unit mass resolution spectrometers, FTIR, and GC-MS grab samples, Yokelson et al. (2013) estimated that∼31 to 72 % of the gas-phase NMOC mass remained unidentified for several fuel types. For similar, commonly burned biomass fuels (cha-parral, grasses, crop residue, etc.), considering a PTR-TOF range up tom/z165, we estimate that∼7 % of the detected NMOC mass remains unidentified, while ∼12 % is tenta-tively assigned using selection criteria described in Sect. 3.1. The compounds considered in this study cover a smaller mass range (up tom/z165 rather thanm/z214) than in the earlier study, but in that earlier study the compounds in the range m/z 165–214 accounted for only ∼1.5 % of the NMOC mass (Yokelson et al., 2013). Thus, the molecular formula assignments from the PTR-TOF aided in positive and tenta-tive identification and quantification resulting in a reduction of the estimate of unidentified NMOCs from∼31 % down to ∼7 %.
Calculations of unidentified and tentatively assigned emis-sions relative to overall NMOC emisemis-sions (including FTIR
species) for several lumped fuel groups are summarized in Table 1. Estimates of total intermediate and semivolatile gas-phase organic compounds (IVOC+SVOC, estimated as the sum of species at or above the mass of toluene) are also in-cluded as these less volatile compounds are likely to gen-erate SOA via oxidation and/or cooling. Similar to previ-ous organic soil fire data, the percentages of unidentified and tentatively identified NMOCs for peat burns are signifi-cantly larger than for other fuel types (sum∼37 %), and they could be a major source of impacts and uncertainty during El Niño years when peat combustion is a major global emission source (Page et al., 2002; Akagi et al., 2011).
4 Discussion
For all fuel types, there is noticeable variability concerning which compounds have the most significant emissions. Fig-ure 3 includes both FTIR and PTR emissions grouped into the following categories: non-methane hydrocarbons, oxy-genates containing only one oxygen, oxyoxy-genates containing two oxygen atoms, and oxygenates containing three oxy-gen atoms. Within these categories, the contributions from aromatics, phenolic compounds, and furans are further in-dicated. As shown in Fig. 3, oxygenated compounds ac-count for the majority of the emissions for all biomass or biomass-containing fuels (i.e. tires and plastic bags are ex-cluded). Oxygenated compounds containing only a single oxygen atom accounted for∼50 % of the total raw mass sig-nal (>m/z28, excludingm/z37) on average and normally had greater emissions than oxygenated compounds contain-ing two oxygen atoms or hydrocarbons. Sugar cane has the highest emissions of oxygenated compounds, as was noted earlier in the FTIR data (Stockwell et al., 2014), and is one of the few fuels where the emissions of compounds con-taining two oxygens are the largest. To facilitate discussion we grouped many of the assigned (or tentatively assigned) mass peak features into categories including aromatic hy-drocarbons, phenolic compounds, furans, N-containing com-pounds, and S-containing compounds. These categories do not account for the majority of the emitted NMOC mass but do account for most of the rarely measured species reported in this work. We then also discuss miscellaneous compounds at increasingm/z.
4.1 Aromatic hydrocarbons
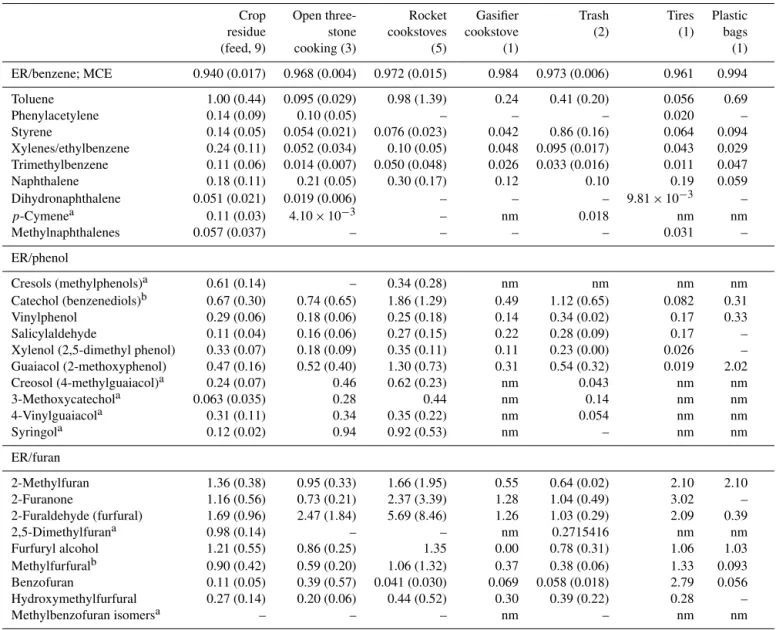
1,3,5-Table 1.Quantities for various categories of compounds (g kg−1) and calculation of mass ratios and/or percentages for several fuel types. Quantity or ratio Chaparral Coniferous Peat Grasses Cooking Crop Trash
canopy fires residue
6NMOCs 13.1 23.9 40.5 5.17 8.16 29.6 7.13 6I/SVOCs∗ 3.49 7.13 14.6 1.38 1.33 7.21 1.83 6tentatively assigned NMOCs 1.43 2.77 7.01 0.72 0.72 4.38 0.51 6unidentified NMOCs 1.23 1.79 7.50 0.39 0.33 2.10 0.41 6(I/SVOCs)/6NMOC 0.21 0.28 0.37 0.26 0.15 0.24 0.26 Percent NMOCs tentatively assigned 8.35 9.74 17.5 13.9 8.19 14.0 7.20 Percent NMOCs unidentified 7.24 6.75 19.5 7.19 3.77 6.90 5.75 Percent NMOCs tentatively+unidentified 16 16 37 21 12 21 13
∗See Sect. 3.2 for definition.
Figure 3.The emission factors (g kg−1)of total observed hydrocarbons and total observed species oxygenated to different degrees averaged for each fire type based on a synthesis of PTR-TOF-MS and OP-FTIR data. The patterned sections indicate the contribution to each of the above categories by selected functionalities discussed in the text (aromatic hydrocarbons, phenolics, furans). The parenthetical expressions indicate how many oxygen atoms are present.
trimethylbenzene (m/z 121), and naphthalene (m/z 129), while masses more tentatively assigned include dihydron-aphthalene (m/z 131), p-cymene (m/z 135), and methyl-naphthalenes (m/z 143). All masses are likely to have mi-nor contributions from other hydrocarbon species. The EFs for aromatic species quantified during all fires are averaged by fuel type and shown in Fig. 4a. The EF for p-cymene was only calculated for select burns and has been included in Fig. 4a for comprehensiveness.
Aromatic structures are susceptible to multiple oxidation pathways and readily drive complex chemical reactions in the atmosphere that are highly dependent on hydroxyl radi-cal (OH) reactivity (Phousongphouang and Arey, 2002; Zie-mann and Atkinson, 2012). Ultimately these gas-phase aro-matic species have high yields for SOA as their physical and chemical evolution lead to lower volatility species that con-dense into the particle phase. SOA yields from these
par-ent aromatic HCs have been shown to strongly vary depend-ing on environmental parameters includdepend-ing relative humidity, temperature, aerosol mass concentration, and particularly the level of nitrogen oxides (NOx) and availability of RO2
radi-cals, further adding to the complexity in modeling the behav-ior and fate of these compounds (Ng et al., 2007; Song et al., 2007; Henze et al., 2008; Chhabra et al., 2010, 2011; Im et al., 2014).
forma-Table 2a.Emission ratios to benzene, phenol, and furan for aromatic hydrocarbons, phenolic compounds, and substituted furans in lumped fuel categories.
Fuel Grasses Coniferous Chaparral Peat (6) Crop type (42) canopy (8) residue
(# burns) (14) (food, 19)
ER/benzene MCE 0.968 (0.010) 0.933 (0.032) 0.927 (0.017) 0.767 (0.074) 0.946 (0.022)
Toluene C7H8 0.44 (0.26) 2.19 (0.84) 0.49 (0.17) 0.53 (0.17) 0.70 (0.22) Phenylacetylene C8H6 0.094 (0.022) 0.13 0.067 (0.039) – 0.65 (0.45)
Styrene C8H8 0.078 (0.025) 0.11 (0.02) 0.074 (0.020) 0.087 (0.027) 0.10 (0.03) Xylenes/ethylbenzene C8H10 0.102 (0.058) 0.21 (0.03) 0.12 (0.03) 0.32 (0.16) 0.20 (0.08)
Trimethylbenzene C9H12 0.059 (0.045) 0.11 (0.03) 0.043 (0.023) 0.17 (0.08) 0.11 (0.05) Naphthalene C10H8 0.18 (0.16) 0.13 (0.05) 0.10 (0.03) 0.15 (0.09) 0.20 (0.17)
Dihydronaphthalene C10H10 0.040 (0.030) 0.034 (0.016) 0.020 (0.010) 0.050 (0.019) 0.059 (0.028) p-Cymenea C10H14 0.018 (0.013) 0.11 (0.01) 0.037 0.15 (0.12) 0.035 (0.019)
Methylnaphthalenes C11H10 0.032 (0.009) 0.053 (0.005) 0.033 (0.007) – 0.19 (0.09)
ER/phenol
Cresols (methylphenols)a C7H8O 0.52 (0.19) 0.55 (0.07) 0.49 0.29 (0.18) 0.57 (0.10)
Catechol (benzenediols)b C6H6O2 0.73 (0.41) 0.76 (0.29) 1.72 (1.28) 1.58 (1.03) 0.93 (0.45) Vinylphenol C8H8O 0.66 (0.19) 0.33 (0.09) 0.30 (0.05) 0.18 (0.05) 0.60 (0.35) Salicylaldehyde C7H6O2 0.18 (0.06) 0.17 (0.04) 0.15 (0.04) 0.20 (0.13) 0.18 (0.08) Xylenol (2,5-dimethyl phenol) C8H10O 0.25 (0.09) 0.19 (0.06) 0.11 (0.06) 0.31 (0.09) 0.34 (0.07)
Guaiacol (2-methoxyphenol) C7H8O2 0.40 (0.23) 0.42 (0.12) 0.21 (0.09) 0.71 (0.36) 0.76 (0.33) Creosol (4-methylguaiacol)a C8H10O2 0.21 (0.16) 0.21 (0.09) 0.067 0.12 (0.17) 0.19 (0.10)
3-Methoxycatechola C7H8O3 0.090 (0.072) 0.067 (0.031) 0.028 0.19 (0.04) 0.066 (0.037)
4-Vinylguaiacola C9H10O2 0.29 (0.19) 0.27 (0.12) 0.052 0.27 (0.04) 0.37 (0.19)
Syringola C8H10O3 0.13 (0.07) 0.078 (0.029) 0.21 (0.12) 0.22 (0.07) 0.16 (0.10)
ER/furan
2-Methylfuran C5H6O 0.53 (0.27) 1.02 (0.40) 0.77 (0.30) 0.34 (0.14) 1.50 (0.66) 2-Furanone C4H4O2 0.93 (0.50) 1.53 (0.80) 0.96 (0.49) 0.44 (0.36) 2.05 (1.09) 2-Furaldehyde (furfural) C5H4O2 1.61 (0.81) 1.82 (0.85) 1.35 (0.75) 1.34 (0.85) 2.78 (1.21) 2,5-Dimethylfurana C6H8O 0.27 (0.09) 0.58 (0.20) 0.615573 0.11 (0.01) 0.62 (0.77) Furfuryl alcohol C5H6O2 0.77 (0.49) 1.23 (0.57) 0.85 (0.44) 0.25 (0.21) 1.98 (1.21)
Methylfurfuralb C6H6O2 0.42 (0.24) 1.18 (0.89) 1.95 (1.49) 0.44 (0.35) 0.98 (0.52) Benzofuran C8H6O 0.059 (0.028) 0.11 (0.05) 0.10 (0.05) 0.017 (0.010) 0.10 (0.04)
Hydroxymethylfurfural C6H6O3 0.21 (0.16) 0.64 (0.43) 0.28 (0.19) 0.18 (0.14) 0.49 (0.35) Methylbenzofuran isomersa C9H8O 0.67 (0.58) – – – –
tion. An identical or similar approach that incorporates the additional aromatics detected by PTR-TOF-MS in this work may be useful to predict the contribution of aromatics from BB to global SOA by various reaction pathways.
Toluene, another major emission, often serves as a model compound to study the formation of SOA from other small ringed volatile organic compounds (Hildebrandt et al., 2009). Black spruce yielded the greatest toluene ER (to benzene) during FLAME-4 (3.24±0.42) and has been linked to sig-nificant OA enhancement during chamber photo-oxidation aging experiments investigating open BB emissions during FLAME-3, though toluene was not significant enough to ac-count for all of the observed SOA (Hennigan et al., 2011).
Naphthalene is the simplest species in a class of carcino-genic and neurotoxic compounds known as polycyclic
aro-matic hydrocarbons (PAH) and was detected from all fuels. The rapid rate of photo-oxidation of these smaller ringed gas-phase PAHs (including naphthalene and methylnaph-thalenes) can have important impacts on the amount and properties of SOA formed and yields significantly more SOA over shorter time spans in comparison to lighter aromatics (Chan et al., 2009). Under low-NOxconditions (BB events
generate NOx, though at lower ratios to NMOC and/or CO
than those present in urban environments) the SOA yield for benzene, toluene, andm-xylene was∼30 % (Ng et al., 2007), while naphthalene yielded enhancements as great as 73 % (Chan et al., 2009).
Table 2b.Continued.
Crop Open three- Rocket Gasifier Trash Tires Plastic residue stone cookstoves cookstove (2) (1) bags (feed, 9) cooking (3) (5) (1) (1)
ER/benzene; MCE 0.940 (0.017) 0.968 (0.004) 0.972 (0.015) 0.984 0.973 (0.006) 0.961 0.994 Toluene 1.00 (0.44) 0.095 (0.029) 0.98 (1.39) 0.24 0.41 (0.20) 0.056 0.69 Phenylacetylene 0.14 (0.09) 0.10 (0.05) – – – 0.020 – Styrene 0.14 (0.05) 0.054 (0.021) 0.076 (0.023) 0.042 0.86 (0.16) 0.064 0.094 Xylenes/ethylbenzene 0.24 (0.11) 0.052 (0.034) 0.10 (0.05) 0.048 0.095 (0.017) 0.043 0.029 Trimethylbenzene 0.11 (0.06) 0.014 (0.007) 0.050 (0.048) 0.026 0.033 (0.016) 0.011 0.047 Naphthalene 0.18 (0.11) 0.21 (0.05) 0.30 (0.17) 0.12 0.10 0.19 0.059 Dihydronaphthalene 0.051 (0.021) 0.019 (0.006) – – – 9.81×10⁻³ – p-Cymenea 0.11 (0.03) 4.10×10⁻³ – nm 0.018 nm nm Methylnaphthalenes 0.057 (0.037) – – – – 0.031 –
ER/phenol
Cresols (methylphenols)a 0.61 (0.14) – 0.34 (0.28) nm nm nm nm Catechol (benzenediols)b 0.67 (0.30) 0.74 (0.65) 1.86 (1.29) 0.49 1.12 (0.65) 0.082 0.31 Vinylphenol 0.29 (0.06) 0.18 (0.06) 0.25 (0.18) 0.14 0.34 (0.02) 0.17 0.33 Salicylaldehyde 0.11 (0.04) 0.16 (0.06) 0.27 (0.15) 0.22 0.28 (0.09) 0.17 – Xylenol (2,5-dimethyl phenol) 0.33 (0.07) 0.18 (0.09) 0.35 (0.11) 0.11 0.23 (0.00) 0.026 – Guaiacol (2-methoxyphenol) 0.47 (0.16) 0.52 (0.40) 1.30 (0.73) 0.31 0.54 (0.32) 0.019 2.02 Creosol (4-methylguaiacol)a 0.24 (0.07) 0.46 0.62 (0.23) nm 0.043 nm nm
3-Methoxycatechola 0.063 (0.035) 0.28 0.44 nm 0.14 nm nm 4-Vinylguaiacola 0.31 (0.11) 0.34 0.35 (0.22) nm 0.054 nm nm Syringola 0.12 (0.02) 0.94 0.92 (0.53) nm – nm nm
ER/furan
2-Methylfuran 1.36 (0.38) 0.95 (0.33) 1.66 (1.95) 0.55 0.64 (0.02) 2.10 2.10 2-Furanone 1.16 (0.56) 0.73 (0.21) 2.37 (3.39) 1.28 1.04 (0.49) 3.02 – 2-Furaldehyde (furfural) 1.69 (0.96) 2.47 (1.84) 5.69 (8.46) 1.26 1.03 (0.29) 2.09 0.39 2,5-Dimethylfurana 0.98 (0.14) – – nm 0.2715416 nm nm Furfuryl alcohol 1.21 (0.55) 0.86 (0.25) 1.35 0.00 0.78 (0.31) 1.06 1.03 Methylfurfuralb 0.90 (0.42) 0.59 (0.20) 1.06 (1.32) 0.37 0.38 (0.06) 1.33 0.093 Benzofuran 0.11 (0.05) 0.39 (0.57) 0.041 (0.030) 0.069 0.058 (0.018) 2.79 0.056 Hydroxymethylfurfural 0.27 (0.14) 0.20 (0.06) 0.44 (0.52) 0.30 0.39 (0.22) 0.28 – Methylbenzofuran isomersa – – – nm – nm nm
Note: “nm” indicates not measured; blank indicates species remained below the detection limits; values in parentheses indicate one standard deviation. aSpecies were only selected for a few key fires and are not considered the average of each fuel type.
bSignificant contributions from both methylfurfural and catechol were reported in pyrolysis reference papers, thus there is no indication which species is the major contributor at this mass.
al., 2006; Ng et al., 2007; Chan et al., 2009). We present here initial emissions for a variety of aromatics from major global fuels. A more focused study to probe the extent and significance of SOA formation in BB plumes by these aro-matic precursors was performed by chamber oxidation dur-ing the FLAME-4 campaign and will be presented in Tkacik et al. (2014).
4.2 Phenolic compounds
Phenol is detected atm/z95. Earlier studies burning a vari-ety of biomass fuels found that OP-FTIR measurements of phenol accounted for the observed PTR-MS signal at this mass even at unit mass resolution, though small
Figure 4. (a)The EFs of the aromatics analyzed in all fires aver-aged and shown by fuel type. Individual contributions from benzene and other aromatics are indicated by color. The EFs forp-cymene are only calculated for select fires and should not be considered a true average. (b)The correlation plots of selected aromatics with benzene during a black spruce fire (Fire 74). Similar behavior was observed for all other fuel types.
151), and syringol (m/z155). The EFs for these additional phenolic compounds were calculated for select burns and are included in Fig. 5a with the regularly analyzed compounds. Significant emissions of these compounds are reported in Ta-ble 2 relative to phenol, and the selected compounds shown in Fig. 5b demonstrate the tight correlation between these derivatives and phenol.
Phenol, methoxyphenols (guaiacols), dimethoxyphenols (syringol), and their derivatives are formed during the pyroly-sis of lignin (Simoneit et al., 1993) and can readily react with OH radicals leading to SOA formation (Coeur-Tourneur et al, 2010; Lauraguais et al., 2014). Hawthorne et al. (1989, 1992) found that phenols and guaiacols accounted for 21 and 45 % of aerosol mass from wood smoke, while Yee et al. (2013) noted large SOA yields for phenol (24–44 %), guaiacol (44–
Figure 5. (a)The distribution in average fuel EF for several phe-nolic compounds, where compound-specific contributions are in-dicated by color. The EFs for compounds additionally analyzed a single time for select fires are included but are not a true average. (b)The linear correlation of select phenolic compounds with phenol during an organic hay burn (Fire 119).
50 %), and syringol (25–37 %) by photo-oxidation chamber experiments under low-NOxconditions (<10 ppb).
Softwoods are considered lignin-rich and are associated predominately with guaiacyl units (Shafizadeh, 1982). Thus not surprisingly, guaiacol emissions were significant for pon-derosa pine. Peat, an accumulation of decomposing vegeta-tion (moss, herbaceous, woody materials), has varying de-grees of lignin content depending on the extent of decom-position, sampling depth, water table levels, etc. (Williams et al., 2003). The peat burns all emitted significant amounts of phenolic compounds, with noticeable compound-specific variability between regions (Indonesia, Canada, and North Carolina). It is also noteworthy that sugar cane, which also produced highly oxygenated emissions based on FTIR and PTR-TOF-MS results, had the greatest total emissions of phenolic compounds.
a potential reaction pathway for these compounds (Atkin-son et al., 1992; Olariu et al., 2002; Harri(Atkin-son et al., 2005; Lauraguais et al., 2014). Nitration of phenol in either the gas or aerosol phase is anticipated to account for a large portion of nitrophenols in the environment. Higher nitrophenol lev-els are correlated with increased plant damage (Hinkel et al., 1989; Natangelo et al., 1999) and consequently are linked to forest decline in central Europe and North America (Rip-pen et al., 1987). Nitrophenols are also important compo-nents of brown carbon and can contribute to SOA forma-tion in BB plumes (Kitanovski et al., 2012; Desyaterik et al., 2013; Mohr et al., 2013; Zhang et al., 2013). Nitrated phenols including nitroguaiacols and methyl-nitrocatechols are suggested as suitable BB molecular tracers for secondary BB aerosol considering their reactivity with atmospheric ox-idants is limited (Iinuma et al., 2010; Kitanovski et al., 2012; Lauraguais et al., 2014). The oxidation products from the phenolic compounds detected in fresh smoke here have not been directly examined and would require a more focused study beyond the scope of this paper.
As with the aromatic compounds, the ERs provided in Ta-ble 2 can be used to estimate initial BB emissions of pheno-lic species, both rarely measured or previously unmeasured, from a variety of fuels in order to improve atmospheric mod-eling of SOA and nitrophenol formation.
4.3 Furans
Other significant oxygenated compounds include furan and substituted furans which arise from the pyrolysis of cellulose and hemicellulose. The substituted furans regularly quan-tified included 2-methylfuran (m/z 83), 2-furanone (m/z 85), furfural (m/z97), furfuryl alcohol (m/z99), methylfur-fural (m/z111), benzofuran (m/z119), and hydroxymethyl-furfural (m/z 127), while 2,5-dimethylfuran (m/z 97) and methylbenzofurans (m/z133) were occasionally quantified. The ERs to furan for these compounds are summarized in Table 2, and Fig. 6a shows the average EF for the regularly quantified masses and the individual fire EFs for the occa-sionally quantified compounds.
Furan and substituted furans are oxidized in the atmo-sphere primarily by OH (Bierbach et al., 1995), but also by NO3 (Berndt et al., 1997) or Cl atoms (Cabañas et al.,
2005; Villanueva et al., 2007). Photo-oxidation of furan, 2-methylfuran, and 3-methylfuran produces butenedial, 4-oxo-2-pentenal, and 2-methylbutenedial (Bierbach et al 1994, 1995). These products are highly reactive and can lead to free radical (Wagner et al., 2003), SOA, or O3formation. In
fact, aerosol formation from photo-oxidation chamber exper-iments has been observed for furans and their reactive inter-mediates listed above (Gomez Alvarez et al., 2009; Strollo and Ziemann, 2013). Even less is known concerning SOA yields from furans with oxygenated functional groups, which comprise the majority of the furan emissions in this study. Alvarado and Prinn (2009) added reaction rates for furans
Figure 6. (a) The distribution in average fuel EF for furan and substituted furans, where individual contributions are indicated by color. The EFs for substituted furans additionally analyzed a single time are not true averages(b)The linear correlation of furan with select substituted furans for an African grass fire (Fire 49).
based on 2-methylfuran and butenedial values (Bierbach et al., 1994, 1995) to model O3formation in an aging savanna
smoke plume. Although a slight increase in O3was observed
after 60 min, it was not large enough to account for the ob-served O3 concentrations in the plume. The furan and
sub-stituted furan ERs compiled here may help explain a portion of the SOA and O3 produced from fires that cannot be
ac-counted for based upon previously implemented precursors (Grieshop et al., 2009).
fu-rans, the emissions of our substituted furans linearly corre-late with furan as shown in Fig. 6b. As noted for phenolic compounds, sugar cane produced the largest emissions of fu-rans excluding Canadian peat, supporting sugar cane as an important emitter of oxygenated compounds. The emissions from furan, phenol, and their derivatives reflect variability in cellulose and lignin composition of different fuel types. Cellulose and hemicellulose compose∼75 % of wood while lignin only accounts for∼25 % on average (Sjöström, 1993). Accordingly, the 6 furans/6 phenols for initially analyzed compounds indicate that furans are dominant in nearly every fuel type.
4.4 Nitrogen-containing compounds
Many N-containing peaks were not originally selected for post-acquisition analysis in every fire. However, the ad-ditional analysis of selected fires included a suite of N-containing organic compounds to investigate their potential contribution to the N budget and new particle formation (NPF). Even at our mass resolution of ∼5000, the mass peak from N compounds can sometimes be overlapped by broadened 13C “isotope” peaks of major carbon-containing emissions. This interference was not significant for the fol-lowing species that we were able to quantify in the standard or added analysis: C2H3N (acetonitrile, calibrated), C2H7N
(dimethylamine; ethylamine), C2H5NO (acetamide), C3H9N
(trimethylamine), C4H9NO (assorted amides), C4H11NO
(assorted amines), and C7H5N (benzonitrile). As illustrated
by the multiple possibilities for some formulas, several quan-tified N-containing species were observed but explicit sin-gle identities or relative contributions could not be con-firmed. The logical candidates we propose are based upon atmospheric observations and include classes of amines and amides shown in Table S4 (Lobert et al., 1991; Schade and Crutzen, 1995; Ma and Hays et al., 2008; Barnes et al., 2010; Ge et al., 2011). Additional N-containing compounds were clearly observed in the mass spectra such as acrylonitrile, propanenitrile, pyrrole, and pyridine, but they were often overlapped with isotopic peaks of major carbon compounds; thus a time-intensive analysis would be necessary to provide quantitative data. For the species in this category, quantifica-tion was possible for select fires by 2D-GC-MS and they are reported by Hatch et al. (2014) for the FLAME-4 campaign. We present in Supplement Table S5 the abundance of each N-containing gas quantified by PTR-TOF-MS and FTIR rel-ative to NH3for selected fires. The additional N-containing
organic gases detected by PTR-TOF-MS for these 29 fires summed to roughly 22±23 % of NH3 on average and ac-counted for a range of 0.1–8.7 % of the fuel N. These com-pounds contributed most significantly to fuel N for peat and this varied by sampling location. This is not surprising since environmental conditions and field sampling depths varied considerably. Stockwell et al. (2014) reported large differ-ences for N-containing compounds quantified by FTIR
be-tween FLAME-4 and earlier laboratory studies of emissions from peat burns. In any case, the additional NMOCs (includ-ing N-contain(includ-ing compounds) speciated by PTR-TOF-MS substantially increases the amount of information currently available on peat emissions.
The relevance of the N-containing organics to climate and the N cycle is briefly summarized next. Aerosol particles act-ing as cloud condensation nuclei (CCN) critically impact cli-mate by production and modification of clouds and precipita-tion (Novakov and Penner, 1993). NPF, the formaprecipita-tion of new stable nuclei, is suspected to be a major contributor to the amount of CCN in the atmosphere (Kerminen et al., 2005; Laaksonen et al., 2005; Sotiropoulou et al., 2006). Numer-ous studies have suggested that organic compounds contain-ing N can play an important role in the formation and growth of new particles (Smith et al., 2008; Kirkby et al., 2011; Yu and Luo, 2014). The primary pathways to new particle for-mation include (1) the reaction of organic compounds with each other or atmospheric oxidants to form higher molec-ular weight, lower volatility compounds that subsequently partition into the aerosol phase or (2) rapid acid/base re-actions forming organic salts. The observation of signifi-cant emissions of N-containing organic gases in FLAME-4 could improve understanding of the compounds, proper-ties, and source strengths contributing to new particle forma-tion and enhance model predicforma-tions on local to global scales. The identities and amounts of these additional N-containing emissions produced by peat and other BB fuels are also im-portant in rigorous analysis of the atmospheric N budget.
4.5 Sulfur, phosphorous, and chlorine-containing compounds
S emissions are important for their contribution to acid depo-sition and climate effects due to aerosol formation. Several S-containing gases have been detected in BB emissions includ-ing SO2, carbonyl sulfide (OCS), dimethyl sulfide (DMS),
and dimethyl disulfide (DMDS); DMS is one of the most sig-nificant organosulfur compounds emitted by BB and is quan-tified by PTR-TOF-MS in our primary data set (Friedli et al., 2001; Meinardi et al., 2003; Akagi et al., 2011; Simp-son et al., 2011). The signal atm/z49 had a significant mass defect and is attributed to methanethiol (methyl mercaptan, CH3SH), which to our knowledge has not been previously
reported in real-world BB smoke, though it has been ob-served in cigarette smoke (Dong et al., 2010) and in emis-sions from pulp and paper plants (Toda et al., 2010). Like DMS, the photochemical oxidation of CH3SH leads to SO2
formation (Shon and Kim, 2006), which can be further oxi-dized to sulfate or sulfuric acid and contribute to the aerosol phase. The emissions of CH3SH are dependent on the fuel S
content and are negatively correlated with MCE. The greatest EF (CH3SH) in our additional analyses arose from organic
and also produced significant emissions of SO2detected by
FTIR.
Other organic gases containing chlorine and phosphorous were expected to be readily detectable because of their large, unique mass defects and possible enhancement by pesticides and fertilizers in crop residue fuels. However, they were not detected in significant amounts by our full mass scans. Fuel P and Cl may have been emitted primarily as aerosol, ash, low proton affinity gases, or as a suite of gases that were evidently below our detection limit.
4.6 Miscellaneous (order of increasingm/z)
m/z41:
The assignment of propyne is reinforced by previous obser-vations in BB fires, and it is of some interest as a BB marker even though it has a relatively short lifetime of ∼2 days (Simpson et al., 2011; Akagi et al., 2013; Yokelson et al., 2013). Considering that propyne was not detected in every fuel type, a level of uncertainty is added to any use of this compound as a BB tracer, and in general the use of multiple tracers is preferred when possible.
m/z43:
The high-resolution capabilities of the PTR-TOF-MS al-lowed propylene to be distinguished from ketene fragments atm/z 43. The propylene concentrations are superseded in our present data set by FTIR measurements; however, the two techniques agree well.
m/z45:
PTR technology has already been reported as a reliable way to measure acetaldehyde in BB smoke (Holzinger et al., 1999; Christian et al., 2004). Photolysis of acetaldehyde can play an important role in radical formation and is the main precursor of peroxy acetyl nitrate (PAN) (Trentmann et al., 2003). A wide range in EF (acetaldehyde) (0.13–4.3 g kg−1)
is observed during FLAME-4 and reflects variability in fuel type. The detailed emissions from a range of fuels in this data set can aid in modeling and interpretation of PAN formation in aging BB plumes of various regions (Alvarado et al., 2010, 2013). Crop-residue fuels regularly had the greatest emis-sions of acetaldehyde, which is important considering many crop-residue fires evade detection and are considered both regionally and globally underestimated. Sugar cane burning had the largest acetaldehyde EF (4.3±1.4 g kg−1)and had significant emissions of oxygenated and N-containing com-pounds; consequently it is likely to form a significant amount of PAN.
m/z57:
The signal atm/z 57 using unit-mass resolution GC-PTR-MS was observed to be primarily acrolein with minor contri-butions from alkenes (Karl et al., 2007). In the PTR-TOF-MS, the two peaks at m/z 57 (C3H5O+ and C4H+9) are clearly distinguished and acrolein is often the dominant peak during the fire with the highest emissions from ponderosa pine and sugar cane.
m/z69:
The high resolution of the PTR-TOF-MS allowed three peaks to be distinguished at m/z 69, identities attributed to car-bon suboxide (C3O2), furan (C4H4O), and mostly isoprene
(C5H8)(Fig. 7). Distinguishing between isoprene and furan is an important capability of the PTR-TOF-MS. The atmo-spheric abundance and relevance of carbon suboxide is fairly uncertain and with an atmospheric lifetime of ∼10 days (Kessel et al., 2013), the reactivity and transport of C3O2
emitted by fires could have critical regional impacts. The emissions of C3O2by BB will be interpreted in detail at a
later date (S. Kessel, personal communication, 2014).
m/z75:
Hydroxyacetone emissions have been reported from both field and laboratory fires (Christian et al., 2003; Akagi et al., 2011; Yokelson et al., 2013; St. Clair et al., 2014). Christian et al. (2003) first reported BB emissions of hydroxyacetone and noted very large quantities from burning rice straw. The EF (C3H6O2)for rice straw was noticeably high (1.1 g kg−1)
in the FLAME-4 data set and only sugar cane had greater emissions.
m/z85, 87:
The largest peak atm/z85 was assigned as pentenone as it was monitored/confirmed by PIT-MS/GC-MS in an earlier BB study (Yokelson et al., 2013). Pentenone was a substan-tial emission from several fuels with ponderosa pine having the greatest EF. By similar evidence the minor peak atm/z 87 was assigned to pentanone but was only detected in a few of the fires in the second set of analyses with the most signif-icant emissions arising from Indonesian peat.
m/z107:
Benzaldehyde has the same unit mass as xylenes, but is clearly separated by the TOF-MS. Greenberg et al. (2006) observed benzaldehyde during low-temperature pyrolysis ex-periments with the greatest emissions from ponderosa nee-dles (ponderosa pine produced the greatest EF in our data set, with a range of 0.1–0.28 g kg−1). Benzaldehyde emissions
Figure 7.Expanded view of the PTR-TOF-MS spectrum atm/z69 demonstrating the advantage over unit mass resolution instruments of distinguishing multiple peaks, in this instance separating carbon suboxide (C3O2), furan (C4H4O), and mostly isoprene (C5H8)in ponderosa pine smoke (fire 70).
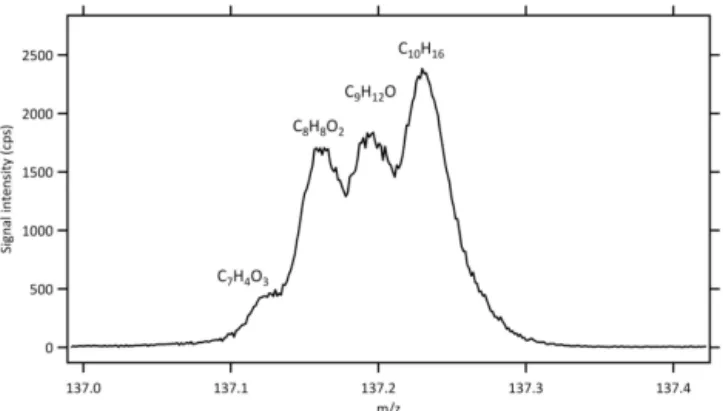
Figure 8.Expanded view of the PTR-TOF-MS spectrum of NC peat (fire 61) atm/z137 showing multiple peaks.
(Yokelson et al., 2013). During FLAME-4 the EF (benzalde-hyde) was comparable to EF (xylenes calibrated asp-xylene) as seen earlier, except for peat burns where xylenes were sig-nificantly higher.
m/z137:
At unit mass resolution, the peak at m/z137 is commonly recognized as monoterpenes, which can further be speciated by GC-MS. However, as shown in Fig. 8 there can be up to three additional peaks at this mass that presently remain unidentified oxygenated compounds. As anticipated, the hy-drocarbon monoterpene peak is significant for coniferous fu-els such as ponderosa pine but much smaller for grasses. In this work we calibrated for α-pinene, which has been re-ported as a major monoterpene emission from fresh smoke (Simpson et al., 2011; Akagi et al., 2013).
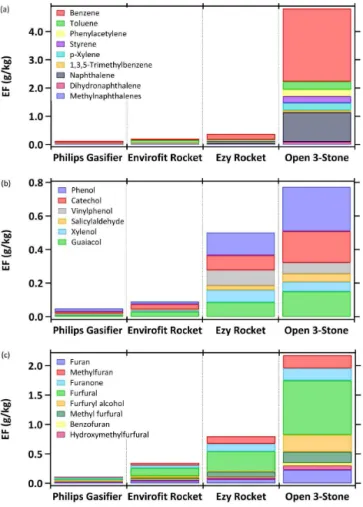
4.7 Cookstoves
Trace gas emissions were measured for four cookstoves including a traditional three-stone cooking fire, the most widely used stove design worldwide; two “rocket” type de-signs (Envirofit G3300 and Ezy stove); and a “gasifier” stove (Philips HD4012). Several studies focus on fuel efficiency of cookstove technology (Jetter et al., 2012), while the de-tailed emissions of many rarely measured and previously unmeasured gases are reported here and in Stockwell et al. (2014) for FLAME-4 burns. For cooking fires,∼3–6 % of the NMOC mass remained unidentified, with the Envirofit rocket stove design generating the smallest percentage in the study. To improve the representativeness of our laboratory open cooking emissions, the EFs of smoldering compounds reported for three-stone cooking fires were adjusted by mul-tiplying the mass ratio of each species “X” to CH4 by the
literature-average field EF (CH4)for open cooking in Akagi et al. (2011). Flaming compounds were adjusted by a sim-ilar procedure based on their ratios to CO2. The preferred
values are reported in Table S3. With these adjustments, the emissions of aromatic hydrocarbons (Fig. 9a), phenolic com-pounds (Fig. 9b), and furans (Fig. 9c) distinctively increased with the primitiveness of design; thus, three-stone cooking fires produced the greatest emissions. The advancement in emissions characterization for these sources will be used to upgrade models of exposure to household air pollution and the ERs/EFs should be factored in to chemical-transport models to assess atmospheric impacts.
BB is an important source of reactive N in the atmosphere, producing significant emissions of NOxand NH3while
non-reactive HCN and CH3CN are commonly used as BB marker
compounds (Yokelson et al., 1996, 2007; Goode et al., 1999; de Gouw et al., 2003). The FTIR used in FLAME-4 pro-vided the first detection of HCN emissions from cooking fires and the HCN/CO ER was about a factor of 5 lower than most other BB fuels burned (Stockwell et al., 2014). Similarly, acetonitrile emissions were measured for the first time for cooking fires by PTR-TOF-MS in this study, and the CH3CN/CO ERs from cooking fires are much lower (on
aver-age a factor of∼15) than those from other fuels. This should be considered when using CH3CN/CO ERs to drive source
apportionment in areas with substantial emissions from bio-fuel cooking sources.
5 Conclusions
con-Figure 9.Emission factors (g kg−1)of aromatic hydrocarbons(a), phenolic compounds(b), and furans(c)for traditional and advanced cookstoves. The EFs for traditional stoves were adjusted from orig-inal lab data (Sect. 4.7).
centration range necessitated dilution to minimize reagent ion depletion at peak emissions and the dilution further re-duced the signal to noise ratio. Positive identification of some species by co-deployed grab sampling techniques will be explored further in a separate paper, but is challenged by the difficulty of transmitting some important fire emissions through GC columns (Hatch et al., 2014). We attempted to enhance compound identification by switching reagent ions (O+
2 and NO+); however, this approach with two broadly
sensitive ions in a complex mixture resulted in complex spec-tra for which comparative analysis is beyond the scope of the present effort. Future experiments might consider instead using a less broadly sensitive reagent ion such as NH+
3 as
the alternate reagent ion. We were limited to our pre-chosen calibration mixture based primarily on gases previously ob-served in smoke. For future experiments we suggest adding more standards to generate more accurate calibration factors, specifically including major species such as furan and phenol and more compounds with S and N heteroatoms. In addition, measuring the fragmentation, if any, of more of the species identified in this work would be of great value. Despite these
practical limitations, the experiment produced a great deal of useful new information.
The PTR-TOF-MS obtains full mass scans of NMOCs with high enough resolution to distinguish multiple peaks at the same nominal mass and high enough accuracy to as-sign chemical formulas from the “exact” masses. This aided in compound identification and more than 100 species were categorized as a confirmed identity, a tentative (most likely) assignment, or unidentified but with a chemical formula. Chemical identification was aided by observations of com-pounds reported in smoke emissions, pyrolysis experiments, and those species at relevant concentrations in the atmo-sphere. This allowed the identification of more masses up tom/z165 than in earlier work at unit mass resolution, al-though an estimated range of 12–37 % of the total mass still remains unidentified and tentatively identified. The analy-sis provides a new set of emission factors for ∼68 com-pounds in all fires plus∼50 more in select fires, in addition to species previously quantified by FTIR (Stockwell et al., 2014) and other techniques during FLAME-4 (Hatch et al., 2014). While significant variability was observed between fuels, oxygenated compounds collectively accounted for the majority of emissions in all fuels, with sugar cane producing the highest EF of oxygenated species on average, possibly due to its high sugar content.
We also report emission ratios to benzene, phenol, or furan for the aromatic hydrocarbons, phenolic compounds, and substituted furans, respectively. Reporting emissions of previously unmeasured or rarely measured compounds rela-tive to these more regularly measured compounds facilitates adding several new compounds to fire emissions models. To our knowledge this is the first on-line, real-time characteri-zation of several compounds within these “families” for BB. Observed emissions varied considerably between fuel types. Several example compounds within each class (toluene, gua-iacol, methylfuran, etc.) have been shown, by chamber ex-periments, to be highly reactive with atmospheric oxidants and contribute significantly to SOA formation. The ERs and EFs characterized by PTR-TOF-MS of fresh BB smoke are presented in Tables S1–S3 and (especially the recommended values in Table S3) should aid model predictions of O3and
SOA formation in BB smoke and the subsequent effects on air quality and climate on local–global scales.
A large number of organic N-containing species were de-tected with several identities speculated as amines or amides. These N-containing organic gases may play an important role in new particle formation by physical, chemical, and photo-chemical processes, though a more focused study is neces-sary to measure NPF yields from these compounds and pro-cesses. The additional N-containing gases detected here ac-count for a range of 1–87 % of NH3dependent on fuel type
in regions where biofuel use is prevalent if CH3CN is used
as a tracer.
The S-containing compounds detected by PTR-TOF-MS included dimethyl sulfide and methanethiol, where methanethiol was detected for the first time in BB smoke to our knowledge. These compounds may play a role in acid deposition and aerosol formation, though to what extent has yet to be extensively studied. Phosphorous- and chlorine-containing organic gases were not readily observed in our data set, which may indicate that these species were below our detection limit.
Using full mass scans from a high-resolution PTR-TOF-MS to characterize fresh smoke has aided in identifying sev-eral compounds and provided the chemical formula of other organic trace gases. The additional NMOCs identified in this work are important for understanding fresh BB emissions and will improve our understanding of BB atmospheric im-pacts. The subsequent oxidation products of these gases are the focus of a companion paper probing BB aging. Taken together, this work should improve BB representation in at-mospheric models, particularly the formation of ozone and secondary organic aerosol at multiple scales.
The Supplement related to this article is available online at doi:10.5194/acp-15-845-2015-supplement.
Acknowledgements. FLAME-4, rental of PTR-TOF-MS, and C. S. and R. Y. were supported primarily by NSF grant ATM-0936321. FSL operational costs were supported by NASA Earth Science Division Award NNX12AH17G; thanks to S. Kreiden-weis, P. DeMott, and G. McMeeking, whose collaboration in organizing and executing FLAME-4 is gratefully acknowledged. The collaboration of A. Robinson in organizing FLAME-4 and the cooking fires is also gratefully acknowledged. We thank C. Geron for providing a sample of NC peat. The research was supported by NASA Earth Science Division Award NNX13AP46G.
Edited by: D. Spracklen
References
Akagi, S. K., Yokelson, R. J., Wiedinmyer, C., Alvarado, M. J., Reid, J. S., Karl, T., Crounse, J. D., and Wennberg, P. O.: Emis-sion factors for open and domestic biomass burning for use in atmospheric models, Atmos. Chem. Phys., 11, 4039–4072, doi:10.5194/acp-11-4039-2011, 2011.
Akagi, S. K., Craven, J. S., Taylor, J. W., McMeeking, G. R., Yokel-son, R. J., Burling, I. R., Urbanski, S. P., Wold, C. E., Sein-feld, J. H., Coe, H., Alvarado, M. J., and Weise, D. R.: Evolution of trace gases and particles emitted by a chaparral fire in Califor-nia, Atmos. Chem. Phys., 12, 1397–1421, doi:10.5194/acp-12-1397-2012, 2012.
Akagi, S. K., Yokelson, R. J., Burling, I. R., Meinardi, S., Simp-son, I., Blake, D. R., McMeeking, G. R., Sullivan, A., Lee, T., Kreidenweis, S., Urbanski, S., Reardon, J., Griffith, D. W. T., Johnson, T. J., and Weise, D. R.: Measurements of reactive trace gases and variable O3 formation rates in some South Carolina biomass burning plumes, Atmos. Chem. Phys., 13, 1141–1165, doi:10.5194/acp-13-1141-2013, 2013.
Alvarado, M. J. and Prinn, R. G.: Formation of ozone and growth of aerosols in young smoke plumes from biomass burning: 1. Lagrangian parcel studies, J. Geophys. Res., 114, D09306, doi:10.1029/2008JD011144, 2009.
Alvarado, M. J., Wang, C., and Prinn, R. G.: Formation of ozone and growth of aerosols in young smoke plumes from biomass burning: 2.Three-dimensional Eulerian studies, J. Geophys. Res., 114, D09307, doi:10.1029/2008JD011186, 2009.
Alvarado, M. J., Logan, J. A., Mao, J., Apel, E., Riemer, D., Blake, D., Cohen, R. C., Min, K.-E., Perring, A. E., Browne, E. C., Wooldridge, P. J., Diskin, G. S., Sachse, G. W., Fuelberg, H., Sessions, W. R., Harrigan, D. L., Huey, G., Liao, J., Case-Hanks, A., Jimenez, J. L., Cubison, M. J., Vay, S. A., Wein-heimer, A. J., Knapp, D. J., Montzka, D. D., Flocke, F. M., Pollack, I. B., Wennberg, P. O., Kurten, A., Crounse, J., Clair, J. M. St., Wisthaler, A., Mikoviny, T., Yantosca, R. M., Carouge, C. C., and Le Sager, P.: Nitrogen oxides and PAN in plumes from boreal fires during ARCTAS-B and their impact on ozone: an integrated analysis of aircraft and satellite obser-vations, Atmos. Chem. Phys., 10, 9739–9760, doi:10.5194/acp-10-9739-2010, 2010.
Alvarado, M. J., Yokelson, R. J., Akagi, S. A., Burling, I. R., Fis-cher, E., McMeeking, G. R., Travis, K., Craven, J. S., Sein-feld, J. H., Taylor, J. W., Coe, H., Urbanski, S. P., Wold, C. E., and Weise, D. R.: Lagrangian photochemical modeling of ozone for-mation and aerosol evolution in biomass burning plumes: toward a sub-grid scale parameterization, 12th Annual CMAS Confer-ence, Chapel Hill, NC, 28–30 October 2013, 1–6, 2013. Andreae, M. O. and Merlet, P.: Emission of trace gases and aerosols
from biomass burning, Global Biogeochem. Cy., 15, 955–966, doi:10.1029/2000GB001382, 2001.
Andreae, M. O., Artaxo, P., Fischer, H., Freitas, S. R., Gré-goire, J.-M., Hansel, A., Hoor, P., Kormann, R., Krejci, R., Lange, L., Lelieveld, J., Lindinger, W., Longo, K., Peters, W., de Reus, M., Scheeren, B., Silvia Dias, M. A. F., Ström, J., van Velthoven, P. F. J., and Williams, J.: Transport of biomass burning smoke to the upper troposphere by deep convection in the equatorial region, Geophys. Res. Lett., 28, 951–954, doi:10.1029/2000GL012391, 2001.
Atkinson, R., Aschmann, S. M., and Arey, J.: Reactions of OH and NO3 radicals with phenol, cresols, and 2-nitrophenol at 296±2 K, Environ. Sci. Technol., 26, 1397–1403, doi:10.1021/es00031a018, 1992.
Azeez, A. M., Meier, D., and Odermatt, J.: Temperature de-pendence of fast pyrolysis volatile products from European and African biomasses, J. Anal. Appl. Pyrolysis, 90, 81–92, doi:10.1016/j.jaap.2010.11.005, 2011.