ISSN 2179-8087 (online)
Original Article
Silviculture
Creative Commons License. All the contents of this journal, except where otherwise noted, is licensed under a Creative Commons Attribution License.
Seasonal Variability of Trace Elements by Soil Depth in a
Protected Area
Daniele Rodrigues Barbosa
1
, Helena Saraiva Pinheiro
1
,
Fabiana Soares dos Santos
2
1Universidade Federal Rural do Rio de Janeiro – UFRRJ, Seropédica/RJ, Brasil 2Universidade Federal Fluminense – UFF, Volta Redonda/RJ, Brasil
ABSTRACT
Conservation units are legally protected areas containing natural fragments of Brazilian biomes. They may contain forest areas and can be found near to urban areas, which exposes them to pollutants. The Cicuta Forest Area of Relevant Ecological Interest (ARIE) is located in Volta Redonda and Barra Mansa-RJ, cities with industrial activity and near to the President Dutra Highway (BR 116), which connects the states of Rio de Janeiro and São Paulo. This study aimed to analyze the seasonal variability of the trace elements Pb, Cd, Cu, Mn, Zn and Ni in relation to soil depth in this ARIE, using the slice-wise algorithm to divide-up the soil data into 1 cm thick layers. The results show differences between sampling sites and seasonal variation by depth for trace elements. The highest Cu, Mn, Ni, Pb and Zn concentrations in the areas bordering the forest show that forest conservation minimized anthropic impact.
1. INTRODUCTION
The creation of territorial sites especially protected by the State is regulated by the National System of Conservation Units (SNUC), which aims to guarantee the protection of biome remnants, with either total protection or for sustainable use (Brasil, 2000). The Area of Relevant Ecological Interest – ARIE is a small conservation unit, established in a private or public property, with little or no human occupation and environmental characteristics considered exceptional or as containing rare biota. It aims to maintain natural ecosystems of local importance and regulate their possible uses, making them compatible with conservation interests (Brasil, 2000).
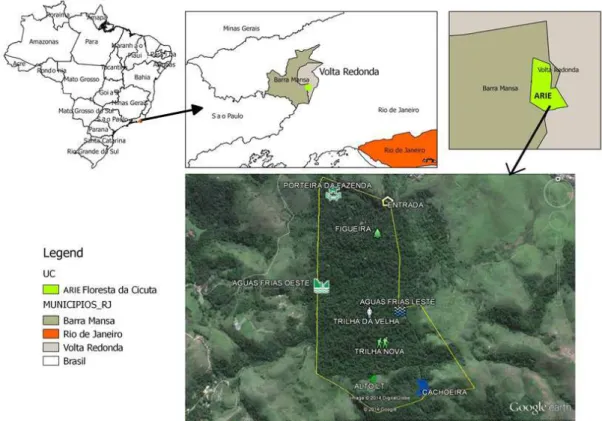
The Cicuta Forest ARIE is an Atlantic rainforest fragment, classified as Submontane Semi-deciduous Seasonal Forest (IBGE, 2012; Alves & Zau, 2005). It is important given the “elevated diversity of its shrub-arboreal component”, with a high percentage of rare species with few similarities (Souza et al., 2007). Created by the CONAMA 05 Resolution, on June 5, 1984 (Brasil, 1984) as an initiative to “save specific natural areas of great ecological importance”, it is located in the cities of Volta Redonda and Barra Mansa, State of Rio de Janeiro. Its surroundings present diverse, potentially polluting industrial activities that emit particulate material into the atmosphere, possibly contain trace elements, and near vehicular traffic on major federal highways, such as the President Dutra Highway BR 116 (Gioda et al., 2004). The quantity of fine atmospheric particulate material (PM10) emitted in these municipalities in 2008 was of 4031 and 1243 tons in Volta Redonda and Barra Mansa, respectively (Sor et al., 2008). However, there is no detailed information regarding trace elements in the soil comparing the boundary area and the forest interior.
Trace elements can be naturally present in the environment and some are important for living beings. However, anthropic activities can increase their natural concentrations leading to soil pollution.
In regions with anthropic activity, diverse factors contribute to the emission and depositing of trace elements in the soil, such as industrial activity (Martín et al., 2015), fossil fuel used by vehicles and railways, and incineration and depositing of residues. Gioda et al. (2004) characterized atmosphere pollutants
in two surveys, between 1995/1996 and during 1999, in Volta Redonda, an area of influence of steel industries, following wind direction, revealing traces ofAl, Mn, Ni, Cr, Zn, Cu, Pb and Fe.
Application of the slice-wise algorithm adopts the premise that a representative functions for the variation of soil properties by depth can be generated based on data collection by profile, summarized according to depth intervals (Beaudette et al., 2013). Based on this database, this mathematical device allows the statistical computation of values weighted by segment. It reconstructs the sample data on a new basis according to pre-defined depths, representing a ‘function of soil depth’, also referred to in the bibliography as “soil-depth function” (Beaudette et al., 2013). An example of the application of soil-depth functions are presented by Ponce-Hernandez et al. (1986) and Odgers et al. (2012), mainly to estimate hydropedological parameters and carbon estimates.
The present study aimed to analyze the seasonal variability of trace element levels by soil depth, in the Cicuta Forest ARIE. With this in mind, we created numerical parameters to describe the vertical variability of soil properties (sand, silt, clay, pH in water and trace elements) through the application of the algorithm set from the Algorithms for Quantitative Pedology Pack (AQP, initial in English).
2. MATERIAL AND METHODS
The Cicuta Forest ARIE is situated in the Volta Redonda and Barra Mansa municipalities, State of Rio de Janeiro, in the region denominated Mid-Paraíba Fluminense, within the coordinates of 22° 24’ and 22° 38’ South and 44° 09’ and 44° 20’ West. It has 131,28 hectares and an altitude that varies between 300 and 500 m (Souza et al., 2007).
2014, there was below average rainfall due to the presence of an atmospheric block (INMET, 2014), characterizing conditions different to those usually observed in the area.
The soil found in the Cicuta Forest ARIE is characterized as Red-Yellow Argissoil (Santos et al., 2013). We used Google Earth software (Google, 2014) to determine sampling points and to plot polygons along the boundaries and trails already established in the Cicuta Forest ARIE, available through the ICMBio (2012). We selected nine sites whose denomination was related to the name of their trails. The sampling sites in locations along the boundaries of the rain Forest were Porteira da Fazenda (POR); Águas Frias West (AFO); Entrada (ENT) and Alto da Linha de Transmissão de Energia de Alta Tensão (ALT). The sites located within the forest are Cachoeira (CAC); Trilha da Velha (TDV); Trilha Nova (TN); Águas Frias East (AFI); and Figueira (FIG), seen in Figure 1.
Collection was performed during two distinct periods: winter in July 2013; and summer in January 2014. Precipitation during the month of July 2013 was 151mm3 and in January 2014 it was 78mm3 (CSN, 2014).
Soil was collected at depths of 0-5 cm; 5-10 cm; 10-20 cm; 20-40 cm; and 40-60 cm. The soil samples were air dried, turned and passed through a 450µm sieve. The pseudo-total Zinc (Zn); Manganese (Mn); Lead (Pb); Nickel (Ni) and Copper (Cu) levels were determined using a water regalia extractor (HC1: HNO3) at a proportion of 3:1, according to the ISO 11.466 (ISO, 1995). Subsequently, the extracts were analyzed in triplicate in a VARIAN, AA 55B model atomic absorption spectrophotometer with an air/acetylene call. For granulometric analysis and pH analysis in water, the pipet method according to Donagema et al. (2011) was used.
The statistical procedures for data analysis and the soil-depth functions were performed using the
free access program R (R Development Core Team, 2013). For the soil-depth functions, the “Algorithms for Quantitative Pedology” pack were used (AQP), developed by Beaudette et al. (2013).
The data analysis of the collection points included the application of the slice-wise algorithm (Beaudette et al., 2013) with equation slab (1), that permits the “slicing” of the soil, attributing values to each 1 cm layer, based on the data set collected at pre-defined depths. The slicing allows the calculation of the average and median values for each segment via the vector calculated according to the syntax slab 1 below:
~ 2
2013 2014 2013 2014 2013
2014 2013 2014 2013 2014,
. / , .
data pH H O Total Sand Silt Clay
Pb Pb Cu Cu Mn
slab
Mn Zn Zn Ni Ni
slab fun medium median na rm TRUE
+ + + + + + + + = = +
+ + + + (1)
Based on the database generated from 1 cm thick layers, the dissimilarity matrix between the profiles was generated, permitting the evaluation of the similarities and differences between the collection points in relation to the trace elements during the distinct periods. The dissimilarity between the hydromorphic soils was calculated using the “profile compare ()” function, considering the maximum depth (60 cm) and the equal weighting coefficient at 0.01. The number of profiles used in the calculation is represented by the contribution fraction, whose value can be considered as the aggregated measure of the probability for each soil depth. Additionally, a function was used to render the collection site schemes, according to the Munsell (1990) soil color chart, which is useful to standardize the visualization of soil profile sketches.
3. RESULTS AND DISCUSSION
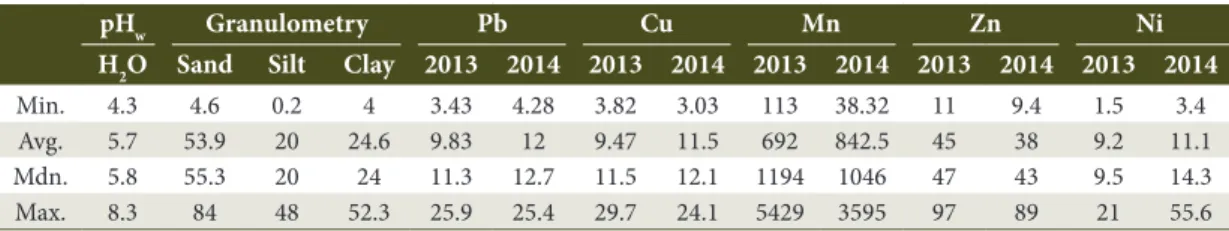
Table 1 presents the data on minimum, average, median and maximum levels for each trace element analyzed, in mg kg-1, pH in water and sand, silt and
clay percentages, from all the sampled sites, generated by the script.
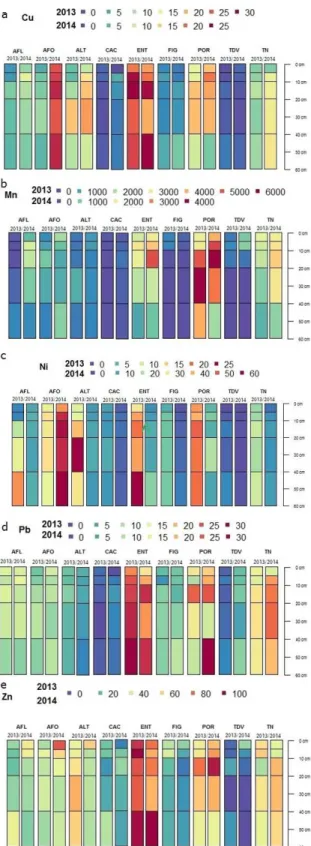
The variability of the characteristics, regarding the distribution of the trace elements by sampling site, at each depth, during distinct periods, using the standardized sketches according to the depth of the collected layers is shown in Figure 2, with the aim of generating an information gain to facilitate decision-making.
In Figure 2a, the trace element Cu presented the highest levels at the ENT site, at diverse sampled depths, followed by the POR site. Both are boundary areas that are more exposed to anthropic action, with little vegetation and close to the access road for the conservation unit. It is notable that the color generated does not correspond to the same levels in the distinct periods (humid winter in 2013 and dry summer in 2014), therefore, the element Cu has the same color generated at a depth of 10 to 20 cm, however, this corresponds to a higher level during the period of 2013, 30 mg kg-1, than in the period of 2014, which was
25 mg kg-1. However, none of the values were above
the prevention value in soils (60 mg kg-1) according
to the CONAMA 420 Resolution from December 28, 2009 (Brasil, 2009). The lowest levels of the element Cu (0 mg kg-1) were found at the TDV site with a strong
similarity between the periods sampled, followed by CAC that presented a slight difference between the humid winter in 2013 and the dry summer in 2014 of 5 mg kg-1.These sites are located in the interior of
the forest, with less influence from anthropic activity. The greatest discrepancy observed between the sampled periods, for this element, was at the AFO site: up to 10 mg kg-1 during the winter in 2013, and 20 mg kg-1
in the summer of 2014.
The highest Mn levels (Figure 2b), were observed at the POR site, with up to 6000 mg kg-1 in 2013 and 4000 mg kg-1
in 2014, followed by the ENT site, located near to the boundary area of the conservation unit, showing greater
Table 1. Descriptive data for soil from the Cicuta Forest ARIE: pH in water, granulometry and trace elements.
pHw Granulometry Pb Cu Mn Zn Ni H2O Sand Silt Clay 2013 2014 2013 2014 2013 2014 2013 2014 2013 2014
Min. 4.3 4.6 0.2 4 3.43 4.28 3.82 3.03 113 38.32 11 9.4 1.5 3.4
Avg. 5.7 53.9 20 24.6 9.83 12 9.47 11.5 692 842.5 45 38 9.2 11.1
Mdn. 5.8 55.3 20 24 11.3 12.7 11.5 12.1 1194 1046 47 43 9.5 14.3
Max. 8.3 84 48 52.3 25.9 25.4 29.7 24.1 5429 3595 97 89 21 55.6
Figure 2. Trace element levels (mg kg-1) of the soil layers sampled during the winter of 2013 and the summer of 2014
influence from anthropic action. Highlighting that a similar color does not correspond to the same levels in the specific collection periods (winter of 2013 and summer of 2014), the Mn levels at the POR site during the humid period of 2013 were higher, compared with the dry period in 2014. The lowest Mn levels were observed at the CAC, TDV, FIG and AFL sites; lower than 1000 mg kg-1 considered sites located within the
forest, indicating anthropic influence in the increase of Mn concentration in the soils. Gioda et al. (2004) in research about trace elements in total suspended air particles, found high Mn levels originating from steel manufacturing in the city of Volta Redonda-RJ.
For the element Ni (Figure 2c), the sites located within the forest (TN, FIG, CAC and TDV) presented lower levels in comparison with sites situated in areas more exposed to anthropic action (ALT, AFO, ENT and POR). Peña-Fernández et al. (2015) attributed the elevated seasonal Ni values to industrial emissions, compared with the urban soils. During the summer in 2014, the AFO site presented Ni concentrations greater than the prevention values in the soils (60 mg kg-1) according
to the CONAMA 420 Resolution of December 28, 2009 (Brasil, 2009). This may have been the result of its geographical location as a boundary area of the ARIE containing pastures.
The highest Pb levels (Figure 2d) during both the sampling periods (2013 and 2014) were found in the sites presenting greatest anthropic influence, located at the extremities of the area, principally the ENT site. However, none of the sites presented a concentration above the prevention value in the soils (72 mg kg-1)
according to the CONAMA 420 Resolution of December 28, 2009 (Brasil, 2009). The Pb concentrations tended not to vary between the collection periods, with greater differences between the periods being found at the POR site, varying between 10 mg kg-1 to 30 mg kg-1 at
a depth of 40 to 60 cm.
The highest Zn levels in the soils of the Cicuta Forest ARIE (Figure 2e) were observed at the ENT site, during both periods and the lowest were at the TDV site. Silva et al. (2013) found elevated Zn levels in soils and plants near to the President Dutra Highway (BR 116), with this element possibly coming from automotive combustion and wear of tires. Higher Zn levels were also observed during the winter period in 2013 in comparison with summer 2014, which could be explained by the higher rainfall and consequent
runoff of Zn accumulated on the surface of leaves and suspended in the air. However, none of the values were greater than the prevention value (300 mg kg-1)
according to the CONAMA 420 Resolution of December 28, 2009 (Brasil, 2009).
The analysis of similarity is based on “divisional hierarchical grouping” (Kaufman & Rousseeuw, 2005; Beaudette et al., 2013), as a reflection of the grouping characteristics, which can divide the collection into smaller, more homogenous groups. Therefore, the analysis of similarity was used, presented in the form of a dendrogram and schematic sketch, of the depths sampled from the collection sites in the Cicuta Forest ARIE (Figure 3). The analysis of similarity was based on the criteria: pH in water, granulometry (%), trace elements and approximate values of the color standard of the Munsell (1990) card used to classify the soil, where the quantitative comparison between layers should represent the variable thickness of the sampled layers associated with the soil properties (Webster & Oliver, 1990).
Figure 3 organizes the differences between the profiles based on the clay, sand and silt, trace elements and pH in water profiles, while the vertical component (Y) represents the depths of the layers collected according to the field description. The scale of the dendrogram on the upper right hand side of the figure corresponds to the numerical dissimilarity in relative terms (percentage).
The employment of sketches is useful for pedologists, due to the presentation of the horizon stratigraphy or transition of layers with distinct characteristics, highlighting morphological properties and characteristics of the soils (Beaudette et al., 2013). However, without a scale, legend or standard symbologies, they are subjective and hamper the transformation of data into again in understanding and information for users. Therefore, the approach employed permitted the comparison of soil properties by depth, revealing differences between the seasonal variations of trace elements in the soil of the Cicuta Forest ARIE.
influence, located along the boundary of the area and with lower vegetation coverage density. On the other hand, the FIG and TDV sites presented elevated similarity and were considered the most interior, in closed rainforest, demonstrating their proximity and level of conservation. The CAC site, with similarity close to that of the FIG and TDV sites, is also located in the interior of the forest. However, the soil at the CAC site showed a sandier granulometry due to its localization along the banks of the Brandão stream that deposits sandy sediment.
4. CONCLUSIONS
Higher trace element concentrations were observed in soils of the sites located along the boundaries of the Cicuta Forest ARIE (POR and ENT), presenting greater influence by anthropic activity, and being able to establish relationships with the atmospheric deposits from diverse sources of pollution, such as pollutants from local industrial suspensions and highways.
The visualization of the layers via the standardized sketches according to a common scale facilitated the comparison of the seasonal variation of trace element
Figure 3. Dissimilarity between the soils of the Cicuta Forest ARIE from the Entrada (ENT), Porteira (POR), Cachoeira (CAC), Figueira (FIG), Trilha Velha (TDV), Trilha Nova (TN), Águas Frias West (AFO), Águas Frias East (AFL) and Alto da Linha de Transmissão (ALT) sites, by depth and pH in water, trace elements and granulometry characteristics illustrated according to the color standard of the Munsell (1990) card.
levels by layer, and allowed the analysis of the similarity between the collection sites. This analysis revealed similarity between the Entrada (ENT) and Porteira (POR) sites and greater distribution between the other sites, showing less external impact.
SUBMISSION STATUS
Received: 20 feb., 2017 Accepted: 14 feb., 2018
CORRESPONDENCE TO
Daniele Rodrigues Barbosa
Universidade Federal Rural do Rio de Janeiro – UFRRJ, Campus Universitário, Rod. BR 465, Km 7, CEP 23890-000, Seropédica, RJ, Brasil e-mail: [email protected]
REFERENCES
Alves AL, Zau AS. A importância da Área de Relevante Interesse Ecológico Floresta da Cicuta (RJ) na conservação do bugio-ruivo (Alouatta guariba clamitans Cabrera, 1940). Revista Universidade Rural. Série Ciências da Vida
Beaudette DE, Roudier P, O’Geen AT. Algorithms for quantitative pedology: a toolkit for soil scientists.
Computers & Geosciences 2013; 52: 258-268. http://dx.doi.
org/10.1016/j.cageo.2012.10.020.
Brasil. Ministério do Meio Ambiente – MMA. Conselho Nacional do Meio Ambiente – CONAMA. Resolução nº
05, de 05 de junho de 1984. Diário Oficial da República
Federativa do Brasil, Brasília, DF (1984 jul. 20). Brasil. Lei nº 9.985, de 18 de julho de 2000. Diário Oficial da República Federativa do Brasil, Brasília, DF (2000 maio 19).
Brasil. Ministério do Meio Ambiente – MMA. Conselho Nacional do Meio Ambiente – CONAMA. Resolução
nº 420, de 28 de dezembro de 2009. Diário Oficial da
República Federativa do Brasil, Brasília, DF (2009 dez. 30); Sec. 249: 81-84.
Companhia Siderúrgica Nacional – CSN. Dados de
temperatura e precipitação da estação Recreio 1. Volta
Redonda: CSN; 2014.
Donagema GK, de Campos DVB, Calderano SB, Teixeira WG, Viana JHM, editors. Manual de métodos de análise
de solo. 2. ed. Rio de Janeiro: Embrapa Solos; 2011.
Gioda A, Salesc JA, Cavalcanti PMS, Maia M, Maia LFPG, Aquino FR No. Evaluation of fair quality in Volta Redonda, the main metallurgical industrial city in Brazil. Journal
of the Brazilian Chemical Society 2004; 15(6): 856-864.
http://dx.doi.org/10.1590/S0103-50532004000600012. Google. Google Earth 7.1.2.2041. Data das imagens: 5 de
março de 2014 [online]. 2014 [cited 2014 June 2]. Available
from: https://www.google.com/earth/
Instituto Brasileiro de Geografia e Estatística – IBGE.
Manual técnico da Vegetação Brasileira: sistema fitogeográfico, Inventário das formações florestais e campestres, Técnicas e manejo de coleções botânicas e procedimentos para
mapeamentos. 2. ed. Rio de Janeiro: IBGE; 2012.
Instituto Chico Mendes de Conservação da Biodiversidade – ICMBio. Ministério do Meio Ambiente – MMA. ARIE
Floresta da Cicuta [online]. Brasília: ICMBIO; 2012 [cited
2012 July 25]. Available from: http://www.icmbio.gov.br Instituto Nacional de Meteorologia – INMET. Coordenação-geral de Desenvolvimento e Pesquisa – CDP. Boletim
agroclimatológico mensal de julho 2013. Brasília: INMET;
2013.
Instituto Nacional de Meteorologia – INMET. Coordenação-geral de Desenvolvimento e Pesquisa – CDP. Boletim
agroclimatológico mensal de janeiro 2014. Brasília:
INMET; 2014.
International Organization for Standardization – ISO. ISO 11466: soil quality-extraction of trace elements soluble in
aqua regia. Geneva: ISO; 1995.
Kaufman L, Rousseeuw PJ. Finding groups in data: an
introduction to cluster analysis. New Jersey: Wiley-
Interscience; 2005.
Martín R, De Arana C, Martín JA, Ramos-Miras JJ, Gil C, Boluda R. Impact of 70 years urban growth associated with heavy metal pollution. Environmental Pollution 2015; 196: 156-163. http://dx.doi.org/10.1016/j.envpol.2014.10.014. PMid:25463709.
Munsell AH. Munsell soil color charts. Baltimore: Macbeth Division of Kollmorgen Instruments; 1990.
Odgers NP, Libohova Z, Thompson JA. Equal-area spline functions applied to a legacy soil database to create weighted-means maps of soil organic carbon at a continental scale. Geoderma 2012; 189–190: 153-163. http://dx.doi.org/10.1016/j.geoderma.2012.05.026. Peña-Fernández A, Lobo-Bedmar MC, González-Muñoz MJA. Annual and seasonal variability of metals and metalloids in urban and industrial soils in Alcalá de Henares (Spain). Environmental Research 2015; 136: 40-46. http://dx.doi.org/10.1016/j.envres.2014.09.037. PMid:25460619.
Ponce-Hernandez R, Marriott FHC, Beckett PHT. An improved method for reconstructing a soil profile from analyses of a small number of samples. Journal
of Soil Science 1986; 37(3): 455-467. http://dx.doi.
org/10.1111/j.1365-2389.1986.tb00377.x.
R Development Core Team. R: a language and environment for statistical computing. Vienna: R Foundation for Statistical Computing; 2013.
Santos HG, Jacomine PKT, Anjos LHC, Oliveira VA, Lumbreras JF, Coelho MR et al. Sistema brasileiro de
classificação de solos. 3. ed. Rio de Janeiro: Embrapa
Solos; 2013.
Silva LC, Almeida JCR, Almeida AAS. Ocorrência de chumbo e zinco nos solos e plantas às margens de uma rodovia de tráfego veicular intenso. Ambiente & Água: An
Interdisciplinary Journal of Applied Science 2013; 8: 50-59.
Sor JL, Júnior JC, Guimarães LT, Moreno RA. Relatório piloto com aplicação da metodologia IPPS ao Estado do Rio de Janeiro: uma estimativa do potencial de poluição
industrial doar. Rio de Janeiro: IBGE, Coordenação de
Recursos Naturais e Estudos Ambientais; 2008. Souza GR, Peixoto AL, Faria MJB, Zaú AS. Composição florística e aspectos estruturais do estrato arbustivo-arbóreo de um trecho de Floresta Atlântica no médio vale do Rio Paraíba do Sul, Rio de Janeiro, Brasil. Sitientibus. Série
Ciências Biológicas 2007; 7(4): 398-409.
Webster R, Oliver M. Statistical methods in soil and land