Daniel Fernandes Duarte
Licenciatura em Química Aplicada
Structural characterization of the urea-unfolded
state of Colicin Immunity Protein Im7 and Im9
Dissertação para obtenção do Grau de Mestre em Bioquímica Estrutural e Funcional
Orientador: Prof. Eurico José da Silva Cabrita, Professor Auxiliar,
Faculdade de Ciências e Tecnologia
Co-orientador: Ângelo Miguel Mendes de Figueiredo, Doutor,
Faculdade de Ciências e Tecnologia
Júri:
Presidente: Prof. Doutor José Ricardo Ramos Franco Tavares
Arguente: Prof. Doutor Doutor Carlos Alberto Gomes Salgueiro
Vogal: Prof. Doutor Doutor Eurico José da Silva Cabrita
Daniel Fernandes Duarte
Licenciatura em Química Aplicada
Structural characterization of the urea-unfolded
state of Colicin Immunity Protein Im7 and Im9
Dissertação para obtenção do Grau de Mestre em Bioquímica Estrutural e Funcional
Orientador: Prof. Eurico José da Silva Cabrita, Professor Auxiliar,
Faculdade de Ciências e Tecnologia
Co-orientador: Ângelo Miguel Mendes de Figueiredo, Doutor,
Faculdade de Ciências e Tecnologia
“Copyright”
Daniel Fernandes Duarte
Faculdade de Ciências e Tecnologia Universidade Nova de Lisboa
Acknowledgements
i
Acknowledgements
I would like to start by expressing my gratitude to my supervisors Prof. Eurico Cabrita and Dr Ângelo Figueiredo, who allowed me this fantastic opportunity to perform my thesis, and also for providing me all the conditions and the support for a successful work.
To all my colleges from the laboratory, Dr Marta Corvo, Dr Filipa Marcelo, Dr João Sardinha and Rui Soares, thank you for all the help, disponibility and support.
To the group of Professor Carlos Salgueiro, for all the help offered and for allowing me to perform some of my experimental work there, thank you.
To Faculdade de Ciências e Tecnologia da Universidade Nova de Lisboa and Associate Laboratory REQUIMTE for providing the resources that allowed me to carry out my work.
To Fundação para a Ciência e a Tecnologia through grant no PEst-C/EQB/LA0006/2011 and Project no. PTDC/QUI-QUI/098892/2008. The NMR spectrometers are part of the National NMR Network (RNRMN) and are funded by Fundação para a Ciência e a Tecnologia.
To my family, without whom I wouldn’t be here, thank you for all the support, motivation
and encouragement through all this process.
Resumo
iii
Resumo
A maioria das proteínas contendo um único dominio, têm a capacidade de se rearranjar (fold) espontaneamente numa estrutura tridimensional funcional num segundo ou menos. A compreensão destas transições, não só ajuda a revelar a maneira pela qual uma sequência de aminoácidos codifica a estrutura tridimensional correspondente, mas também pode fornecer informações sobre as transições de folding/unfolding que muitas proteínas sofrem como parte do seu funcionamento normal, bem como os processos misfolding que estão na base de uma série de doenças, como Alzheimer e Parkinson.
Neste trabalho, duas proteínas já bem estudadas e caracterizadas, Colicin immunity proteins Im7 e Im9, foram usadas como modelo para estudos estruturais envolvendo duas diferentes metodologias para promover a sua desnaturação/unfolding. As proteínas apresentam uma elevada homologia a nível de sequência primária e estrutural, divergindo no mecanismo de folding.
Utilizando espectros 1H-15N HSQC como ferramenta principal, foi realizado um estudo comparativo, de modo a identificar quais os resíduos mais pertubados por um efeito físico, Temperatura, e por um agente químico, Urea. Com este estudo espera-se detectar possíveis semelhanças que possam fornecer novas pistas sobre os aspectos que controlam as transições entre folding/unfolding.
Os resultados relativos à temperatura, evidenciam que os resíduos mais perturbados estão localizados maioritariamente em zonas de loop (random coil) entre hélices, enquanto que com a ultilização de ureia, verifica-se uma maior perturbação em resíduos acessíveis e expostos ao solvente.
Abstract
v
Abstract
Most single domain proteins have the ability to fold spontaneously into a precise, functional three-dimensional structure in seconds or less. Understanding how this transition occurs will not only help to uncover the way in which an amino acid sequence encodes the corresponding structure but is also likely to provide insight into the folding/unfolding transitions that many proteins undergo as part of their normal functioning. The characterization of these states is particularly important because they often play crucial roles in folding and misfolding
processes, responsible for many human neurodegenerative diseases, such as Alzheimer’s and Parkinson’s diseases.
In this work, two well characterized proteins, Colicin immunity proteins Im7 and Im9, where used as model for a structural study involving two different approaches to promote their denaturation/unfolding. Im7 and Im9 share a high sequence and structural homology, but despite that fact they fold with different kinetic mechanism in vitro.
By using 1H-15N HSQC spectra as a main tool, we have undertaken a comparative study to identify the residues more affected during the denaturation process of Im7 and Im9 promoted by a physical effect, temperature increase, and by a chemical agent, urea. Our aim was to detect possible similarities that could give insight into the aspects that govern folding/unfolding transitions.
The results from the temperature study show that the residues most perturbed with increasing temperature are mostly located in loop regions between helices, while urea targets preferably residues that are accessible and solvent exposed.
Contents
vii
Contents
Acknowledgements ... i
Resumo ... iii
Abstract... v
List of Figures ... ix
List of Tables ... xi
Abbreviations and symbols ... xiii
1 – Introduction ... 1
1.1 – Protein Folding ... 4
1.1.1 – Protein Folding Mechanisms ... 5
1.1.2 – Native Protein Structure ... 6
1.1.3 – Transition State Ensemble ... 8
1.1.4 – Folding Intermediates ... 9
1.1.5 – Denatured state ensemble ... 9
1.1.5.1 – Denaturation of Proteins by Urea ...10
1.2 – E colicin Immunity Proteins ... 10
2 – Material and Methods ...13
2.1 – Molecular Biology ... 13
2.1.1 – Purification of Im9 ...13
2.1.1.1 – Anion-exchange Chromatography ...14
2.1.1.2 – Gel Filtration ...14
2.1.1.3 – Mass Spectroscopy ...15
2.2 – NMR Spectroscopy studies ... 15
2.2.1 – Urea titration ...15
2.2.2 – Temperature Denaturation ...16
2.2.3 – Combined Chemical Shift ...16
3 – Results ...19
3.1 – Purification and biochemical characterization of Im7 and Im9 ... 19
3.2 – NMR experiments ... 21
3.2.1 – Protein denaturation process ...21
4 – Discussion...33
5 – Conclusions ...39
viii
List of Figures
ix
List of Figures
Figure 1: Schematic organization levels of proteins ... 3
Figure2: Schematic representation of the energy diagram for the protein folding process. ... 8
Figure 3 – Comparison of Im7 and Im9 protein structures and sequences. ... 12
Figure 4: SDS-PAGE 15% gel of Im9 fractions after Anion-Exchange Chromatography. ... 20
Figure 5: SDS-PAGE 15% gel of Im9 fractions after Gel Filtration.. ... 20
Figure 6: 1H-15N HSQC spectra of Im7 at different temperatures.. ... 23
Figure 7: A) Im7 backbone amide chemical shift variations between 283K and 313K; B) Evolution of Δδ with temperature for the most affected residues; C) Structure of Im7. ... 24
Figure 8: A) Im9 backbone amide chemical shift variations between 283K and 323K; B) Evolution of Δδ with temperature for the most affected residues; C) Structure of Im9 ... 25
Figure 9: 1H-15N HSQC spectra of Im7 at different concentrations of urea.. ... 27
Figure 10: A) Im7 backbone amide chemical shift variations between native and 3M urea; B) Evolution of Δδ with urea for the most affected residues; C) Structure of Im7 ... 28
Figure 11: A) Im9 backbone amide chemical shift variations between native and 4M urea; B) Evolution of Δδ with urea for the most affected residues; C) Structure of Im9 ... 29
Figure 12: 1H-15N-HSQC spectra at 600 MHz of native Im7 in 50mM phosphate buffer, pH 7, in 10% 2H2O, at 10 ºC. Spectrum A: protein Im7 without urea; Spectrum B: protein Im7 in 6M urea. ... 33
Figure A1: Time of Flight mass spectrum of the Im9 protein. ………..………….…45
Figure A2: 1H-15N HSQC spectra of Im9 at different temperatures. ………...…..46
List of Tables
xi
List of Tables
Table 1: Example of the tables created and the results treatment performed. ... 21
Table 2: Number of residues assigned during thermal denaturation. ... 22
Table 3: Number of residues assigned during urea denaturation. ... 26
Table 4: Comparison of the chemical shift perturbation by thermal (T) and chemical (urea) denaturation of Im7 and Im9 proteins.. ... 30
Table 5: Comparison between the hydrogen exchange rates (kex) and the chemical shift perturbation by thermal (T) and chemical (urea) denaturation of Im7 protein.. ... ………..37
Table B1: 1H and 15N chemical shifts (δ) table for Im7 at different temperatures………...………49
Table B2: 1H and 15N chemical shifts (δ) table for Im9 at different temperatures………...………51
Table B3: 1H and 15N chemical shifts (δ) table for Im7 at different Urea concentrations………..….53
Abbreviations and symbols
xiii
Abbreviations and symbols
1D One dimensional
2D Two dimensional
BLAST Basic Local Alignment Search Tool BMRB Biological magnetic resonance data bank
DNases Endonucleases
DSE Denatured state ensemble
ESI-MS Electrospray ionization mass spectroscopy GuHCl Guanidine hydrochloride
HCl Hydrochloric acid
HSQC Heteronuclear single-quantum coherence
MW Molecular weight
Im7 Colicin Immunity Protein Im7 Im9 Colicin Immunity Protein Im9 MWCO Molecular Weight Cut-Off
MS Mass spectroscopy
NMR Nuclear magnetic resonance spectroscopy
PDB Protein data bank
PMSF Phenyl-methylsulphonyl fluoride
pI Isoelectric point
ppm Parts per million
RF Radio frequency pulse
RNases Ribonucleases
rpm Rotations per minute
SDS-PAGE Sodium dodecyl sulfate polyacrylamide gel electrophoresis TCI Triple-resonance cryoprobe
TSE Transition state ensemble
TOF Time-of-Flight
UV-visible Ultraviolet-visible
δ Chemical shift
xiv
Amino acid abbreviationsAlanine Ala A
Arginine Arg R
Asparagine Asn N
Aspartate Asp D
Cysteine Cys C
Glutamate Glu E
Glutamine Gln Q
Glycine Gly G
Histidine His H
Isoleucine Ile I
Leucine Leu L
Lysine Lys K
Methionine Met M
Phenylalanine Phe F
Proline Pro P
Serine Ser S
Threonine Thr T
Tryptophan Trp W
Tyrosine Tyr Y
Introduction
1
1
–
Introduction
Newly formed polypeptide sequence must be able to find the way to its correct fold rather than the countless alternatives. To discover how this happens is one of the greatest challenges in modern structural biology.
Introduction
3
1
–
Introduction
One of the defining characteristics of a living system is the ability of even the most intricate of its component molecular structures to self-assemble with precision and fidelity, being one of the most outstanding examples the proteins.
The word protein comes from the Greek word “protos”, meaning first element. Proteins are the workhorses of biological macromolecules, essential elements for growth and repair, functioning and structure of all living cells, having the ability to self-assemble into a precise three dimensional structure in seconds or less in order to perform their function.
When we think about a protein, is inherent to think about its three-dimensional structure and the routes or paths that drive to such conformation. As proteins undergo a series of events and reorganization (fold), they are characterized in four distinct conformations (Figure 1):
Primary structure - the linear order of
amino acid sequence of the peptide chains.
Secondary structure - highly regular
sub-structures; α-helix and strands of β -sheet, which are locally defined.
Tertiary structure - spatial arrangement
of the secondary structures, describing the completely folded and compacted polypeptide chain.
Quaternary structure - complex of
several protein molecules or polypeptide chains, usually called protein subunits.
4
Understand and uncover the mechanism though such modifications and reorganization occur during the folding phenomena, is one of the challenges of science nowadays.
1.1 – Protein Folding
The fulfillment of biological function requires the protein has correct three-dimensional structure. Proteins as explained before, fold from a random chain (usually called denatured or unfolded state) to a specific three-dimensional structure (native state), under suitable circumstances, like pH, temperature, solvent, via various kinds of folding intermediates or transitions states. Life requires in general that proteins achieve a reliable and functional fold, so the native fold of each protein has evolved to be more stable than all other possible folds. Since native fold are highly complex and irregular, their stability is one of the most impressive examples, where weak forces work together to originate an intricate and reproducible structures[1]. Nevertheless, a so complex mechanism can have failures, and some proteins are not able to remain with the correct fold or fail to fold correctly, leading to a wide variety of
pathological conditions, such as Alzheimer’s, cystic fibrosis, prion diseases and many neurodegenerative diseases[2].
For more than 50 years, scientists have become more and more interested into this
unique field in biological investigation, birthed with two major observations during the 60’s that
led to two distinct views of the folding phenomena; First, Anfinsen demonstrated that fully denatured proteins require nothing more than dilution of denaturant to return to their active form.
This observation identified each protein’s unique amino acid sequence as sufficient for the
determination of its structure, and this self-organization led to the formulation of one of the first hypothesis about protein folding; the thermodynamic Hypothesis, according to which the native state is the minimum of Gibbs energy in the folding path[3, 4]. Despite this fact, is still unclear how a simple primary sequence of amino acids can code for the three-dimensional structure and define the folding path.
Introduction
5
Understand in detail the mechanism of protein folding is a very important step and with
huge importance in the field of protein science, but a conclusive answer wasn’t yet achieved, due the fact that all proteins don’t undergo the same unique mechanism, and in the last years
several models have been proposed.
1.1.1
–
Protein Folding MechanismsBased on above two fundamental observations, several models have been proposed to elucidate the mechanisms of protein folding.
The hierarchic model of protein folding, also known as framework or diffusion-collision model, suggests that local secondary structural elements such as α-helix or β-sheet are the starting point in folding process, independently [6]. These structural elements would then diffuse and collide, ultimately coalescing into native tertiary structure. At the other end of the spectrum is the hydrophobic collapse model. This proposal asserts that folding is initiated with an extensive collapse of hydrophobic residues, followed by formation of secondary structure. The nucleation model took up residence somewhere in the middle and stated that partial native secondary structure would serve as a folding nucleus from which further structure would propagate [7].
All three of the proposed models implied the population of semi-folded structures (intermediates) along the pathway. Jackson and Fersht, however, reported that folding of chymotrypsin inhibitor 2 occurred in a two-state manner, with no detectable intermediates [8]; a mechanism termed nucleation-condensation.
Subsequent ϕ-value analysis, which probes the effects of amino acid substitution on the transition state stability, confirmed the two-state folding. Recently Fersht and coworkers [9, 10] have proposed a unifying mechanism, that consists of three basic steps: 1) formation of a nucleus with native-like topology, 2) polypeptide chain collapse, and 3) achievement of the native conformation through structural consolidation. Under the posited unifying mechanism proteins may appear to fold via the nucleation-condensation or framework models depending on the stability of their relative folding intermediates and the height of the corresponding transition barriers [11].
6
folding rate is proportional to the number of folding routes [14]. The presence of many possible pathways leading to the native structure forms the basis of the folding funnel model [15, 16]. This model envisions folding as a conformational search on a rugged free energy landscape which is biased towards the native state.
The population of folding intermediates, or lack thereof, can then be explained by the degree of smoothness of the landscape. The energetic bias of the funnel explains, at least partially, how proteins can adopt complex structures on a biologically relevant timescale. Another factor that affects the folding rate is the amount of native-like structure present in the unfolded state. The denatured state ensemble (DSE) of a protein can be highly heterogeneous. However, many recent accounts suggest the retention of some residual structure [17, 18]. This would lighten the difficulties envisioned by Levinthal by limiting the conformations populated in the DSE to a small fraction of all possible conformations.
1.1.2
–
Native Protein StructureCalled the native fold, this structure is stabilized by chemical forces both within the protein and between the protein and its surrounding environment. These contain the hydrogen bonds, electrostatic interactions, disulfide bridges, and van der Waals forces.
The native structure of a protein is only marginally stable compared to the unfolded state. There is a large entropic penalty associated with the transition from a disordered chain to one of highly defined structure, as well as an enthalpic penalty for disrupting many interactions with the solvent. The protein must overcome these unfavorable contributions through intramolecular contacts. Some important examples are discussed below:
Introduction
7
Hydrogen bonding: Hydrogen bonds require both a donor group and an acceptor group. Donors have a hydrogen atom bound to an electronegative heteroatom, eg. -NH, -OH, - SH, and acceptors have lone electron pairs, eg. C=O. The peptide backbone, as well as side chains, of an unfolded protein makes numerous hydrogen bonds with the solvent. Upon folding, loss of those contacts must be compensated for with intramolecular hydrogen bonds, most of which are
found in α-helices and β-sheets. It has been estimated that the average hydrogen bond stabilizes a protein by ~2-5 kJ mol-1 [21, 22].
Salt bridges: The positive charge on the side chains of Arg and Lys, as well as the negative charge on those of Asp and Glu, often result in their localization on the protein surface. Electrostatic pairing of these side chains is stabilizing. Occasionally such salt bridges can also occur within the protein core. Charge-charge interactions on the surface are weaker due to solvent screening. While perhaps not as important as other intramolecular forces, it has been shown that optimizing the charged interactions on the protein surface can increase stability over the wild-type molecule [23].
Cation-π interactions: While the positively-charged side chains of Arg and Lys can be involved in salt bridges, they are also often found interacting with the π-electrons of the aromatic amino acids Phe, Tyr, and Trp. A survey of the structures in the Protein Data Bank revealed ~25% of all Trp residues involved in a significant cation-π interaction[24]. A bias for Arg-Tyr interactions has been shown to exist at protein-protein interfaces, with the stabilizing electrostatic energy estimated to be around 10 kJ/mol[25]. A recent study found a specific cation-π interaction to be vital for the regulation of integrin affinity and function [26]. Similar interactions occur between aromatic residues. The hydrogen on the aromatic rings is slightly positive. This allows the aromatic side chains to interact favorably in an edge-to-face orientation, with the hydrogen of
one in close proximity to the π-electrons of another. Face-to-face side chain stacking, akin to base stacking in nucleic acids, is also a possibility albeit with a slight offset to avoid electrostatic clash between the electron clouds.
8
unfolded state. Also, residue interactions required in the native state can be promoted by disulfide linkages [27].
1.1.3
–
Transition State EnsembleThe transition state is an unstable state, never significantly populated and hardly obtained from direct measurements, due the fact that the transition state ensemble (TSE) is always associated with a high
energy point on the folding pathway (Figure 2). Hence
any characterization of structural and energetic properties must be performed indirectly, through the determination of rate constants and the ways in which these rates are altered by specific perturbations. [28]
Figure2: Schematic representation of the energy diagram for the protein folding process.
The way to measure such rates is by using a technique developed by Fersht and coworkers, named φ-analysis[29]. This technique quantifies the energy of the TSE in response to mutations in the primary protein structure, comparative to that of the folded state.[30] This method provides means to identify interactions by specific amino acid side chains that stabilize the folding transition state [31]. This approach has been applied in a large number of proteins, such as Chymotrypsin inhibitor, myoglobin, SH3 domain and colicin immunity proteins – Im7 and Im9. In order to probe the energy landscape, the addition of chemicals such as denaturants and/or through changes in temperature so that the enthalpy, entropy, and heat capacity differences among native state, transition state and unfolded or denatured state are obtained.
Introduction
9
upon mutation and the difference in equilibrium free energy change upon mutation (ΔΔGf-u) (Equation 1).
Equation 1: Φ = (ΔΔGf-*) / (ΔΔGf-u)
1.1.4
–
Folding IntermediatesDetermining the mechanism by which a protein attains its unique native state requires the structural characterization of the entire folding pathway. As mentioned above, ϕ-value analysis has been useful for characterizing transition states. However, it is critical to also assess the partially folded states that become populated in the pathway to the native state [32]. The formation of intermediates for multidomain proteins is well established [33] but the case for small proteins remains unclear [34].
Many intermediates are formed via productive folding events, off-pathway species can become populated, and parallel routes are available to reach the native state [35].
Protein folding transitions are highly cooperative, implying that intermediate species cannot be detected. Some proteins establish populate equilibrium intermediates that are similar to their kinetic counterparts [36], but this does not appear to be universal. It is postulated that intermediates are always present [37]. However, due to their transient nature time-resolved experiments are required for their characterization.
Detection of folding intermediates has become a fairly common practice, but their detailed structural characterization continues to present a challenge.
1.1.5
–
Denatured state ensemble10
the low solubility, dynamic nature and the diversity of the unfolded ensembles as compared to the native state.
Regarding the characterization these states, chemical and thermal denaturation are the primary methodologies used to reach the unfolded state in solution. Guanidine hydrochloride (GuHCl) and urea are chemical agents widely used to perform protein denaturation, once it can have profound effects on protein stability and structure.
1.1.5.1 – Denaturation of Proteins by Urea
The ability of urea to denature proteins has been known since 1900. Tanford was the first to study quantitatively the unfolding of proteins by urea and showed that when a protein unfolds many nonpolar side chains and peptide groups that were buried in the folded protein are exposed to solvent in the unfolded state [40]. Since then, several works regarding the mechanism and the role of urea in the denaturation process have been performed. Despite the interest and effort to understand the role of urea, the molecular basis for its ability to denature proteins remains unknown. Experimental and theoretical studies have improved our understanding of urea solutions and how urea and water interact with peptide groups and nonpolar side chains. It has been proposed that urea may interact directly, by binding to the protein, or indirectly, by altering the solvent environment [41].
1.2
–
E colicin Immunity ProteinsColicins are proteins produced by some strains of Escherichia coli, as part of the SOS stress response to nutrient-limited environments. These proteins are plasmid encoded antibacterial proteins that kill sensitive strains, by binding to specific outer membrane receptors of target cell, controlling and manipulating the entry of specific nutrients such as ionophores, vitamins and nucleosides.
Introduction
11
In order to overcame, the survival problem of expressing a colicin with nuclease activity, E. coli expresses a specific antagonist protein called the immunity protein, which will bind to the colicin nuclease domain, protecting against the cytotoxicity activity. Each of the known E-group colicins (E1-E9) has it cognate inhibitor (Im1-Im9).
1.2.1 – Im7 and Im9 proteins
As pointed before, one of the most important questions to make regarding protein folding is how the sequence of a protein will determine the structural and thermodynamic characteristics of the native state and what is the mechanism underlying the folding phenomena? Answering those questions is not a straightforward process, and several authors had tried to address them by studying homologous proteins, among them two proteins of the family of DNase E-colicin immunity proteins, Im7 and Im9 were characterized in detail.
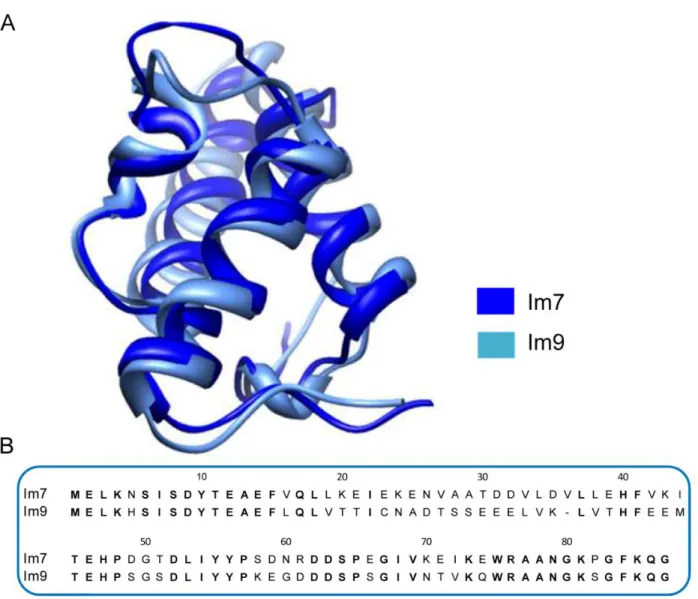
These two proteins have the same four helical fold (Figure 3 A) and exhibits 60%
sequence homology, as can be observed in Figure 3 B that shows the sequence alignment of
Im7 and Im9 determined using the Basic Local Alignment Search Tool (BLAST) [42].
Despite their similarity in structure and sequence, however, Im7 and Im9 fold with different kinetic mechanism in vitro; Im7 folding with a three-state mechanism, in which an on-pathway intermediate is populated early during folding, whilst Im9 folds with a two-state transition without populating intermediate.
The folding problem is currently addressed from two perspectives. The first, thermodynamic -centric, line of research is mainly concerned with the stability and uniqueness of the native fold and how it is encoded by the protein sequence. The second, kinetics-centric, line of research is concerned with the mechanisms and time scales for folding. The aim of this Thesis is the elucidation of the early events of folding phenomena in small class of immunity proteins (Im7 and Im9) using NMR spectroscopy as a tool.
Characterize unfolded ensembles in aqueous solution is the starting point for understanding the folding process, as well as to uncover the way in which amino acid sequence
encodes for a specific structure and provide insights about folding/unfolding transitions that
12
in atomic detail, of the beginning of Im’s folding and the disclosure of the full folding landscape.
Another aspect that would be clarified would be the role of urea during the unfolding events.
Figure 3 – Comparison of Im7 and Im9 protein structures and sequences. A) Ribbon diagram of the
Materials and Methods
13
2
–
Material and Methods
The technique that I have mainly used during my studies was NMR spectroscopy applied to the study of urea and temperature denatured states of colicin immunity proteins. NMR spectroscopy relies in good sample preparation, thus high yields of proteins with high degree of purity are essential to perform the technique.
2.1 – Molecular Biology
All proteins (Im7 and Im9) were previously produced and were available at the beginning of this Thesis. These proteins were over-expressed using plasmid pJR347, based on the expression vector pTrc99A and were kindly provided by Dr. Angelo Figueiredo (FCT-UNL) and Prof. G.R Moore (Univ. of East Anglia, UK). The system and strategy that they have used relies on E.coli expression system in minimal media.[43] The use of minimal media for protein overexpression is essential for isotopic-labeling of proteins, in which a source of 15N ammonium is provided to the bacterial strain in order to, overproduced isotopic label protein. Since, this step was previously prepared I will describe in detail the purification step of Im9 protein.
2.1.1 – Purification of Im9
In this work, Im9 protein was purified according to the protocol published in the literature. [44]. Overproduced Im9 protein was purified from 5L culture of E. coli cells, where the cells were harvested by centrifugation and resuspended in a 40ml solution (20 mM Tris/HCl, 5mM Imidazole and 500mM Sodium Chloride, pH 7.5), containing the protease inhibitor phenyl- methylsulphonyl fluoride (PMSF) at 1mM. The cells were broken using a French-press (French® Pressure Cell Press, Thermo scientific) operating at 10000-12000 psi.
Subsequent, cell debris was removed by centrifugation, using an Avanti J-26XPI Centrifuge (Beckman Coulter) at 18500 rpm, during 45min at 4 ºC, with a JA-10 fixed angle rotor.
14
2.1.1.1
–
Anion-exchange ChromatographyA 5ml HiTrap Q Sepharose HP column (Amersham Biosciences) coupled to an AKTA chromatographic system was used in the anion exchange chromatography step. The column was equilibrated with 5 column volumes of 50mM Tris-HCl, pH 7.5 (1mM EDTA, 1mM DTT, 50mM KCl) and the protein eluted with 100ml of elution buffer: 50mM Tris-HCl pH 7.5, 500mM KCl, 1mM DTT, 1mM EDTA. A flow rate of 5 ml/min was applied during all chromatographic process; 2.5 ml fractions size samples were collected.
The fractions containing the desired protein were pooled together and concentrated using a Stirred Cell 8050 from Millipore with a 3,000 MWCO porous membrane. Concentrated proteins were dialyzed overnight (using a Snakeskin 7,000 MWCO dialysis tubing) against a buffer solution containing 50mM Tris, 1mM EDTA and 1mM 2-mercaptoethanol at pH 7.5, 4ºC overnight.
The presence and purity of the protein was confirmed by sodium dodecyl sulphate polyacrylamide gel electrophoresis (SDS-PAGE). Samples of 20μL of each collected fraction
were boiled at 100 ºC with 10μL of 5x sample buffer for 5 min before loading 20μL of each into
the gel. The gel was stained with Coomassie brilliant blue for 15 min and then distained with a mixture of 10% methanol/10% acetic acid in water
2.1.1.2
–
Gel Filtration
A Superdex 75 gel filtration column with a bed volume of 300 ml was used for the final step of Im9 purification. The column was equilibrated with 1 liter of 50mM phosphate buffer pH 7.0, 200mM KCl. The sample loop (5ml) was partial filled with protein, i.e., 2.5ml of Im9 for high recovery. The sample volume loaded should be at maximum 50% of the loop total volume. The flow rate was setup to 5 ml/min.
Materials and Methods
15
2.1.1.3
–
Mass SpectroscopyMass spectroscopy was used to confirm the purity and identity of Im9. Time-of-Flight mass spectroscopy (TOF-MS) was performed and indicated that the final sample was highly pure, but evidences of dimerization was also found.
The molecular mass determined was 9691.33 Da for the 15N labeled sample. This value is in good agreement with the theoretical molecular weight, 9689.71, value calculated from the amino acid sequence, plus the isotope effect of 15N. The theoretical values were extracted from the Protein Calculator website: http://www.scripps.edu/~cdputnam/protcalc.html, accessed February 22, 2012.
2.2 – NMR Spectroscopy studies
All NMR experiments were performed on a Bruker Avance II+ 600 MHz spectrometer at the Chemistry Department of Faculdade de Ciências e Tecnologia da Universidade Nova de Lisboa, part of the National NMR Network (PTNMR), equipped with a triple resonance probehead cryoprobe.
All spectra acquired, 1H chemical shifts were referenced directly to external DSS, and the 15N chemical shifts indirectly using the protocol described by Wishart and coworkers [45].
NMR data, were processed using NMRPipe [46] and analyzed using CCPNMR [47].
In all cases, data was processed with a skewed cosine-bell apodization function and zero-filling (one time) was used in all dimensions.
2.2.1 – Urea titration
16
Urea-protein samples were then allowed to reach the equilibrium and the full dissolution after 1 hour before NMR acquisition. NMR experiments were acquired at 10 ºC at different urea concentrations, ranging from 0 to 6M for Im7 wild-type protein, and from 0 to 8M urea for Im9 wild-type protein.
1H-15N-HSQC spectra were acquired using a fast HSQC pulse sequence, where the great advantage, comparing to the traditional HSQC, is the absence of additional radio frequency (RF) pulses to avoid water saturation, which leads to a more rapid optimization of the pulse sequence. [50]
The 1H-15N HSQC spectra were recorded with the following parameters: 2048 (1H) and 256 (15N) complex points with 32 scans for each fid for Im7 and 16 scans for Im9. For Im7, the spectral widths were 7690 Hz for 1H and 1680 Hz for 15N, where the offset carrier frequencies were set to 2783.2 Hz (1H) and 7175.66 Hz (15N). For Im9, the spectral widths were 8013 Hz for 1H and 2000 Hz for 15N, centered at 2802 Hz (1H) and 7175.66 Hz (15N).
2.2.2 – Temperature Denaturation
Protein NMR samples contained 0.4mM protein were dissolved in 50mM sodium phosphate buffer and 90% H2O/10% 2H2O at pH 7. All samples were equilibrated during 15min at the experiment temperature before NMR acquisition. As described in section 2.2.1, a fast HSQC pulse sequence was used for all spectra.
NMR experiments were acquired at different temperatures, ranging from 283K to 323K for Im7 and Im9 wild-type proteins. The 1H-15N HSQC spectra were recorded with the following parameters: 2048 (1H) and 256 (15N) complex points with 16 scans for each fid for Im7 and Im9. For Im7, the spectral widths were 7944.9 Hz for 1H and 1659.4 Hz for 15N, where the offset carrier frequencies were set to 2788.4 Hz (1H) and 7175.7Hz (15N). For Im9, the spectral widths were 7692.3 Hz for 1H and 1680.0 Hz for 15N, centered at 2807.9 Hz (1H) and 7175.66 Hz (15N).
2.2.3 – Combined Chemical Shift
Materials and Methods
17
Equation 2:
Δ
𝛿𝑐𝑜𝑚𝑏
=
√
where ΔδH and ΔδN are the chemical shifts of proton and nitrogen, respectively and wi is a weighting factor which accounts for differences in sensitivity of different resonances in an amino acid (e.g. amide 1H and 15N). When chemical shifts are expressed in ppm a suitable estimate for the weighting factors is given by[51]:
Equation 3:
𝑤𝑖
=
with γi and γH the magnetogyric ratio of nucleus i and the proton, respectively.
In order to calculate the combined chemical shift, the first step is to perform the pick picking of the 1H-15N-HSQC spectrum. After all resonances picked, the next step is to assign each resonance to a specific residue. In this work, a file with the chemical shifts already deposited in BMRB was used. The file code for protein Im7 and Im9 was 7188 and 4115 respectively.
In order to decide whether a given residue belongs to the class of interacting or non-interacting residues was calculated a cutoff value. In a first approximation, the chemical shift distributions of the non-interacting residues can be assumed to follow a normal distribution with
Results
19
3 – Results
3.1
–
Purification and biochemical characterization of Im7 and Im9Im7 was previously produced and purified, and was available at the beginning of this Thesis. In the first stage of this work, Im9 was purified by two chromatographic methods: Anion-Exchange chromatography and Gel Filtration.
The protein Im9 exhibits a theoretical isoelectric point of 4.53, calculated using the bioinformatics tool ProtParam from Expasy server [52]. After this purification step the majority of the contaminants were removed. Despite highly efficient, this chromatographic step needs to be complemented with a Gel Filtration chromatographic step. The molecular weight of Im9 is 9.7 kDa (theoretical value determined with Compute pI/Mw tool [53]). After each chromatographic method the purity of this protein was evaluated by SDS-PAGE (Figures 4 and 5) and one intense band was obtained in the expected MW region (~11kDa), after the final
purification step (Figure 5).
The purity of Im9 was further confirmed by MALDI-TOF-MS (Figure A1, Appendix A).
20
Figure 4: SDS-PAGE 15% gel of Im9 fractions after Anion-Exchange Chromatography. Lane 3 – MW
markers; Lane 1-2 and 4-15: fractions obtained after Anion-Exchange Chromatography.
Figure 5: SDS-PAGE 15% gel of Im9 fractions after Gel Filtration. Lane 1 – MW markers; Lanes 2-9 –
Results
21
3.2
–
NMR experiments3.2.1
–
Protein denaturation process
A series of NMR experiments were acquired to evaluate the residues involved in the Im7 and Im9 unfolding process induced by increasing amounts of urea or increasing temperature. In order to achieve this, 1H-15N HSQC spectra for the Im7 and Im9 protein were acquired and compared to the corresponding spectra described in the literature, as a starting point for the following approaches:
- The chemical shift files deposited in BMRB for Im7 and Im9, 7188 and 4116 respectively, were used to perform the assignment.
- The protein denaturation process was evaluated by probing the chemical shift perturbation of the backbone signals of Im7 and Im9, either:
a) with increasing temperature, or
b) in presence of increasing amounts of urea.
The NH backbone chemical shift perturbations were monitored by recording a series of 1H-15N HSQC NMR spectra (
Figures 6 and 9, Appendix A2 and A3).
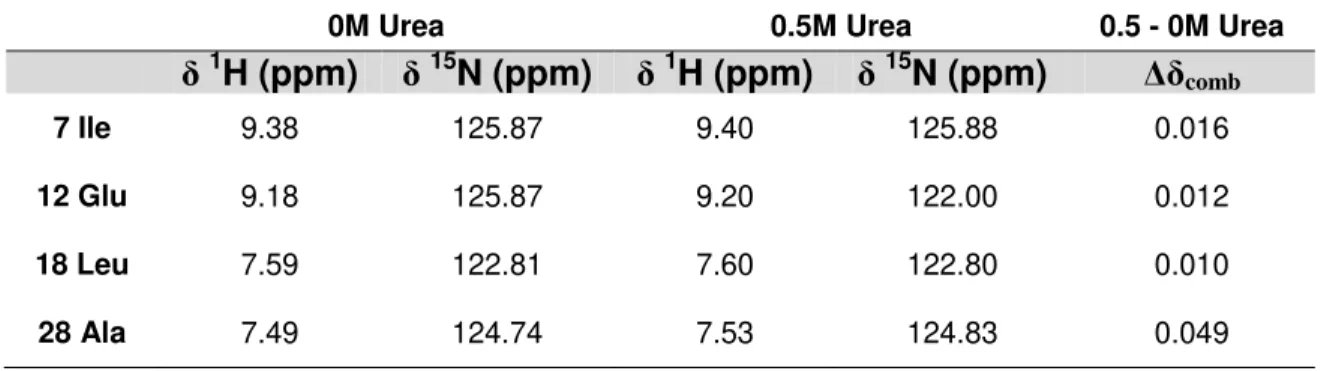
After the assignment of the NH backbone signals, a table with 1H and 15N resonances of each residue is created for each set of experiments, as exemplified in Table 1 for condition b.
(all data referent to the chemical shifts are presented in Appendix B1 and B2).
Table 1:Example of the tables created and the results treatment preformed.
0M Urea 0.5M Urea 0.5 - 0M Urea
δ
1H (ppm)
δ
15N (ppm)
δ
1H (ppm)
δ
15N (ppm)
Δδ
comb
7 Ile 9.38 125.87 9.40 125.88 0.016
12 Glu 9.18 125.87 9.20 122.00 0.012
18 Leu 7.59 122.81 7.60 122.80 0.010
22
In order to better represent the distribution of perturbed and not perturbed residues the
combined chemical shift perturbation, Δδcomb, were calculated and a cut-off line determined, as explained in section 2.2.3, for each step of urea or temperature gradient. The results are summarized below for the two conditions under study.
a) Protein denaturation with increasing temperature
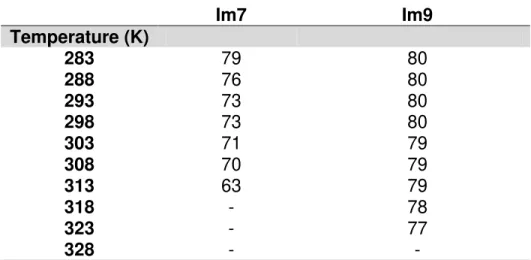
The majority of resonances from the native conformation assigned for both proteins in the thermal denaturation process are represented in Table 2. (All data referent to the chemical shifts are presented in Appendix B3 and B4)
Table 2: Number of residues assigned during thermal denaturation.
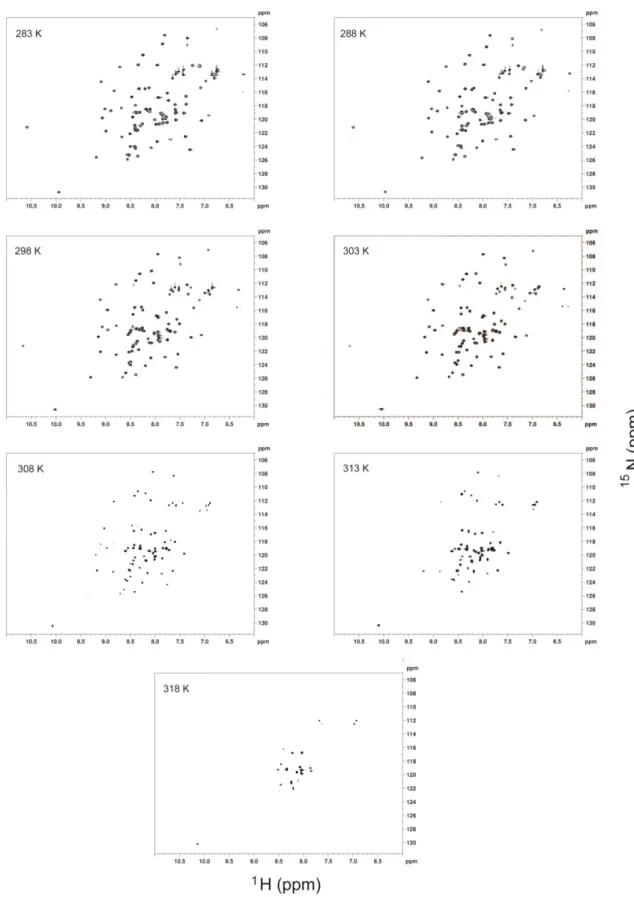
Figure 6 and Appendix A2 show 1H-15N HSQC spectra of Im7 and Im9 respectively at various temperatures. With increasing temperature, the signals were distributed in a narrower region in the spectrum, leading to a loss of tertiary structure at 318K for Im7 and 328K for Im9.
Im7
Im9
Temperature (K)
283
79
80
288
76
80
293
73
80
298
73
80
303
71
79
308
70
79
313
63
79
318
-
78
323
-
77
Results
23
Figure 6: 1H-15N HSQC spectra of Im7 at different temperatures. The temperatures used in each
24
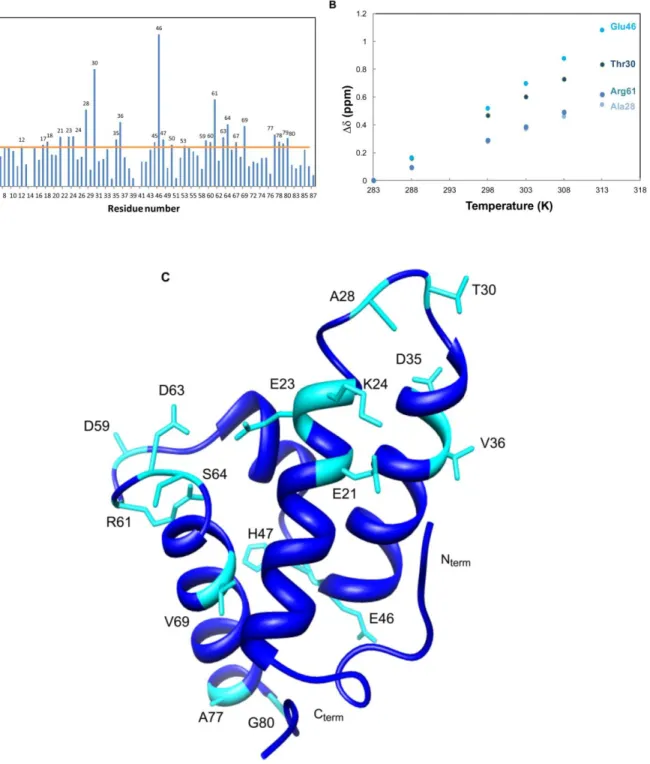
The perturbation induced by temperature clearly shows that most changes occur for residues Glu12; Gln17; Leu18; Glu21; Glu23; Lys24; Ala28; Thr30; Asp35; Val36; Thr45; Glu46; His47; Gly50; Leu53; Asp59; Asn60; Arg61; Asp62-63; Ser64; Gly67; Val69; Ala77-78; Asn79 and Gly80 for protein Im7 (Figure 7 A and B).
Figure 7:A) Im7 backbone amide chemical shift variations between 283K and 313K; B) Evolution of Δδ
with temperature for the most affected residues; C) Structure of Im7 (PDB: 1AYI), which highlights the
Results
25
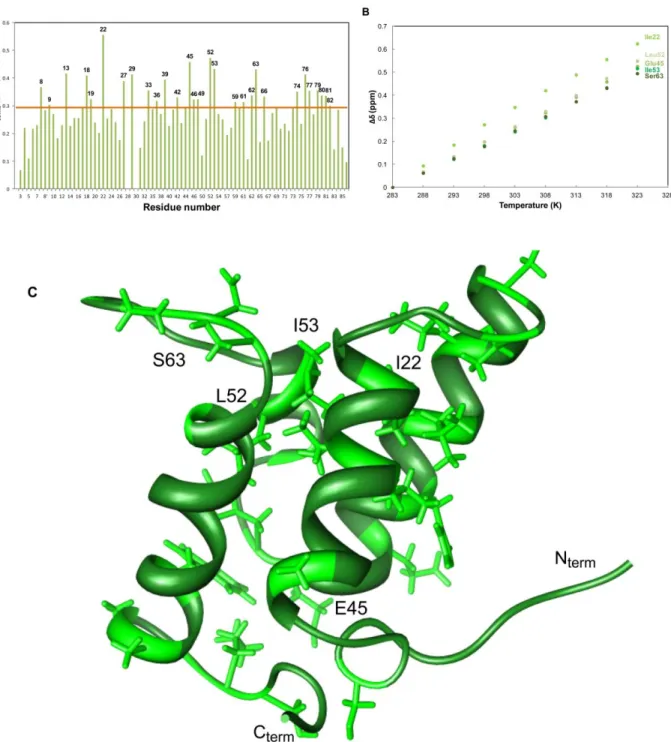
For protein Im9 the same approach was taken, and the major perturbations occurred for Ser8; Ala13; Leu18; Val19; Ile22; Thr27; Ser29; Leu33; Leu36; His39; Glu42; Glu45;His46; Gly49; Leu52; Ile53; Gly59; Asp61; Asp62; Ser63; Gly66; Trp74; Ala76; Ala77; Gly79; Lys80 and Ser81 (Figure 8 A and B).
Figure 8:A) Im9 backbone amide chemical shift variations between 283K and 323K; B) Evolution of Δδ
with temperature for the most affected residues; C) Structure of Im9 (PDB: 1IMQ), which highlights the
26
b) Protein denaturation in presence of increasing amounts of urea.
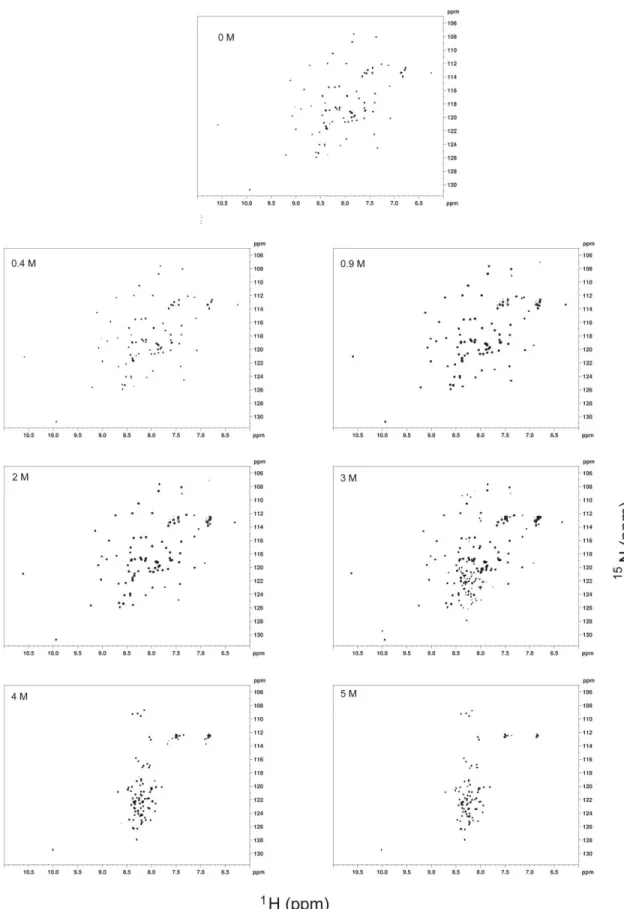
To check whether the proteins reach similar states at a given concentration of urea or if the denaturation pathway is identical, 1H-15N HSQC spectra were acquired with samples prepared starting from a folded protein, as well as with those prepared starting from protein denatured in 6 M and 8M of urea (Figure 9). In the absence of urea, the spectrum is typical of a well-folded protein with good dispersion of peaks. At 3 - 4 M urea, the HSQC spectra have signatures of both folded species (well-dispersed peaks) as well as of partially unfolded species. From 5 M to 6 M urea, the spectra are indicative of largely unfolded protein, with all the peaks appearing in a very narrow amide proton chemical shift range.
The majority of resonances from the native conformation assigned for both proteins in the chemical denaturation process are represented in Table 3.
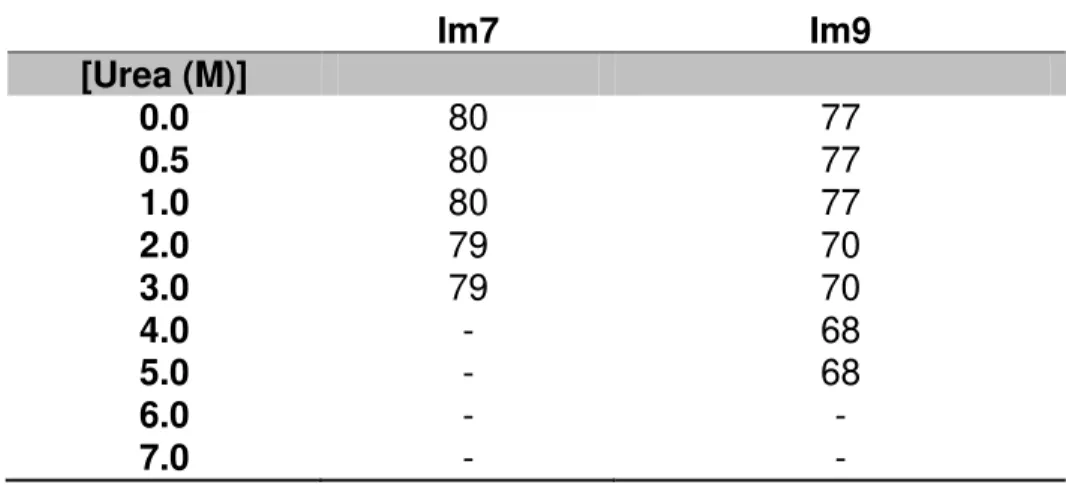
Table 3: Number of residues assigned during urea denaturation.
Figure 9 and Appendix A3 show 1H-15N HSQC spectra of Im7 and Im9 respectively at different concentration of urea. In the absence of urea, 1H-15N HSQC spectrum presents a good signal dispersion which indicates a three dimensional structure in solution (folded). On the other hand, in the presence of increasing amounts of urea is observed a loss of tertiary structure followed by a narrower distribution of the signals in the 1H-15N HSQC spectra.
Im7
Im9
[Urea (M)]
0.0
80
77
0.5
80
77
1.0
80
77
2.0
79
70
3.0
79
70
4.0
-
68
5.0
-
68
6.0
-
-
Results
27
Figure 9: 1H-15N HSQC spectra of Im7 at different concentrations of urea. The urea concentrations
28
The perturbation induced by urea shows that most changes occur for residues Glu2; Asn5; Ser8; Glu21; Asn26; Ala28; Ala29; Thr30; Asp32; Val33; Val36; Glu39; Thr51; Asp52; Ser58; Asp59; Arg61; Asp62; Glu66; Ala77 and Asn79 for Im7 (Figure 10 A and B).
Figure 10:A) Im7 backbone amide chemical shift variations between native and 3M urea; B) Evolution of
Δδ with urea for the most affected residues; C) Structure of Im7 (PDB: 1AYI), which highlights the most
Results
29
For protein Im9, the perturbations induced by urea occur for residues Lys4; His5; Ala13; Thr20; Thr21; Thr27; Ser28; Glu30; His39; Gly49; Ser50; Asp51; Leu52; Gly59; Gly66; Asn69; Ala76 and Asn78 (Figure 11 A and B).
Figure 11:A) Im9 backbone amide chemical shift variations between native and 4M urea; B) Evolution of
Δδ with urea for the most affected residues; C) Structure of Im9 (PDB: 1IMQ), which highlights the most
30
The data obtained for thermal and chemical denaturation are summarized in Table 4,
where is possible to see a comparison between the two proteins. The regions containing the most perturbed residues are indicated for both proteins, as well as the nature of each residue above the cut-off line.
Table 4: Comparison of the chemical shift perturbation by thermal (T) and chemical (urea) denaturation of Im7 and Im9 proteins. The aromatic, negatively and positively charge and the aliphatic
residues are highlighted by symbols (ϴ), (-), (+), (ϒ) respectively. Chemical shifts variations larger than
the corrected standard deviation to zero were considered as significant and marked with the “x”.
Im7
Im9
Position T Urea Position T Urea
E2 (-) N-term x E2 (-) N-term
L3 (ϒ) N-term L3 (ϒ) N-term
K4 (+) N-term K4 (+) N-term x
N5 (ϒ) N-term x H5 (+) N-term x
S6 (ϒ) N-term S6 (ϒ) N-term I7 (ϒ) N-term I7 (ϒ) N-term
S8( ϒ) N-term x S8 (ϒ) N-term x
D9 (-) N-term D9 (-) N-term x
Y10 (ϴ) N-term Y10 (ϴ) N-term
T11 (ϒ) N-term T11 (ϒ) N-term
E12 (-) Helix I x E12 (-) Helix I
A13 (ϒ) Helix I A13 (ϒ) Helix I x x
E14 (-) Helix I E14 (-) Helix I
F15 (ϴ) Helix I F15 (ϴ) Helix I
V16 (ϒ) Helix I L16 (ϒ) Helix I
Q17 (ϒ) Helix I x Q17 (ϒ) Helix I
L18 (ϒ) Helix I x L18 (ϒ) Helix I x
L19 (ϒ) Helix I V19 (ϒ) Helix I x
K20 (+) Helix I T20 (ϒ) Helix I x
E21 (-) Helix I x x T21 (ϒ) Helix I x
I22 (ϒ) Helix I I22 (ϒ) Helix I x
E23 (-) Helix I x C23 (ϒ) Helix I
K24 (+) Helix I x N24 (ϒ) Random coil
E25 (-) Helix I A25 (ϒ) Random coil
N26 (ϒ) Random coil x D26 (-) Random coil
V27 (ϒ) Random coil T27 (ϒ) Random coil x x
A28 (ϒ) Random coil x x S28 (ϒ) Random coil x
A29 (ϒ) Random coil x S29 (ϒ) Random coil x
T30 (ϒ) Random coil x x E30 (-) Helix II x
D31 (-) Helix II E31 (-) Helix II
D32 (-) Helix II x E32 (-) Helix II
V33 (ϒ) Helix II x L33 (ϒ) Helix II x
L34 (ϒ) Helix II V34 (ϒ) Helix II
D35 (-) Helix II x K35 (+) Helix II
V36 (ϒ) Helix II x x L36 (ϒ) Helix II x
Results
31
L38 (ϒ) Helix II T38 (ϒ) Helix II
E39 (-) Helix II x H39 (+) Helix II x x
H40 (+) Helix II F40 (ϴ) Helix II
F41 (ϴ) Helix II E41 (-) Helix II
V42 (ϒ) Helix II E42 (-) Helix II x
K43 (+) Helix II M43 (ϒ) Helix II
I44 (ϒ) Helix II T44 (ϒ) Helix II
T45 (ϒ) Helix II x E45 (-) Random coil x
E46 (-) Random coil x H46 (+) Random coil x
H47 (+) Random coil x P47 (ϒ) Random coil
P48 (ϒ) Random coil S48 (ϒ) Random coil
D49 (-) Random coil G49 (ϒ) Random coil x x
G50 (ϒ) Random coil x S50 (ϒ) Random coil x
T51 (ϒ) Helix III x D51 (-) Helix III x
D52 (-) Helix III x L52 (ϒ) Helix III x x
L53 (ϒ) Helix III x I53 (ϒ) Helix III x
I54 (ϒ) Helix III Y54 (ϴ) Helix III
Y55 (ϴ) Helix III Y55 (ϴ) Helix III
Y56 (ϴ) Helix III P56 (ϒ) Random coil
P57 (ϒ) Random coil K57 (+) Random coil
S58 (ϒ) Random coil x E58 (-) Random coil
D59 (-) Random coil x x G59 (ϒ) Random coil x x
N60 (ϒ) Random coil x D60 (-) Random coil
R61 (+) Random coil x x D61 (-) Random coil x
D62 (-) Random coil x D62 (-) Random coil x
D63 (-) Random coil x S63 (ϒ) Random coil x
S64 (ϒ) Random coil x P64 (ϒ) Random coil
P65 (ϒ) Helix IV S65 (ϒ) Helix IV
E66 (-) Helix IV x G66 (ϒ) Helix IV x x
G67 (ϒ) Helix IV x I67 (ϒ) Helix IV
I68 (ϒ) Helix IV V68 (ϒ) Helix IV
V69 (ϒ) Helix IV x N69 (ϒ) Helix IV x
K70 (+) Helix IV T70 (ϒ) Helix IV
E71 (-) Helix IV V71 (ϒ) Helix IV
I72 (ϒ) Helix IV K72 (+) Helix IV
K73 (+) Helix IV Q73 (ϒ) Helix IV
E74 (-) Helix IV W74 (ϴ) Helix IV x
W75 (ϴ) Helix IV R75 (+) Helix IV
R76 (+) Helix IV A76 (ϒ) Helix IV x x
A77 (ϒ) Helix IV x x A77 (ϒ) Helix IV x
A78 (ϒ) Helix IV x N78 (ϒ) C-term x
N79 (ϒ) Helix IV x x G79 (ϒ) C-term x
G80 (ϒ) C-term x K80 (+) C-term x
K81 (+) C-term S81 (ϒ) C-term x
P82 (ϒ) C-term G82 (ϒ) C-term x
G83 (ϒ) C-term F83 (ϴ) C-term
F84 (ϴ) C-term K84 (+) C-term
K85 (+) C-term Q85 (ϒ) C-term
Q86 (ϒ) C-term G86 (ϒ) C-term
Discussion
33
4
–
DiscussionIn this work, two different approaches to promote the denaturation/unfolding of both Im7 and Im9 where followed in order to allow a comparative perspective towards the residues more affected by a physical effect, such as temperature, and by a chemical agent, urea.
1H-15N HSQC spectra were used in order to map the urea or temperature induced perturbations into the protein. The dispersion of signals in the 1H-15N HSQC spectrum can be used to map the changes of the chemical shift of the individual residues, when going from a folded to an unfolded protein as shown in Figure 12 .
Figure 12: 1H-15N-HSQC spectra at 600 MHz of native Im7 in 50mM phosphate buffer, pH 7, in 10%
2
H2O, at 10 ºC. Spectrum A: protein Im7 without urea; Spectrum B: protein Im7 in 6M urea.
A well dispersed spectrum, as shown in Figure 12A, evidences that the protein is well
structured, organized in a three dimensional structure, reflecting individual and local environments for the different residues. In the other hand, Figure 12B exhibits a narrow
distribution of signals in the spectrum, which is an indicator that the protein is in a
34
denatured/unfolded conformation, behaving like a random coil, leading to a more similar environment for all residues.
This change in the 1H, 15N – HSQC is observed despite the denaturing method used, for both Im7 and Im9 proteins, leading to two questions; are the pathways and the forces implied in thermal denaturation the same in urea? Being two homologous proteins, why is the folding pathway different?
In Table 4 (section 3.2), we can observe the distribution of the affected residues in the
native structure of both proteins.
The temperature dependence of proton HN chemical shifts was observed long ago, but its mechanism is still not well understood. Temperature coefficients are almost always negative (a decrease in chemical shift value as the temperature is increased) and it has been shown that temperature coefficients in proteins are determined mainly by local melting of the structure, and not necessarily by the strength of hydrogen bonds to the amide. However, there is a tendency for (a) intramolecular hydrogen-bonded amides to have a smaller (less negative) coefficient, and (b) strongly hydrogen-bonded amides to have a larger coefficient, because the same fractional loss in structure gives rise to a larger change in shift.
Recently, by correlating temperature coefficients with 3hJ
NC’ it has been suggested by computational studies that the hydrogen bond distance expansion is the main factor contributing to the1HN chemical shift temperature dependence. [55]
In our work, instead of the amide proton temperature coefficient, we used the combined chemical shift. The combined chemical shift is commonly used to perform chemical shift mapping of protein-protein or protein-ligand interactions, we choose to use this method in order to evaluate the specific changes induced by temperature and to compare them with the ones induced by urea.
Discussion
35
Following the evolution of those residues (figure 7B), we can observe that the Δδcomb/ΔT is not the same for all residues and follows the order Glu46 > Thr30 > Arg61 > Ala28. This shows that temperature shifts can be used to measure of the capability of the residue to become unstructured as the temperature is raised. The largest change for Glu46 must be related with the position of this residue at the end of helix II, relatively unrestrained.
When comparing with Im9, the first observation is that the collapse temperature is different, being 318K for Im7 and 328K for Im9, which is in accordance with the fact that Im7 is significantly less stable than Im9 (ΔΔG 9.3 kJ/mol)[56]. Im9 protein also displays the most perturbed residues in the loop regions and at the edges of α-helices, but we can clearly observe a more global influence of temperature, that the one presented for Im7. The relevant residues
considered for Im9 exhibits values for Δδcomb, between 0.3 and 0.6, while for Im7 we can
obtain values for Δδcomb between 0.3 and 1.2.
With the sets of experiments performed for temperature, we realized that a global effect, responsible for disruption of hydrogen bonds, will lead to the loss of the secondary and tertiary structure.
Using urea as a denaturant, the same approach was made for Im7 and Im9, and in figure 10 we have once more represented the relevant residues, as well the representation of those residues in Im7 three-dimensional structure. As described in the previous section Glu2; Asn5; Ser8; Glu21; Asn26; Ala28; Ala29; Thr30; Asp32; Val33; Val36; Glu39; Thr51; Asp52; Ser58; Asp59; Arg61; Asp62; Glu66; Ala77 and Asn79 are the most affected residues upon addition of urea, being located on loop regions and at the edges of the four helices. When we make a closer look about the nature of these residues (Table 3), we identify that most negatively charged residues, Glu21; Asn26; Glu39; Asp59; Asp62; Glu66, are located at the edges of helix I, II and IV, being the rest of relevant residues aliphatic and located at loop regions.
In the case of protein Im9, the interaction with urea occur for residues Lys4; His5; Ala13; Thr20; Thr21; Thr27; Ser28; Glu30; His39; Gly49; Ser50; Asp51; Leu52; Gly59; Gly66; Asn69; Ala76 and Asn78. A brief comparison between the profile for Im7 and Im9 displayed in Figures 10 and 11 reveal a more located perturbation for Im7 located in the regions formed by residues
26-36 and 62-66, which is not observed for Im9 that exhibits an overall perturbation.
36
correlation between dynamic residues (most affected by temperature) and the residues in the regions most perturbed by urea. The results shown that entire loop regions on both proteins may act as concerted units during the unfolding process, and contribute for favorable interactions that delimit and stabilize native-like structural features on the urea-unfolded state, allowing buried regions to be less solvent exposed. This important contribution of the loops and their inherent dynamics will certainly be important for the significantly number of possible conformations and accessible folding pathways routes towards its minimum native state.
The hydrogen exchange rate of a certain amide group in a protein can also be used to study solvent accessibility and hydrogen bond strength. Because non-hydrogen bonded protons are in constant exchange with the solvent, their exchange rates depend on their protection level and bond strength. Protons participating in hydrogen bonds, for instance, will be more protected and thus have lower exchange rates than those who are solvent exposed.
In Table 5 the published hydrogen exchange rates of Im7 are compared with the
temperature and urea induced chemical shift perturbations. Only two residues with measurable exchange rates are among the ones perturbed by urea. This means that urea targets preferably residues that are accessible and solvent exposed. On the contrary, about 1/3 of the residues with significant temperature induced shifts have measurable exchange rates. This evidences that temperature shifts also reflect the strength of hydrogen bonds that are important for the stabilization of secondary structure elements.
Discussion
37
Table 5: Comparison between the hydrogen exchange rates (kex) [57] and the chemical shift
perturbation by thermal (T) and chemical (urea) denaturation (this work) of Im7 protein. Chemical
shifts variations larger than the corrected standard deviation to zero were considered as significant and
marked with the “x”.
Location T Urea kex (h
-1
)
Asp9 Random Coil 0.3193
Tyr10 Random Coil 0.0353
Thr11 Random Coil 0.0333
Val16 Helix I 0.0022
Gln17 Helix I x 0.0075
Leu18 Helix I x 0.0054
Glu21 Helix I x x 0.0764
Glu23 Helix I x 0.4505
Leu37 Helix II 0.4266
Leu38 Helix II 0.0888
Phe41 Helix II 1.8620
Val42 Helix II 0.0072
Leu53 Helix III x 5.1000
Ile54 Helix III 2.9000
Tyr55 Helix III 3.8000
Tyr56 Helix III 2.1000
Gly67 Helix IV x 0.3875
Val69 Helix IV x 0.0172
Ile72 Helix IV 0.0159
Lys73 Helix IV 0.0383
Glu74 Helix IV 0.0488
Trp75 Helix IV 0.0392
Arg76 Helix IV 0.0452
Ala77 Helix IV x x 0.0896
Ala78 Helix IV x 0.3076
Conclusios
39
5
–
ConclusionsIn this work following the two approaches, Temperature and Urea, to promote the unfolding of Im7 and Im9, we were able to point out that urea targets preferably residues that are accessible and solvent exposed, while temperature results show that the residues most perturbed with increasing temperature are mostly located in loop regions between helices
The results shown that entire loop regions on both proteins may act as concerted units during the unfolding process, and contribute for favorable interactions that delimit and stabilize native-like structural features on the urea-unfolded state, allowing buried regions to be less solvent exposed. These regions are clearly very important due to their inherent dynamics that will certainly be important for the significantly number of possible conformations and accessible folding pathways routes towards its minimum native state.
![Figure 1: Schematic organization levels of proteins [1]](https://thumb-eu.123doks.com/thumbv2/123dok_br/16496063.733566/23.918.435.851.542.959/figure-schematic-organization-levels-proteins.webp)