ABSTRACT
Introduction: The increase in the prevalence of obesity entails the need for accurate low-cost methods to estimate body fat percentage (BF%). Objective: The aim of this study was to develop mathematical models to estimate the BF% of young women from southern Brazil using inexpensive equipment, based on body circum-ferences (BC), considering the shortage of specific studies of this population. Methods: Subjects were women (n=130) aged 18 to 35 years (26.06±4.41 years), from the city of Curitiba. Body mass and stature were measured and used to estimate body mass index (BMI), while BC measurements of the arm, forearm, waist (narrowest point and umbilicus), abdomen, hip, thigh and leg were taken for use in the mathematical models. Dual-Energy X-Ray Absorptiometry (DXA) equipment recorded the BF%. Pearson’s correlation was used for anthropometric variables and age in association with BF%. The indicators with best correlations were used to estimate linear regression mathematical models for prediction of BF%. The results of the two models and of nine anthropometric equations were compared to those obtained with the DXA using Pearson’s correlation coefficient and paired t-test. Results: Age was not significantly correlated with BF% (r=0.113 and p=0.200). The BCs with the highest correlations with BF% were abdomen, hip and waist – umbilicus (r=0.697, 0.682, 0.660, respectively, and p<0.001). Eight equations showed positive correlation with BF%, but only the results obtained with the models estimated in this study did not differ from those of DXA, with paired t-test. Mathematical models were developed with three (r=0.744, r²=0.554; t=0.16 and p=0.869) and six (r=0.768, r²=0.591; t=–0.04 and p=0.967) anthropometric variables. Conclusion: The use of mathematical models developed for estimating BF% based on body circumference and body mass is considered feasible. Level of Evidence II; Diagnostic studies - Investigating a diagnostic test.
Keywords: Body composition; X-ray absorptiometry; Anthropometry; Women.
RESUMO
Introdução: O aumento da prevalência de obesidade implica a necessidade de métodos precisos e de baixo custo para estimar o percentual de gordura corporal (GC%). Objetivo: O objetivo deste estudo foi desenvolver modelos ma-temáticos para calcular o GC% de mulheres jovens do sul do Brasil, usando equipamentos de baixo custo, com base em circunferências corporais (CC), considerando a escassez de estudos específicos dessa população. Métodos: Foram avaliadas mulheres (n = 130) com idade de 18 a 35 anos (26,06 ± 4,41 anos), da cidade de Curitiba. A massa corporal e a estatura foram aferidas para estimar o índice de massa corporal (IMC), e CC de braço, antebraço, cintura (parte mais estreita e cicatriz umbilical), abdome, quadril, coxa e perna foram mensuradas para uso nos modelos matemáticos. Um equipamento de absorciometria com raios-X de dupla energia (DEXA) registrou o GC%. A correlação de Pearson foi usada para as variáveis antropométricas e a idade associadas ao GC%. Os indicadores com as melhores correlações foram usados para estimar os modelos matemáticos de regressão linear para prever o GC%. Os resultados dos dois modelos e de nove equações antropométricas foram comparados com os da DEXA, por meio do teste t pareado e da correlação de Pearson. Resultados: A idade não se correlacionou significativamente com GC% (r = 0,113 e p = 0,200). As CC com maiores valores de correlação com GC% foram abdome, quadril e cintura – cicatriz umbilical (r = 0,697, 0,682, 0,660, respectivamente, com p < 0,001). Oito equações mostraram correlação positiva com GC%, mas somente os resultados dos modelos estimados neste estudo não diferiram daqueles da DEXA pelo teste t pareado. Os modelos matemáticos foram desenvolvidos com o uso de três (r=0,744 e r²=0,554; t=0,16 e p=0,869) e seis (r=0,768 e r²=0,591; t=–0,04 e p=0,967) variáveis antropométricas. Conclusões: É possível usar modelos matemáticos de GC% com base em circunferências corporais e massa corporal. Nível de Evidência II; Estudo diagnóstico - Investigação de um exame para diagnóstico.
Descritores: Composição corporal; Absorciometria por raios X; Antropometria; Mulheres.
RESUMEN
Introducción: El aumento de la prevalencia de obesidad implica la necesidad de métodos precisos y de bajo costo para estimar el porcentaje de grasa corporal (GC%). Objetivo: El objetivo de este estudio fue desarrollar modelos matemáticos para calcular el GC% de mujeres jóvenes del sur de Brasil, usando equipos de bajo costo, con base en circunferencias corporales (CC), considerando la escasez de estudios específicos de esa población. Métodos: Fueron
ESTIMATION OF FEMALE BODY FAT PERCENTAGE BASED
ON BODY CIRCUMFERENCES
ESTIMATIVA DE PORCENTAGEM DE GORDURA CORPORAL EM MULHERES COM BASE
EM CIRCUNFERÊNCIAS CORPORAIS
ESTIMACIÓN DEL PORCENTAJE DE GRASA CORPORAL EN MUJERES BASADA EN
CIRCUNFERENCIAS CORPORALES
Ana Carla Chierighini Salamunes1 (Physical Education Professional) Adriana Maria Wan Stadnik1 (Physical Education Professional) Eduardo Borba Neves2 (Physical Education Professional and Physiotherapist)
1. Universidade Tecnológica Federal do Paraná (UTFPR), Programa de Pós-Graduação em Engenharia Biomédica, Curitiba, PR, Brazil. 2. Instituto de Pesquisa da Capacitação Física do Exército (IPCFEx), Rio de Janeiro, RJ, Brazil.
Correspondence:
Ana Carla Chierighini Salamunes Universidade Tecnológica Federal do Paraná (UTFPR), Programa de Pós-Graduação em Engenharia Biomédica. Av. Silva Jardim, 807, Bloco V3, Curitiba, PR, Brazil. 80230-000.
ORIGINAL ARTICLE
ARTIGO ORIGINAL
98
evaluadas mujeres (n = 130) con edad entre 18 a 35 años (26,06 ± 4,41 años) de la ciudad Curitiba. La masa corporal y la altura fueron evaluadas para estimar el índice de masa corporal (IMC), y CC de brazo, antebrazo, cintura (parte más estrecha y cicatriz umbilical), abdomen, cadera, muslo y pierna fueron mensurados para uso en los modelos matemáticos. Un equipamiento de absorciometría con rayos X de doble energía (DEXA) registró el GC%. Se utilizó la prueba de correlación de Pearson entre GC% y variables de edad y antropometría. Los indicadores con las mejores correlaciones fueron utilizados en la estimativa de modelos matemáticos de regresión linear, para la predicción del GC%. Los resultados de los modelos y de nueve ecuaciones antropométricas fueron comparados con el de la DEXA, por medio del test t pareado y de la correlación de Pearson. Resultados: La edad no se correlacionó con GC% (r = 0,113 y p = 0,200). Las CC con mayores valores de correlación con GC% fueron abdomen, cadera y cintura – cicatriz umbilical (r = 0,697, 0,682, 0,660, respectivamente, con p < 0,001). Ocho ecuaciones mostraron correlación positiva con GC%, pero solamente los resultados de los modelos estimados en este estudio no diferían de aquellos de la DEXA por el test t pareado. Los modelos matemáticos fueron desarrollados con el uso de tres (r = 0,744 e r² = 0,554; t = 0,16 y p = 0,869) y seis (r = 0,768 y r² = 0,591; t = –0,04 y p = 0,967) variables antropométricas. Conclusiones: Es posible utilizar modelos matemáticos de GC% basados en circunferencias corporales y masa corporal. Nivel de Evidencia II; Estudio Diagnóstico - Investigación de un examen para diagnóstico.
Descriptores: Composición corporal; Absorciometría por rayos X; Antropometría; Mujeres.
Article received on 06/08/2017 accepted on 09/05/2017 DOI: http://dx.doi.org/10.1590/1517-869220182402181175
INTRODUCTION
Excess body fat is considered a risk factor for various diseases, such as type 2 diabetes, arterial hypertension, stroke and coronary heart di-sease.1 In women, the associated risk extends to complications during
pregnancy, such as pre-eclampsia and hypothyroxinemia, and also endometrial cancer type I.2
The World Health Organization has reported an increase in the prevalence of overweight and obesity in several countries, including Brazil,1 which evidences the need to estimate body composition
pre-cisely as a form of control and prevention. Different equipments and anthropometric variables have already been tested in this sense, in order to find effective, fast and low-cost methods to estimate body fat percentage (BF%).
Dual-Energy X-Ray Absorptiometry (DXA) is considered, by some authors, as a gold standard for estimating body composition. However, because it is an expensive, difficult-to-carry and radiation-emitting technology, its possibilities for large-scale use are limited.3
Bioelectri-cal impedance (BIA) is an alternative to DXA, although it may not be as accurate compared to the gold standard.3,4 This technology may
present imprecise data as a result of recent physical activity or alcohol consumption, on the same day or on the days before the exam, for example.5 It is common the estimation of equations aiming to predict
BF%, with low-cost variables such as the skinfold method and body circumferences (BC), using DXA or BIA as a parameter.
Among the anthropometric indicators of lower cost and faster implementation, the body mass index (BMI) is a highly used simple equation (body mass/stature²) that classifies individuals as underweight, normal weight, overweight and obesity I, II and III5. Although high BMI
has already been correlated with risk of arterial hypertension,1,6 the
me-thod is limited because it does not differentiate lean body mass and fat mass in its calculation, making it difficult to use it as a predictive value of body fat percentage BF% and abdominal obesity.7 As an alternative
to BMI, Bergman et al.8 proposed the body adiposity index (BAI), an
easily reproducible equation to estimate BF%. This, however, may not be accurate in several populations.9,10
Several authors proposed new alternatives with simple variables, but each one is based on a specific population. Few equations exist concerning south Brazilian population, especially if it refers to young women individuals. Therefore, this study aimed to develop mathematical models to estimate young south Brazilian women’s BF%.
MATERIALS AND METHODS
The present study is in accordance with the 2013 Helsinki Declaration and it was approved by the Research Ethics Committee of the Federal Technological University of Paraná, CAAE No. 53602116.3.0000.5547. All subjects signed an informed consent form before participation in the study.
This study aimed to develop easily reproducible and low cost math-ematical models to estimate the body fat percentage of young women from Southern Brazil, based on a DXA device.
Correlations between anthropometrics and BF% of DXA were calcu-lated. Variables with high significance were used to estimate two new regression models. The precision of these equations was tested, along with other models in literature, which used variables of body mass, stature and BC, or BMI, waist-to-height ratio (waist circumference/stature) and waist-to-hip ratio (waist circumference/hip circumference).
Sample consisted of 130 young women aged 18 to 35 years with BMI classified as normal weight (18.5 to 24.99 kg/m², n = 110) or overweight (25 to 29.99 kg/m², n = 20). Their ethnicity was predominantly caucasian, since south Brazilians descend mostly from European populations. However, Brazilian individuals’ genomes show significant characteristics from Amerindians, Africans and Europeans, hence the sample must not be classified as exclusively European.11 Only women without gestational
history and who had not performed aesthetic surgical procedures or bariatric surgery were included.
of the arm was measured at the midpoint between the acromion and the olecranon; BC of the forearm, abdomen, hip and leg were measured in the largest portion of each of these regions; waist was measured in the smallest portion between the 12th rib and the iliac crest and at the
level of the umbilicus; and in the thigh the reference was the midpoint between the inguinal line and the upper edge of the patella.12 All
mea-surements were performed twice, in circuit.
Statistical analysis
Normal distribution was analyzed with Kolmogorov-Smirnov test. Descriptive results are shown as mean ± standard deviation. Pearson’s correlation coefficient was calculated between BF% and the variables of age, BC, stature, body mass and BMI. Variables of which results obtained the highest statistical significance were used to estimate a mathemati-cal model of linear regression for the mathemati-calculation of BF%, this being the independent variable of body fat percentage obtained with DXA.
Results obtained with the two mathematical models (one based on six variables and one based on three variables) and those estimates with other nine different equations published in specialized literature (body adiposity index – BAI – by Bergman et al.;8 four models described by
Dumith et al.;13 the equation proposed by Kanellakis et al.;14 the model
of Gallagher et al.;15 and the one by Deurenberg et al.;16 as well as the
body density equation by Tran and Weltman,17 converted to BF% by the
equation of Siri)18 were compared with the BF% estimated with DXA, by
means of paired t-test and Pearson’s correlation coefficient. A significance level of 95% (p<0.05) was considered. All statistical tests were performed with SPSS Statistics software and Minitab.
RESULTS
All variables showed normal distribution. Mean BF% was 34.10 ± 4.58%. Age was the only variable that did not show significant correlation with BF%. Stature showed a significant value, but low, in relation to the BF%. Body mass, BMI and all BC variables showed a significant positive correlation with BF%. These results are presented in Table 1.
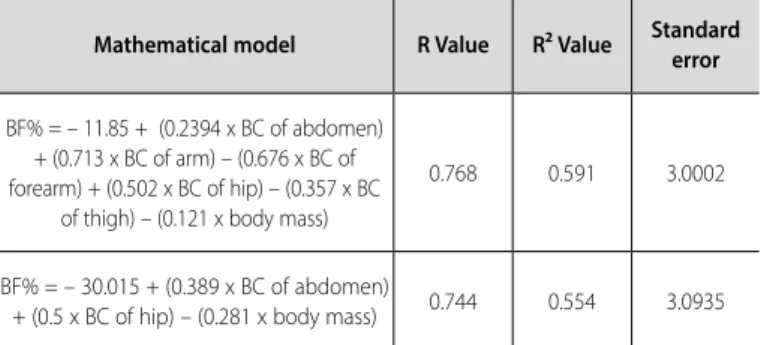
Mathematical models were tested by linear regression to estimate BF%. The ones which showed acceptable statistical significance were based on the values of: body mass and BC of arm, forearm, abdomen, hip and thigh; as well as body mass and BC of abdomen and hip. The models are presented in Table 2.
Among the equations published in literature which were tested in this study, only one, by Dumith et al.,13 had no significant correlation
with BF% from DXA. The best results were obtained using the methods of Kanellakis et al.14 and Tran and Weltman.17 Both mathematical
mod-els developed in this study showed better statistical results than other equations, and those were the only models which did not differ from BF% in paired t-test. These data are shown in Table 3.
DISCUSSION
Considering the need to estimate body composition with precision and accessibility, it was decided by the use of BC, because they are mea-sures of easy reproducibility and fast execution, which allow population analysis in large scale. The values with the highest correlations with BF% were identified in the waist, abdomen and hip regions. The latter can be explained by the profile of gynoid adiposity, the most frequent in females, which consists of the greater accumulation of adipose tissue in the lower limbs.19 The BC of the arm also showed a good positive
cor-relation with BF%, which can be explained by a greater accumulation of adipose tissue in the triceps region in women.20
For the mathematical model, the choice of the use of the abdomen BC was not only due to the higher correlation with the BF%, but also because abdominal obesity is related to arterial hypertension, the excess of triglycerides and total cholesterol,21-23 also helping to analyze
cardio-vascular risk factors. In addition, the BC and body mass model showed a higher correlation with BF% (r = 0.744) than the BMI (r = 0.610). For this population of young women in southern Brazil, therefore, the presented equation was more reliable than BMI, with the use of anthropometric indicators of similar reproducibility and low cost.
The BAI was developed by Bergman et al..8 It was proposed as
an alternative to BMI in detecting overweight and obesity, although, different from BMI, that one aimed to estimate BF%. In the pres-ent study, however, BMI (r = 0.610) was better correlated with BF% than BAI (r = 0.529). Cerqueira et al.9 found similar results, in a study
conducted in the state of Minas Gerais, in southeastern Brazil. In a sample of 104 adult and elder women, the BF% estimated by BAI was positively correlated with BF% with DXA (r = 0.605), but these were significantly different, with paired t-test (t = –7.07). The authors have also affirmed that the BAI equation overestimated the values of people with lower BF% and it underestimated those of people with higher BF%. The BAI equation appears not to have been explored in other regions of Brazil.
In other countries, similar results have been found between BAI and BMI. The BAI equation appeared to be more precise than BMI in men and women as a single group, but BMI was better related to BF% than BAI, when samples were stratified based on gender, in caucasian European population,10 and based on gender and ethnicity, in north-americans.24
Table 1. Correlations among age, anthropometrics and body fat percentage, from 130 young women.
Variable Mean ± Standard deviation
Pearson’s
correlation (r) p-value
Age 26.06 ± 4.41 years 0.113 0.200
Stature 1.63 ± 0.06 m 0.180a 0.040
Body mass 60.70 ± 8.59 kg 0.586a <0.001
Body mass index 22.85 ± 2.58 kg/m² 0.610a <0.001
Arm circumference 26.02 ± 2.58 cm 0.607a <0.001
Forearm circumference 22.41 ± 1.45 cm 0.357a <0.001
Waist circumference
(smallest portion) 69.26 ± 5.71 cm 0.615a <0.001
Waist circumference (umbilicus) 79.30 ± 7.65 cm 0.660a <0.001
Abdomen circumference 84.78 ± 6.96 cm 0.697a <0.001
Hip circumference 96.20 ± 6.04 cm 0.682a <0.001
Thigh circumference 52.48 ± 4.08 cm 0.471a <0.001
Leg circumference 34.91 ± 2.58 cm 0.426a <0.001 a. Significant correlations with BF% of DXA.
Table 2. Mathematical models for the estimation of the BF% of 130 young women and their regression parameters.
Mathematical model R Value R² Value Standard error
BF% = – 11.85 + (0.2394 x BC of abdomen) + (0.713 x BC of arm) – (0.676 x BC of forearm) + (0.502 x BC of hip) – (0.357 x BC
of thigh) – (0.121 x body mass)
0.768 0.591 3.0002
BF% = – 30.015 + (0.389 x BC of abdomen)
100
It is noteworthy that literature is scarce regarding the estimation of body composition of women in the southern region of Brazil, especially with low cost models, good reproducibility and a high number of research subjects. Alonso et al.25 developed, in the state of Paraná, as
the present study, a model of BF% of easy reproducibility, estimated by the Deurenberg et al.16 equation, which used as variables the gender,
BMI and age. It was considered that the results were satisfactory, but a small sample of 25 people (20 women) was used, and the parameter was BIA, which, as already presented, may not be as reliable as DXA. In addition, the sample consisted of different age groups, from 17 to 75 years, and it is not possible to state whether the model is suitable specifically for young adults. Findings of the present study, with DXA, differ from those of Alonso et al.,25 since the results obtained using
the Deurenberg et al.16 equation underestimated women’s BF%, with
significant results in paired t-test, although it had positive results in Pearson’s correlation coefficient.
Among the equations tested in this study, the four equations of Dumith et al.13 were developed with a south Brazilian sample (city of
Pelotas, Rio Grande do Sul state) of 54 undergraduate students (30 women) of physical education, aged 17 to 33 years. Each of the calcula-tions was based on age, gender and one anthropometric variable among wais-to-height ratio, waist-to-hip ratio, BMI or waist BC. Although the sample’s location and age were similar to those of the women tested in the present study, Dumith et al.13 equations were the ones which most
differed from BF% with DXA. Still, the equation based on waist-to-hip ratio did not show significant correlation with DXA. Such divergence might have been found because Dumith at al.13 equations had the SF
method as a parameter, not DXA, which may have led to a lower preci-sion. The cited authors have also found correlations of the Deurenberg et al.16 equationand the BMI of 0.75 and 0.79, respectively, with BF%,
against 0.595 and 0.610 of the present study.
In Santa Maria, in the state of Rio Grande do Sul, Rech et al.26 proposed
and validated three equations for the estimation of BF% of women be-tween 50 and 75 years of age, using DXA as a parameter. Two models included SF and age, and one included BC, SF and height, all estimated in a group of 60 subjects and tested in another of 15 subjects. Rech et al.27 also tested the validity of anthropometric equations in agreement
with DXA in an elderly population (n = 120 women and 60 men). The models chosen for analysis were based only on height, body mass, and BC. It is considered that both studies mentioned above have a good contribution to evaluate women from the southern region, based on methods of greater reliability, but not applicable to young adults, due to the age range of the population tested.
Other studies were carried out in the states of Santa Catarina and Rio Grande do Sul28 and in the city of Santa Maria-RS,29,30 but these
only counted on male subjects. For that matter, it is considered that the major contribution of this study is to present a low cost and easy reproducibility model for the estimation of BF% specifically for young women in the south of Brazil, based on a reliable method, DXA, having as sample 130 subjects.
The limitations of the present study refer mainly to the lack of variables that differentiate lean mass from adipose mass, since only BC and body mass were used in the estimation of the mathematical model. However, it is worth mentioning that a method of faster execution, lower cost and easy reproducibility was sought.
CONCLUSION
This study showed two new mathematical models to estimate BF% of south Brazilian young women. The variables of the model are easy to acquire and low cost, allowing their use in large populations, especially young women in southern Brazil, coupled with the greater accuracy of this equation compared to BMI. It is shown to be feasible the use of mathematical models developed for estimating the BF% based on body circumference and body mass. New studies with different populations can aid in the estimation of specific equations by region.
ACKNOWLEDGEMENTS
The authors thank professors responsible for Laboratory of Ergonom-ics (LAERG) and Laboratory of Biochemistry and Densitometry (LaBDen) from Technological Federal University of Paraná, for providing space and technical assistance.
All authors declare no potential conflict of interest related to this article. Table 3. Pearson’s correlation and paired t-test among anthropometry equations and body fat percentage of DXA, from 130 young women.
Equation Variables Estimated body fat percentage Pearson’s correlation Paired t-test
R value P-value T value P-value
Model with six variables Body mass and BC of arm, forearm, abdomen, hip and thigh 34.11 ± 3.52 0.768a <0.001 –0.04 0.967
Model with three variables Body mass and BC of abdomen and hip 34.05 ± 3.40 0.744a <0.001 0.16 0.869
Bergman et al.8 Stature and BC of hip 28.38 ± 2.88 0.529a <0.001 16.66 <0.001b
Deurenberg et al.16 Age and BMI 28.01 ± 3.37 0.595a <0.001 18.58 <0.001
Dumith et al.13 Age and BMI 24.30 ± 2.97 0.586a <0.001 30.02 <0.001b
Dumith et al.13 Age and BC of waist 22.69 ± 2.21 0.607a <0.001 35.31 <0.001b
Dumith et al.13 Age and waist-to-hip ratio 22.90 ± 0.95 0.106 0.228 27.90 <0.001b
Dumith et al.13 Age and waist-to-height ratio 22.59 ± 2,42 0.526a <0.001 33.69 <0.001b
Gallagher et al.15 Age and BMI 28.73 ±5.39 0.616a <0.001 13.82 <0.001b
Kanellakis et al.14 Stature and BC of forearm, waist (umbilicus) and hip 32.24 ± 4.45 0.737a <0.001 6.44 <0.001b
Tran e Weltman17 Stature, age, BC of abdomenc and hip 29.08 ± 4.48 0.701a <0.001 16.34 <0.001b
a Significant correlation with BF% of DXA;b.Significant difference compared to BF% of DXA; c. Considered as the mean value between both waist circumferences (smallest portion and umbilicus).
REFERÊNCIAS
1. World Health Organization. Global Status Report on Non-Communicable Diseases. 2014 [accessed on 2017
mai 31]. Available from: http://apps.who.int/iris/bitstream/10665/148114/1/9789241564854_eng.pdf?ua=1.
2. Nakamura K, Hongo A, Kodama J, Hiramatsu Y. Fat accumulation in adipose tissues as a risk factor for the development of endometrial cancer. Oncol Rep. 2011;26(1):65-71.
3. Melo GF de, Américo DR, Glaner MF. Fat-free mass in overweight and obese older women: analysis of concurrent validity of bioelectrical impedance equations. Rev Bras Cineantropom Desempenho Hum. 2015;17(5):583-91.
4. Faria ER, de Faria FR, Goncalves VSS, Franceschini Sdo C, Peluzio Mdo C, Sant’Ana LF, et al. Prediction of body fat in a dolescents: comparison of two electric bioimpedance devices with dual-energy X-ray absorptiometry. Nutr Hosp. 2014;30(6):1270-8.
5. Neves EB, Ripka WL, Stadnik AMW, Ulbricht L, Ripka WL. Comparação do percentual de gordura obtido por bioimpedância, ultrassom e dobras cutâneas em adultos jovens. Rev Bras Med Esporte. 2013;19(5):323-7.
6. Lam BCC, Koh GCH, Chen C, Wong MTK, Fallows SJ. Comparison of Body Mass Index (BMI), Body Adiposity Index (BAI), Waist Circumference (WC), Waist-To-Hip Ratio (WHR) and Waist-To-Height Ratio (WHtR) as predictors of cardiovascular disease risk factors in an adult population in Singapore. PLoS One. 2015;10(4):e0122985.
7. Rezende FAC, Rosado LEFPL, Franceschinni SCC, Rosado GP, Ribeiro RCL. Aplicabilidade do índice de massa corporal na avaliação da gordura corporal. Rev Bras Med Esporte. 2010;16:90-4.
8. Bergman RN, Stefanovski D, Buchanan TA, Sumner AE, Reynolds JC, Sebring NG, et al. A better index of body adiposity. Obesity (Silver Spring). 2011;19(5):1083-9.
9. Cerqueira M, Amorim P, Magalhães F, Castro E, Franco F, Franceschini S, et al. Validity of body adiposity index in predicting body fat in a sample of brazilian women. Obesity (Silver Spring). 2013;21(12):E696-9.
10. Vinknes KJ, Elshorbagy AK, Drevon CA, Gjesdal CG, Tell GS, Nygard O, et al. Evaluation of the body adiposity index in a Caucasian population: the Hordaland health study. Am J Epidemiol. 2013;177(6):586-92.
11. Pena SDJ, Bastos-Rodrigues L, Pimenta JR, Bydlowski SP. DNA tests probe the genomic ancestry of Brazilians. Braz J Med Biol Res. 2009;42(10):870-6.
12. Charro MA, Cintra C, Pontes Junior FL. Medidas antropométricas. In: Charro MA, Bacurau RFP, Navarro F, Pontes Junior FL. Manual de Avaliação Física. São Paulo: Phorte, 2010. p.25-68.
13. Dumith SC, Rombaldi AJ, Ramires VV, Correa LQ, Souza, MJ, Reichert FF. Associação entre gordura corporal relativa e índice de massa corporal, circunferência da cintura, razão cintura-quadril e razão cintura-estatura em adultos jovens. Rev Bras Ativ Fís Saúde. 2009;14(3):174–81. [accessed on 2017 mai 31] Available from: https://periodicos.ufpel.edu.br/ojs2/index.php/RBAFS/article/view/771/780
14. Kanellakis S, Skoufas E, Khudokonenko V, Apostolidou E, Gerakiti L, Andrioti MC, et al. Development and validation of two equations based on anthropometry, estimating body fat for the Greek adult population. Obesity (Silver Spring). 2017;25(2):408-16.
15. Gallagher D, Heymsfield SB, Heo M, Jebb SA, Murgatroyd PR, Sakamoto Y. Healthy percentage body fat ranges: an approach for developing guidelines based on body mass index. Am J Clin Nutr. 2000;72(3):694-701. [accessed on 2017 mai 31] Available from: http://ajcn.nutrition.org/content/72/3/694.long
16. Deurenberg P, Weststrate JA, Seidell JC. Body mass index as a measure of body fatness: age- and sex-specific prediction formulas. Br J Nutr. 1991; 65(2):105-14.
17. Tran ZV, Weltman A. Generalized equation for predicting body density of women from girth measurements. Med Sci Sports Exerc. 1989;21(1):101-4.
18. Siri WE. Body composition from fluid spaces and density: analysis of methods. In: Brozeck J, Henschel A, editors. Techniques for measuring body composition. Washington, DC: National Academy of Science, 1961. p. 233-44.
19. Kang SM, Yoon JW, Ahn HY, Kim SY, Lee KH, Shin H, et al. Android fat depot is more closely associated with metabolic syndrome than abdominal visceral fat in elderly people. PLoS One. 2011;6(11):e27694. 20. AnselmoMAC, Burini RC, Angeleli AYO, Mota NGS, Campana AO. Avaliação do estado nutricional de indivíduos adultos sadios de classe média: ingestão energética e protéica, antropometria, exames bioquímicos do sangue e testes de imunocompetência. Rev Saúde Publ. 1992;26:46-53.
21. Benedetti TRB, Meurer ST, Morini S. Índices antropométricos relacionados a doenças cardiovasculares e metabólicas em idosos. Rev Educ Fís. 2012;23(1):123-30.
22. Costa EC, Soares EMM, Lemos TMAM, Maranhão TMO, Azevedo GD. Índices de obesidade central e fatores de risco cardiovascular na síndrome dos ovários policísticos. Arq Bras Cardiol. 2010;94:633–8. 23. Orsatti FL, Nahas EAP, Nahas-Neto J, Maestá N, Padoani NP, Orsatti CL. Indicadores antropométricos e
as doenças crônicas não transmissíveis em mulheres na pós-menopausa da região Sudeste do Brasil. Rev Bras Ginecol Obstet. 2008;30:182-9.
24. Barreira TV, Harrington DM, Staiano AE, Heymsfield SB, Katzmarzyk PT. Body Adiposity Index, body mass index and body fat in white and black adults. JAMA. 2011;306(8):828-30.
25. Alonso KC, Sautchuk FG, Malfatti CRM, Artoni RF. Comparação de percentuais de gordura corporal, utilizando impedância bioelétrica e a equação de Deurenberg. Cinergis. 2009;10(1). [accessed on 2017 mai 31] Available from: https://online.unisc.br/seer/index.php/cinergis/article/view/1236 26. Rech CR, Santos DL, Silva JCN. Development and validation of anthropometric equations for prediction
of the body fat in women aged 50 to 75 year. Braz J Kinanthrop Hum Perform. 2006;8(1). [accessed on 2017 mai 31] Available from: https://periodicos.ufsc.br/index.php/rbcdh/article/view/3757 27. Rech CR, Lima LRA, Cordeiro BA, Petroski EL, Vasconcelos FAG. Validade de equações antropométricas
para a estimativa da gordura corporal em idosos do sul do Brasil. Rev Bras Cineantropom Desempenho Hum. 2010;12(1):1-7.
28. Petroski EL, Neto CSP. Validação de equações antropométricas para a estimativa da densidade corporal em mulheres. Rev Bras Ativ Fís Saúde. 1995;1(2):65-73.
29. Glaner MF, Rodriguez-Añez CR. Validação de procedimentos antropométricos para estimar a densidade corporal e percentual de gordura em militares masculinos. Braz J Kinanthrop Hum Perform. 1999;1(1):24-29. [accessed on 2017 mai 31] Available from: https://periodicos.ufsc.br/index.php/rbcdh/article/ viewFile/3814/3253