ISSN: 1809-4430 (on-line) www.engenhariaagricola.org.br
1 Agricultural Sciences and Natural Resources University of Khuzestan/ Khuzestan, Iran. Received in: 3-27-2018
Accepted in: 8-6-2018
Doi: http://dx.doi.org/10.1590/1809-4430-Eng.Agric.v38n5p776-782/2018
DEVELOPMENT OF A TRANSFER FUNCTION FOR WEIGHT PREDICTION OF LIVE
BROILER CHICKEN USING MACHINE VISION
Somaye Amraei
1, Saman A. Mehdizadeh
1, Irenilza de A. Nääs
2*2*Corresponding author. Universidade Paulista, Programa de Pós Graduação em Engenharia de Produção/ São Paulo - SP, Brasil.
E-mail: [email protected]
KEYWORDS
automatic weight
estimation, image
processing, ellipse
fitting, transfer
function modeling.
ABSTRACT
The objective of this study was to process digital images to investigate the possibility of
broilers body weight estimation based on the dynamic model
.
For this experiment, 2440
images were recorded by a top-view camera from 30 birds. An ellipse fitting algorithm
was applied to localize chickens within the pen, by using a generalized Hough transform.
Chickens’ head and tail were
removed efficiently using the Chan-Vese method. After that,
using image processing, six body measures were calculated. Next, they were used to
design a Transform Function (TF) model with weight measurements as output.
Second-order dynamic models were used to predict the weight of life broiler chicken, without
delay, stable and with the highest R
2were predominantly selected according to the Young
Identification Criterion (YIC) criterion chosen models. It was observed that predicted
values rigorously follow the real values. Moreover, the relative body weight errors of
chickens in the early days of grow-out was much more than last days. The accuracy of TF
for body weight prediction from a comparison between measured (absolute) and predicted
total life body weights were estimated for all studied broiler chicken (R
2=0.98).
INTRODUCTION
Many scientific researchers have already practiced the technology of monitoring broilers by camera and image processing since it is non-intrusive and cost-effective technology which can work automatically in real-time. Amongst the different features that can be monitored via image analysis, weight is of great importance. Monitoring the broiler’s weight is essential for effective animal management in farms. Furthermore, information about body weight offers possibilities in automatic control of the flock, and help supporting farmers in relation to complex biological production processes (e.g., feeding strategies, growth rate control, activity control as proposed by Morag et al. (2001), Halachmi et al. (2002), and Aerts et al. (2003a, b).
It is critical to forecasting the impact of diseases in a flock, and the average weight and weight range at slaughter few days in advance (Lott et al., 1982; Turner et al., 1984; Flood et al., 1992).
The standard method to estimate the animal’s weight is laborious, costly, time-consuming, and also require direct contact with the animal’s body which is stressful for both animals and farmers. Moreover, direct contact may even cause injury to animal (Brandl &
Jørgensen, 1996). Frost et al. (1997) studied a measurement method based on computer-assisted visual images and digital images to avoid direct contact with animals’ bodies. De Wet et al. (2003) employed computer-assisted image analysis to estimate daily body weight changes of broiler chickens. Some researchers previously studied the ability of machine vision system to relate large numbers of images through statistical analysis to animal weight on a daily basis and determined the changes in measured parameters accurately (Marchant & Schofield, 1993; Brandl & Jørgensen, 1996). Therefore, Computer vision is a robust method to capture and estimate the weight of animal objectively and in real time (Viazzi et al., 2014) and would be an asset to large-scale broiler producers (Mollah et al., 2010). Odone et al.(2001) used a support vector machine to define the relation between fish weight and shape parameters with an error of ± 3% (Wongsriworaphon et al., 2015). The authors employed an approach based on digital image analysis to estimate the live weights of pigs in farm environments with an error rate of less than 3% on average. Viazzi et al. (2014) used single-factor regression equation with the area of the fish (Scortum barcoo) without considering the fin tail to
the mean relative error (6 ± 3%) was obtained compared to the value measured by a weighing scale. In another study, Alonso et al. (2013) used support vector regression to predict carcass weight in beef cattle in advance of the slaughter. According to their results, it was possible to predict carcass weights, 150 days before the slaughter day with an average absolute error of 4.27% of the actual value. The objective of this study was to process digital images to investigate the possibility of estimating body weight of broilers based on a dynamic model.
MATERIAL AND METHODS
Birds and housing
The experiment was carried out in a commercial broiler house in the animal husbandry station at Ramin Agriculture and Natural Resources University. The light during the first three days of rearing was 24 hours and after that, until the end of the grow-out period, 23 hours of light and 1-hour darkness were applied. The average air temperature was set at 34°C during the first week, while the temperature was decreased to just under 20°C to the end of the growth period. During the current experiment, thirty number of 1-day-old Ross broiler chickens (mixed sexes) with the weight of 40 ± 5 g were brought to the house, and grew-up during 42 days. The broilers were kept
in three pen-sized 1m
1 m (10 birds/ m2), and they hadaccess to water from automatic cup-drinkers. Furthermore, commercial diet was according to NRC (1994).
Experimental design, image, and weight data collection
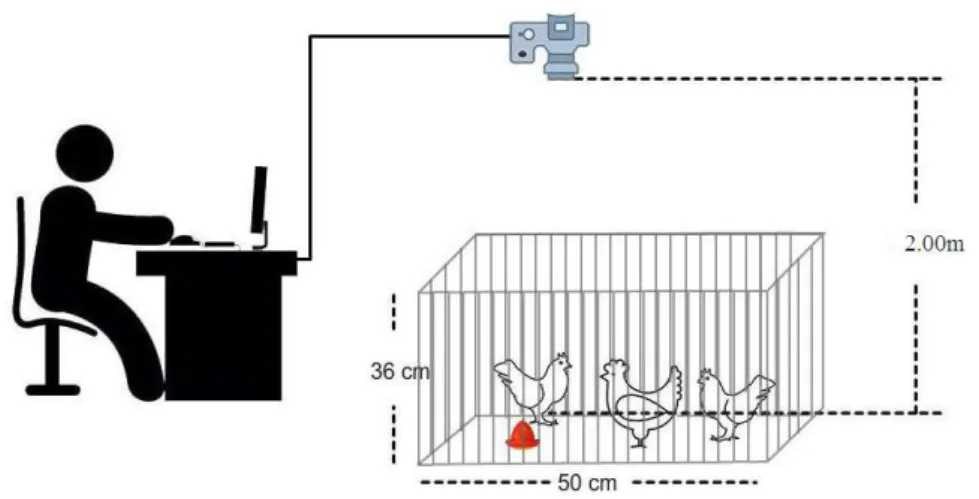
The chicken broiler images were captured using a SAMSUNG digital camera (SM-N9005, Korea), and image format was JPEG. An assistant device was set up to support the camera, which consisted of a 2.0 m height vertical stand and a horizontal arm mounted at 90° from the top of the upright position (Figure 1). The camera was operated in automatic exposure mode, and the adequate light was prepared to provide a proper balance between the outline containing shadows. Imaging was conducted twice a day between 7 to 8 am and 4 to 6 pm of the local time, also 2440 images were recorded from 30 birds inside the box individually. The box used for the image analysis had a dark floor to provide a high contrast between the chicken and the background, measuring 50 cm×36 cm, and the same camera was installed in the central area above the bird at the height of 0.5 m above the floor. The capturing images, in this stage, were used to develop the dynamic model; after that, all the acquired parameters were calibrated in a way that they were valid for noninvasive weight prediction inside the pen.
FIGURE 1. Schematic representation of an imaging process
Image processing
The objective of the first part of the image processing, image segmentation, is to obtain a binary image in which ‘1’ represents broiler chicken, and ‘0’ represents ground. An image processing algorithm was developed in this research to extract six features including area, convex area, perimeter, eccentricity, major and minor axis length using the Image Process Toolbox (Wang et al., 2008). For the first step, images were smoothed using histogram equalization. The second step of the image processing was image segmentation, which is probably the most critical stage in ensuring the high success of an image processing algorithm (Gonzalez et al., 2004; Zhang et al., 2011). After segmenting the broiler from the background, erosion and dilation commands with a disc structure were used for eliminating the shadows surrounding the broiler (Gonzalez et al., 2004). After
segmentation, a white area corresponding to the exact shape of the animal on a black background was acquired. Finally, the head of the chicken was removed using the Chen-Vase model since it represents less than 4% of the body area, as suggested by Gao et al. (2014).
Weight estimation using the TF model
Transfer function model is one of the dynamic data-based modeling approaches which is used for describing dynamic responses of systems; it relates the output(s) of the system to the input(s). In the case of a linear, time-invariant, single-input, single-output system, the utilized model structure could be described by [eq. (1)] (Young, 2011).
1
1
(
)
( )
(
)
(
)
Ta Z
BW t
A t
nt
b Z
−
−
In the above equation BW(t) is the body weight, t represents the discrete-time increments for weight estimation and measurement;
A t
(
−
nt
T)
is the inputsystems at time
t
−
nt
T ;nt
i is the number of timedelays between each input i and their first effects on the output, a(z-1) and b(z_1) is the nominator polynomials, and
denominator polynomials linked equals
1 2
1 2
1
...
aa
n n
a z
−a z
−a z
−+
+
+ +
and1 2
0 1 2
...
bi bin
i i i n
b
+
b z
−+
b z
−+ +
b z
− with the input irespectively. aj and
b
i are the model parameters to beestimated;
z
−1 is defined asz
−1. ( )
y k
=
y k
(
−
1)
is backward shift operator,n
a andn
bi are the orders of the respective polynomials. To build the model, different combinations for na, nbd and ntd were calculated. Theresulting models using the coefficient of determination and a detection method to determine the most suitable model based on minimizing the measure of the Young Identification Criterion (YI) was studied (Young & Lees, 1993). To develop the dynamic model two-third of the total experimental data (1627 data) was used and the remaining data (813) was used to test it. The performance of a function f was measured by MAPE (mean absolute
percentage error) and RMSE (root mean square error). Also, it is used in evaluation, the standard regression error (SRE), which is the average accuracy of prediction of the average weight (Equation 2), and the relative accuracy value (RAV), which indicates the relative accuracy (Brownlee & Brownlee, 1965), defined as follows:
1
( )
100
ni i
i i
f x
y
MAPE
n
=y
−
=
(2)2 1
( ( )
)
1
n i i i if x
y
RMSE
n
=y
−
=
(3)(4)
(5)
Where,
xi and yi are input and the output vector values for
ith input,
i
y
is real weigh,ˆ
iy
is predicted weigh, andn is sample’s number.
MAPE, RMSE, SRE, and RAV based on artificial neural network and machine vision the broiler weights were estimated at 12.61, 82.36, 0.1846, and 0.1423 respectively (Amraei et al., 2017a). A support vector regression was applied, and the variables were evaluated using 8.62, 67.88, 0.126, and 0.0185 values respectively (Amraei et al., 2017b).
RESULTS AND DISCUSSION
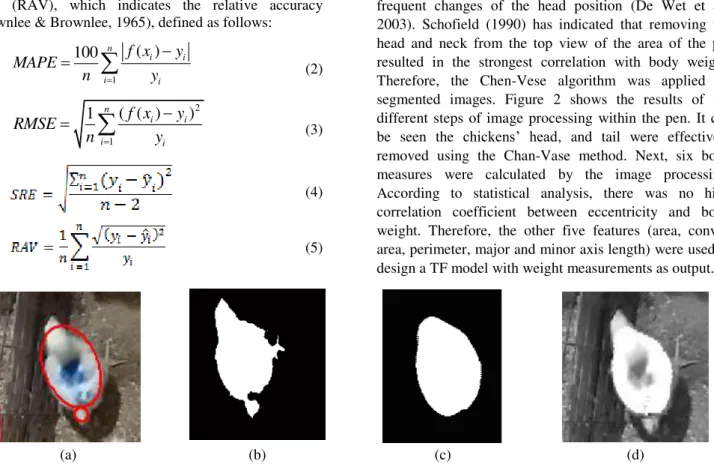
The first step of image processing was image segmentation and determination of the broiler chickens’ location. To this end, images were binarized to remove the background using the adaptive thresholding method (Yang, 1994). After that, for localizing the chickens within the pen, an ellipse fitting algorithm by using a generalized Hough transform was performed (Davies, 1989). The model captures the shape variations due to some specific behaviors of the animal (e.g., bending the body) and frequent changes of the head position (De Wet et al., 2003). Schofield (1990) has indicated that removing the head and neck from the top view of the area of the pig resulted in the strongest correlation with body weight. Therefore, the Chen-Vese algorithm was applied on segmented images. Figure 2 shows the results of the different steps of image processing within the pen. It can be seen the chickens’ head, and tail were effectively removed using the Chan-Vase method. Next, six body measures were calculated by the image processing. According to statistical analysis, there was no high correlation coefficient between eccentricity and body weight. Therefore, the other five features (area, convex area, perimeter, major and minor axis length) were used to design a TF model with weight measurements as output.
(a) (b) (c) (d)
To predict the weight of live broiler chicken predominantly second order dynamic models without delay, stable (namely all poles within the unit circle) and with the highest R2 were selected according to the YIC criterion selected models. The
optimal model structure is shown in Figure 3. A summary of the calculated relative errors for four birds is given in Figure 3.
FIGURE 3. The TF model adapted to estimate broiler body weight (g) using body six feature (pixels) as inputs.
FIGURE 4. Broiler weight predictions from the first day to the 42nd day of growth using TF. The horizontal axis represents the
sample number; samples were ordered according to their predictions. Solid squares () are the predictions, and solid diamonds () are real values.
The accuracy of TF for body weight prediction was estimated from a comparison between absolute and predicted body weights over all broiler chicken averages with R2=0.98. Results are graphically presented in Figure
5. Moreover, MAPE, RMSE, SRE and RAV respectively calculated: 21.465, 102.97, 0.240 and 0.0578. The R2
value of broiler weight in this research was delicately better than that reported by Kashiha et al. (2014) who estimated pig weight of 97.5% at the group level (error of 0.82 kg) and 96.2% individually (error of 1.23 kg) by computer-assisted digital image analysis. In Amraei et al. (2017a) study, Bayesian regulation ANN technique with an R2 value of 0.98 as the best network was used for
prediction of broiler weight and the most errors were less than 50 g. Other research for body weight broiler using support vector regression estimated R2 = 0.98 as well
(Amraei et al., 2017b). As it can be seen in the results,
both studies present similar results. This research is also better than that obtained by De Wet et al. (2003) who obtained R2 of 0.97 for predicting body weight of
individual broiler chicken. Shirzeyli et al. (2013) also reported lower prediction value (R2=0.84) while estimating
the mature live weight of Karya sheep. Menesatti et al. (2014) used a PLS model on log-transformed biometrics to estimate size and weight of live sheep’s body. Sheep weight estimation showed SEP values on the data manually measured, and on the stereovision extracted equally to 3.6 kg and 4.4 kg respectively. However, the result of this study is lower than the result (R2= 0.99)
reported by Mollah et al. (2010) for predicting of live boiler weight. Overall, the proposed technique has shown that machine vision with TF can be utilized to estimate the live body weight of boiler chicken with an acceptable error.
CONCLUSIONS
A model was developed using the images of broiler chickens to predict the weight during the grow-out. Chickens’ head and tail were removed from the real image from the top of the body, and then, six body measures were calculated by the image processing model. Five features were used as input to design a TF model with weight measurements as output. Second order dynamic models without delay, stable and with the highest R2 were
selected to predict the weight of life broiler chicken. The predicted broiler weight errors of the in the end days of growth were smaller than those in the earlier grow-out phase.
ACKNOWLEDGMENTS
The authors thank Ramin Agriculture and the Natural Resources University of Khuzestan for giving the broilers and the feed to the experiment and the Research Initiation scholarship.
REFERENCES
Aerts JM, Van Buggenhout S, Vranken E, Lippens M, Buyse J, Decuypere E, Berckmans D (2003a) Active control of the growth trajectory of broiler chickens based on online animal responses. Poultry Science 82(12):1853-1862. https: https://doi.org/10.1093/ps/82.12.1853 Aerts JM, Wathes CM, Berckmans D (2003b) Dynamic data-based modeling of heat production and growth of broiler chickens: development of an integrated
management system. Biosystems Engineering 84(3):257-266. DOI: https://doi.org/10.1016/S1537-5110(02)00285-4 Alonso J, Castañón ÁR, Bahamonde A (2013) Support Vector Regression to predict carcass weight in beef cattle in advance of the slaughter. Computers and electronics in agriculture 91:116-120. DOI:
https://doi.org/10.1016/j.compag.2012.08.009 Amraei S, Abdanan Mehdizadeh S, Salari S (2017a) Broiler weight estimation based on machine vision and artificial neural network. British Poultry Science 58(2):200-205. DOI:
http://dx.doi.org/10.1080/00071668.2016.1259530 Amraei S, Mehdizadeh SA, Sallary S (2017b) Application of computer vision and support vector regression for weight prediction of live broiler chicken. Engineering in Agriculture, Environment and Food. 10(4):266-271. DOI: https://doi.org/10.1016/j.eaef.2017.04.003
Brandl N, Jørgensen E (1996) Determination of live weight of pigs from dimensions measured using image analysis. Computers and Electronics in Agriculture 15(1):57-72. DOI: https://doi.org/10.1016/0168-1699(96)00003-8
Brownlee KA, Brownlee KA (1965) Statistical theory and methodology in science and engineering. New York, Wiley.
Davies ER (1989) Finding ellipses using the generalized Hough transform. Pattern Recognition Letters 9(2):87-96. DOI: https://doi.org/10.1016/0167-8655(89)90041-X
De Wet L, Vranken E, Chedad A, Aerts JM, Ceunen J, Berckmans D (2003) Computer-assisted image analysis to quantify daily growth rates of broiler chickens. British Poultry Science 44(4):524-532. DOI:
http://dx.doi.org/10.1080/00071660310001616192 Flood CA, Koon JL, Trumbull RD, Brewer RN (1992) Broiler growth data: 1986–1991. Transactions of the ASAE 35:703-709.
Frost AR, Schofield CP, Beaulah SA, Mottram TT, Lines JA, Wathes CM (1997) A review of livestock monitoring and the need for integrated systems. Computers and Electronics in Agriculture 17(2):139-159. DOI: https://doi.org/10.1016/S0168-1699(96)01301-4
Gao X, Du JX, Wang J, Zhai CM (2014) 'Shape and Color Based Segmentation Using Level Set Framework, In Intelligent Computing Methodologies. Springer International Publishing, p265-270.
Gonzalez RC, Woods RE, Eddins SL (2004) Digital image processing using MATLAB, ''Pearson Education India. DOI: https://doi.org/10.1364/AO.52.005663
Halachmi I, Metz JHM, Van’t Land A, Halachmi S, Kleijnen JPC (2002) Case study: Optimal facility allocation in a robotic milking barn. Transactions of the ASAE, 45(5): 1539. DOI:
http://dx.doi.org/10.1080/088395101317018573 Kashiha M, Bahr C, Ott S, Moons CP, Niewold TA, Ödberg FO, Berckmans D (2014) Automatic weight estimation of individual pigs using image analysis, Computers and Electronics in Agriculture 107:38-44. DOI: https://doi.org/10.1016/j.compag.2014.06.003
Lott BD, Reece FN, McNaughton JL (1982) An Automated Weighing Systemic for Use in Poultry Research. Poultry Science 61(2):236-238. DOI: https://doi.org/10.3382/ps.0610236
Marchant JA, Schofield CP (1993) Extending the snake image processing algorithm for outlining pigs in scenes. Computers and electronics in agriculture 8(4):261-275. DOI: https://doi.org/10.1016/0168-1699(93)90015-S Menesatti P, Costa C, Antonucci F, Steri R, Pallottino F, Catillo G (2014) A low-cost stereovision system to estimate size and weight of live sheep. Computers and Electronics in Agriculture 103:33-38. DOI:
https://doi.org/10.1016/j.compag.2014.01.018 Mollah MBR, Hasan MA, Salam MA, Ali MA (2010) Digital image analysis to estimate the live weight of broiler. Computers and Electronics in Agriculture 72(1):48-52. DOI:
https://doi.org/10.1016/j.compag.2010.02.002 Morag I, Edan Y, Maltz E (2001) IT_information
technology: an individual feed allocation decision support system for the dairy farm. Journal of agricultural
NRC - National Research Council (1994) National requirements of poultry. National Academy Press.
Odone F, Trucco E, Verri A (2001) A trainable system for grading fish from images. Applied Artificial Intelligence 15(8):735-745.
Schofield CP (1990) Evaluation of image analysis as a means of estimating the weight of pigs, Journal of Agricultural Engineering Research 47:287-296. DOI: https://doi.org/10.1016/0021-8634(90)80048-Y
Shirzeyli FH, Lavvaf A, Asadi A (2013) Estimation of mature live weight using some body measurements in Karya sheep. Tropical animal health, and production, 45(2):397-403.
Turner MJB, Gurney P, Crowther, J. S. W., and Sharp, J. R. (1984) An automatic weighing system for poultry. Journal of Agricultural Engineering Research 29(1):17-24. DOI: https://doi.org/10.1016/0021-8634(84)90056-8 Viazzi S, Ismayilova G, Oczak M, Sonoda LT, Fels M, Guarino M, Berckmans D (2014) Image feature extraction for classification of aggressive interactions among pigs. Computers and Electronics in Agriculture 104:57-62. DOI: https://doi.org/10.1016/j.compag.2014.03.010
Wang Y, Yang W, Winter P, Walker L (2008) Walk-through weighing of pigs using machine vision and an artificial neural network. Biosystems Engineering 100(1):117-125. DOI:
https://doi.org/10.1016/j.biosystemseng.2007.08.008 Wongsriworaphon A, Arnonkijpanich B, Pathumnakul S (2015) An approach based on digital image analysis to estimate the live weights of pigs in farm environments. Computers and Electronics in Agriculture 115:26-33. DOI: https://doi.org/10.1016/j.compag.2015.05.004
Yang Q (1994) An approach to apple surface feature detection by machine vision, Computers and Electronics in Agriculture 11(2-3):249-264. DOI:
https://doi.org/10.1016/0168-1699(94)90012-4 Young PC (2011) Recursive estimation and time-series analysis: An introduction for the student and practitioner. Springer Science and Business Media.
Young PC, Lees MJ (1993) The active mixing volume: A new concept in modeling environmental systems. In: Barnet V, Turkman R, Feridun K (eds). Statistics for the environment. Wiley.
Zhang Z, Niu Z, Zhao S, Yu J (2011) Weight grading of freshwater fish based on computer vision, Transactions of the Chinese Society of Agricultural Engineering