http://www.uem.br/acta ISSN printed: 1806-2563 ISSN on-line: 1807-8664
Doi: 10.4025/actascianimsci.v34i3.13304
Mathematical modeling for digestible energy in animal feeds for
tilapia
Luiz Vítor Oliveira Vidal1*, Wilson Massamitu Furuya2, Elias Nunes Martins3, Tadeu Orlandi Xavier1, Mariana Michelato1 and Thêmis Sakaguti Graciano1
1
Programa de Pós-graduação em Zootecnia, Universidade Estadual de Maringá, Av. Colombo, 5790, 87020-900, Maringá, Paraná, Brazil. 2
Departamento de Zootecnia, Universidade Estadual de Ponta Grossa, Ponta Grossa, Paraná, Brazil. 3Departamento de Zootecnia, Universidade
Estadual de Maringá, Maringá, Paraná, Brazil. *Author for correspondence. E-mail: [email protected]
ABSTRACT. The objective of this study was to formulate a mathematical model to estimate digestible energy in animal feeds for tilapia. Literature results were used of the proximate composition of crude protein, ether extract, mineral matter and gross energy, as well as digestible energy obtained in biological assays. The data were subjected to stepwise backward multiple linear regression. Path analysis was performed to measure the direct and indirect effects of each independent variable on the dependent one. To validate the model, data from independent studies and values obtained from a digestibility trial with juvenile Nile tilapia testing five meat and bone meals (MBM) were used, using the Guelph feces collecting system and chromium oxide (III) as an indicator. The obtained model is described below and cannot estimate digestible energy (DE) of animal origin:
775 0 287
1 970
2364 2
1
. R ; GE x . . ) kg kcal (
DE − =− + = . The path coefficients were medium or low, the highest direct effect was from gross energy (0.529), while the highest indirect effect was from crude protein, through gross energy (0.439).
Keywords: nutrition, nutritional value, estimate, linear models.
Modelagem matemática para energia digestivel de ingredientes de origem animal para
tilápias
RESUMO. O objetivo deste estudo foi a formulação de equações para estimar a energia digestível em alimentos para a tilápia. Foram utilizados valores obtidos na literatura da composição centesimal em proteína bruta, extrato etéreo, matéria mineral e energia bruta (variáveis independentes), bem como a energia digestível (variável dependente) obtidos em ensaios biológicos. Os dados foram submetidos à regressão linear múltipla “stepwise backward”. Foi realizada análise de trilha para medir os efeitos diretos e indiretos de cada variável independente sobre a dependente. Para validar o modelo foram utilizados dados de estudos independentes, e os valores obtidos em um ensaio de digestibilidade com juvenis de tilápia do Nilo, testando-se cinco farinhas de carne e ossos (FCO), utilizando o sistema de coleta de fezes de Guelph e óxido de cromo (III) como indicador. A equação obtida não pode estimar os valores de energia digestível (ED) de origem animal e está descrito a seguir:
775 , 0 R ; EB x 287 , 1 970 , 2364 ) kg kcal (
ED −1 =− + 2= .
Os coeficientes de trilha obtidos tem valores de médios a baixo, sendo o maior efeito direto o da energia bruta (0,529), enquanto a proteina bruta apresentou o maior efeito indireto, via energia bruta (0,439).
Palavras-chave: nutrição, valor nutritivo, estimativa, modelos lineares.
Introduction
Tilapia is one of the most promising species for aquaculture, due to its rapid growth in intensive farming. Feed is the most expensive component in tilapia farming, representing over 50% of operating costs (EL SAYED, 2006).
Data on the digestible energy (DE) of commonly used feedstuffs in fish diets are
essential for optimization of feed formulation. The additive nature of the apparent digestibility coefficient (ADC) of energy and nitrogen makes DE values very useful in the optimization of dietary formulations (BUREAU et al., 2002).
Digestibility values are obtained based on in
vivo fecal collection, a methodology routinely
difficult to subject every raw material batch to digestibility trials.
Due to the possibility of obtaining the values of crude protein, ether extract and mineral matter contents by low-cost chemical analysis, and their use in regression equations, the estimation of digestible energy values can have great practical applications (SAKOMURA; ROSTAGNO, 2007). They may also be an important tool in complementing biological assays, which depend on a more complex,
expensive and prolonged methodology.
Mathematical modeling has been widely used to estimate digestible lipids (HUA; BUREAU, 2009a; SALES, 2009a), available phosphorus (HUA; BUREAU, 2006), carbohydrates (HUA; BUREAU, 2009b) and protein (SALES, 2008).
However, it was not possible to determine a mathematical model to estimate digestible energy values for fishes (SALES, 2009b), but according to Dabrowski and Portella (2006), the manner in which fish use energy varies among species, influenced by feeding habits. The development of individual models, according to feed and species alike, would make it possible to obtain data applicable to new situations and physiological features of fish.
The aim of this study was to develop mathematical models to estimate the digestible energy for animal feedstuff for tilapia and to validate them with data from a biological digestibility trial, using MBM as standard feed and independent studies from the literature.
Material and methods
Chemical composition and digestible energy, data for some ingredients of animal origin were collected from scientific papers published between 2002 and 2008, obtained mostly for Nile tilapia.
The search was conducted in the Scopus and ISI Web of Science databases.
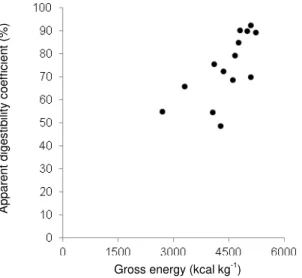
The study used articles that contained values of dry matter (DM), crude protein (CP), ether extract (EE), mineral matter (MM), gross energy (GE) and digestible energy (DE) of fish meal, shrimp meal, meat and bone meal, and poultry by-products meal. By the end of selection, eight articles were obtained, which resulted in the database described below (Figure 1). For
standardization, the data on chemical
composition and energy digestibility were expressed as dry matter values.
All data were analyzed by multiple linear regression:
i 4 i 4 3 i 3 2 i 2 1 i 1 0
i=β +βΧ +β Χ +β Χ +β Χ +e
Υ
where:
Yi = apparent digestible energy (ADE) of the ingredients obtained in a digestibility test;
β0 = intercept;
Xi1, Xi2, Xi3, Xi4= feed chemical composition
variables, respectively, crude protein, ether extract, mineral matter, and gross energy.
A
p
p
a
re
n
t
d
ig
e
s
ti
b
ili
ty
c
o
e
ff
ic
ie
n
t
(%
)
Gross energy (kcal kg-1)
Figure 1. Modeling dataset consisting of data from 8 studies. (BOSCOLO et al., 2004; BOSCOLO et al., 2008; GODDARD et al., 2008; GUIMARÃES et al., 2008; KÖPRÜCÜ; ÖZDEMIR, 2005; MAINA et al., 2002; PEZZATO et al., 2002; SKLAN et al., 2004).
The backward stepwise method was used to remove insignificant independent variables (p < 0.05). Path analysis was performed to measure the direct and indirect effects of each independent variable on the dependent one.
To validate the models, a digestibility trial was conducted at the Aquaculture Experimental Station of the State University of Maringá, located in the district of Floriano, Maringá, State of Paraná, Brazil.
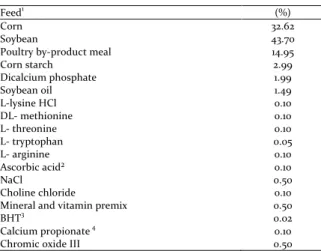
A practical reference diet was formulated to contain approximately 32% of crude protein, 3120 kcal of digestible energy, 3.40% of crude fiber, and 0.50% of phosphorus (Table 1).
Five MBMs with different protein levels (Table 2) were used as standard feed to validate the equations replacing 30% of the reference diet.
of the diet. The mixture was pelleted in a meat mill and dried in a forced ventilation oven (55°C) for 48h.
The ADCs of gross energy were determined by the indirect method using chromic oxide III (0.5%) as an inert indicator. Twelve 110-L conical fiberglass tanks were used for fecal collection.
Fish (180 juveniles of Nile tilapia GIFT strain with an average weight of 32.65 ± 4.52 g) were kept in the fecal collection tanks during the
entire trial and fed ad libitum every 2h from 8:30
to 17:00 by hand feeding. The collector tubes were installed and the feces were collected in the morning and kept frozen at -21°C until the end of the collection period, when the tanks were cleaned and all the water was replaced.
Table 1. Percentage composition of reference diet.
Feed1 (%)
Corn 32.62
Soybean 43.70
Poultry by-product meal 14.95
Corn starch 2.99
Dicalcium phosphate 1.99
Soybean oil 1.49
L-lysine HCl 0.10
DL- methionine 0.10
L- threonine 0.10
L- tryptophan 0.05
L- arginine 0.10
Ascorbic acid² 0.10
NaCl 0.50
Choline chloride 0.10
Mineral and vitamin premix 0.50
BHT3 0.02
Calcium propionate 4 0.10
Chromic oxide III 0.50
1Mineral and vitamin mix (per kg): vitamin A, 1.2 million IU; vitamin D3, 200,000
IU; vitamin E, 12,000 mg; vitamin K3, 2,400 mg; vitamin B1, 4,800 mg; vitamin B2, 4,800 mg; vitamin B6, 4,000 mg; vitamin B12, 4,800 mg; folic acid = 1,200 mg; calcium D-pantothenate, 12,000 mg; ascorbic acid, 48,000 mg; biotin, 48 mg; choline, 65,000 mg; nicotinic acid, 24,000 mg; iron, 10,000 mg; copper sulfate, 600 mg; manganese sulfate, 4000 mg; zinc sulfate, 6000 mg; potassium iodine, 20 mg; cobalt, 2 mg; selenium, 20 mg; 2Vitamin C: calcite salt, active principle ascorbic 2
acid-42%-monophosphate; 3Butyl-hydroxy-toluene; 4Calcium propionate.
Table 2. Chemical composition of meat and bone meal with different levels of crude protein.
MBM DM CP Variables EE MM GE
33.70 93.64 33.70 8.99 45.45 3031.40
37.49 94.05 37.49 10.60 42.09 3249.37
40.17 94.76 40.17 11.57 38.76 3462.88
43.48 95.15 43.48 13.16 35.52 3767.10
46.38 95.64 46.38 14.46 32.30 4011.39
MBM = meat and bone meal, DM = dry matter (%), CP = crude protein (%), EE = ether extract (%), MM = mineral matter (%), GE = gross energy (kcal kg-1).
Each test diet was assessed in triplicate for five days; each tank was considered a collection repetition. Before feces collection, the fish were adapted to the conical tanks, handling, and pellet diets for seven days. For each new ingredient, the feces were discarded in the first three days to avoid contamination with the previous diet. At
the end of each sampling period, the feces were dried in a forced ventilation oven at 55°C (48h) and milled at the Laboratory of Food Analysis, Department of Animal Science, State University of Maringá (LANA (DZO/UEM)), where they were also analyzed according to the methodology described by AOAC (1990). The gross energy was determined by an adiabatic bomb calorimeter (Parr Instrument Company, Moline, IL, USA), at the Central Complex of Research Support (COMCAP/UEM).
The chromic oxide contents of diets and feces were determined according to Bremer-Neto et al. (2005), at the Bromatology Laboratory of the Veterinary Medicine and Animal Science School of the Paulista State University - UNESP, Botucatu, São Paulo State, Brazil.
The apparent digestibility coefficients for gross energy were calculated according to the equations described by Pezzato et al. (2002).
(
)(
)
[
100.%Id/%If .%Nf/%Nd]
100
ADC= −
where:
ADC (n) = apparent digestibility coefficient;
Id = % of chromic oxide in diet;
If = % of chromic oxide in feces;
Nd = nutrients in the diet;
Nf = nutrients in feces.
a ADC . b ADC
ADCing (td) rd
− =
where:
ADC (ing) = apparent digestibility coefficient of the ingredients;
ADC (td) = apparent digestibility coefficient of the test diet;
ADC (rd) = apparent digestibility coefficient of the reference diet;
b = percentage of the reference diet; a = percentage of test ingredient.
The differences between the digestible energy of the meat and bone meals were determined by analysis of variance (ANOVA), p < 0.05, significant values were submitted to linear regression.
Student’s t-test was applied to investigate
obtained (x) values, adapted from Sales (2008). The values used in the validation procedure were obtained in the digestibility trial and from four independent studies, described in Figure 2. All calculations were performed in the statistical package SAS 9.1.3.
Results and discussion
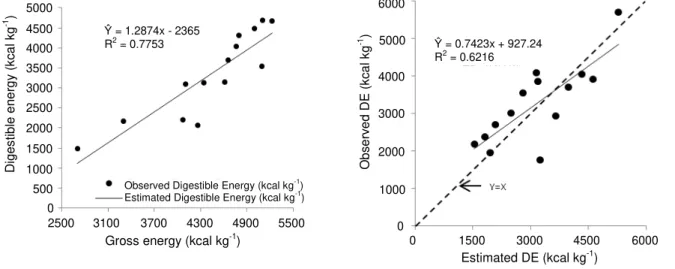
The equation for estimating digestible energy, obtained by linear regression, was significant (p < 0.0001) and had a coefficient of determination r² = 0.775 (Figure 3).
The regression between the estimated values and the database used to obtain the model presents good values of intercept and slope, near 0 and 1 respectively (Figure 4). On the other hand, the r² was lower than the one obtained by Hua and Bureau (2006), when they formulated equations to estimate available phosphorus.
A p p a re n t d ig e s ti b ili ty c o e ff ic ie n t (% )
Gross energy (kcal kg-1)
Figure 2. Validating dataset consisting of data from 5 studies (SAMPAIO et al., 2001; MEURER et al., 2003; GONÇALVES et al., 2009; VÁSQUEZ-TORRES et al., 2010; Present Digestibility Trial).
D ig e s ti b le e n e rg y ( k c a l k g -1 )
Gross energy (kcal kg-1)
Figure 3. Linear equation to estimate apparent digestible energy content in animal feeds.
Comparing the digestible energy values estimated by the present model and those obtained from independent studies and the biological assay conducted for this study, the intercept and the slope was far from ideal (Figure 5), although higher than those obtained by Sales (2009b): 9.0671 and 0.4025, respectively.
The stepwise backward method eliminated three variables of the model, using the gross energy to estimate digestible energy. On the other hand, Sales (2009b) determined that the gross energy and crude protein are needed to estimate digestible energy for animal origin ingredients for 24 species of fish, resulting the following model: 477 . 0 2 R ; GE x 724 . 0 CP x 005 . 0 541 . 1 1 kg kcal
DE = − + + =
− O b s e rv e d D E ( k c a l k g -1 )
Estimated DE (kcal kg-1)
Figure 4. Comparison of observed and model estimated digestible energy content (g kg-1) of the ingredients from
dataset. O b s e rv e d D E ( k c a l k g -1 )
Estimated DE (kcal kg-1)
Ŷ = 1x + 0.0029 R2 = 0.7753
Ŷ = 1.2874x - 2365
R2 = 0.7753 Ŷ = 0.7423x + 927.24
R2 = 0.6216
Observed Digestible Energy (kcal kg-1) Estimated Digestible Energy (kcal kg-1)
2500 3100 3700 4300 4900 5500 5000 4500 4000 3500 3000 2500 2000 1500 1000 500 0 0 0 6000 5000 4000 3000 2000 1000
1500 3000 4500 6000
7000 5250 3500 1750 0 0 10 20 30 40 50 60 70 80 90 100 5000 4500 4000 3500 3000 2500 2000 1500 1000 500 0
Figure 5. Comparison of observed and model estimated apparent digestible energy content from independent studies and digestibility trial.
According to Dabrowiski and Portella (2006), different species of fish have different digestive metabolisms, which depend on feeding habits; therefore, this biological factor should be taken into consideration in the development of mathematical models.
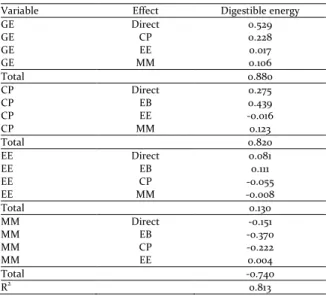
The path analysis showed a determination coefficient of 0.813 (Table 3). As expected, the gross energy had the highest direct effect on digestible energy (0.529). The crude protein, indirectly contributed by the increment of gross energy (0.439), and has an additional direct effect (0.275) and could be interpreted as an increase in feed quality, demonstrated by the higher crude protein content. Ether extract had little effect on digestible energy, being the indirect effect the highest one, by increasing gross energy (0.111). Mineral matter caused a decrease in digestible energy, by reducing the gross energy content (-0.370) and directly reducing the digestibility of
energy of the feed
(-0.151). According to Butolo (2010), the increase in mineral matter in an animal-based ingredient can also add collagen, an indigestible protein that can decrease the digestibility of the material. Also note an inverse relationship between content of crude protein and mineral matter. Protein is the most costly nutrient in diets for domestic animals (WILSON, 2002), and has shown high influence on the digestible energy content of animal-based ingredients.
Table 3. Path coefficients between the variables of chemical composition and content of digestible energy.
Variable Effect Digestible energy
GE Direct 0.529
GE CP 0.228
GE EE 0.017
GE MM 0.106
Total 0.880
CP Direct 0.275
CP EB 0.439
CP EE -0.016
CP MM 0.123
Total 0.820
EE Direct 0.081
EE EB 0.111
EE CP -0.055
EE MM -0.008
Total 0.130
MM Direct -0.151
MM EB -0.370
MM CP -0.222
MM EE 0.004
Total -0.740
R2 0.813
GE = gross energy; CP = crude protein; EE = ether extract; MM = mineral matter; R2
= determination coefficient.
The mean values of apparent digestibility coefficients (ADC) and digestible energy are shown in Table 4. Differences (p < 0.05) were observed for the ADC of crude protein of feeds. Thus, as the composition of the reference diet may influence the results, feed processing, fecal collecting method, and nutrient levels used for determining the feed ADC are important factors in determining the biological value of each feed, which may present differences with regard to each methodology (GONÇALVES et al., 2009).
The increase in the crude protein (CP) content influenced the digestible energy and digestibility coefficients of MBM (p < 0.05). Comparing these values with others from the literature, the ADC obtained by Pezzato et al. (2002) is between the ones of the 37.49 and 40.17% MBM of the present study, on the other hand the digestible energy determined by these authors is close to the 43.38% MBM. The higher digestible energy content observed in the present study would be caused by the ether extract content. When evaluating alternative feeds for Australian silver
perch (Bidyanus bidyanus) using two MBMs with
49.20 and 54.30% of crude protein, Allan et al. (2000) obtained ADC values of gross energy of 75.20 and 80.80% respectively, which were lower than the values obtained with tilapia, in the present work, when considering the chemical composition of the tested ingredients.
Table 4. Apparent digestibility coefficients of meat and bone meal with different levels of crude protein for Nile tilapia.
MBM ADC1 ODEVariables 2 EDE
33.70 72.37 2193.90 1538.00
37.49 72.91 2369.10 1818.00
40.17 78.23 2709.00 2093.00
43.48 79.85 3008.20 2485.00
46.38 88.32 3543.00 2799.00
Mean 78.34 2764.62a 2146.70b
MBM = meat and bone meal; ADC = apparent digestibility coefficient (%); ODE = Obtained digestible energy (kcal kg-1); EDE = Estimated digestible energy
(kcal kg-1); 1linear effect: ŷ = 29.25 + 1.2197x, R2 = 0.877; 2linear effect: ŷ = -1480.1 +
105.47x, R2 = 0.953. Means followed by different letters are different (p < 0.05) by
the t test.
The t test established differences between the
values obtained and estimated for the meat and bone meals.
Because of the lower cost of MBM in some countries, as compared to fish meal, MBM has been widely used as a source of energy, protein (amino acids), minerals and vitamins. However, its protein, fat, and mineral composition is highly variable, which even affects the nutritional value from other feeds in the diet.
Multiple linear models are unable to estimate the values of digestible energy, using the chemical composition values of animal-origin feeds, in general. The values estimated by mathematical models are far from those obtained by independent experiments.
Conclusion
Is not possible to estimate digestible energy of animal-origin feeds for tilapia. The direct and indirect effects of chemical composition of the variables explain the inefficiency of the equations in estimating digestible energy contents.
Acknowledgements
This research is part of the Master’s dissertation of the first author and was supported by the Universidade Estadual de Maringá and Coordenação de Aperfeiçoamento de Pessoal de Nível Superior (CAPES).
References
ALLAN, G. L.; ROWLAND, S. J.; MIFSUD, C.; GLENDENNING, D.; STONE, D. A. J.; FORD, A. Replacement of fish meal in diets for Australian silver perch, Bidyanus bidyanus: V. Least-cost formulation of practical diets. Aquaculture, v. 186, n. 3-4, p. 327-340, 2000.
AOAC-Association of Official Analytical Chemists. Official Methods of Analysis. 15th ed. Arlington: AOAC, 1990.
BOSCOLO, W. R.; HAYASHI, C.; FEIDEN, A.; MEURER, F.; SIGNOR, A. A. Composição química e digestibilidade aparente da energia e nutrientes da farinha de resíduos da indústria de filetagem de tilápias, para a tilápia do Nilo (Oreochromis niloticus).
Ciência Rural,
v. 38, n. 9, p. 2579-2586, 2008.
BOSCOLO, W. R.; HAYASHI, C.; MEURER, F.; FEIDEN, A.; BOMBARDELLI, R. A. Digestibilidade aparente da energia e proteína das farinhas de resíduo da filetagem da tilápia do Nilo (Oreochromis niloticus) e da corvina (Plagioscion squamosissimus) e farinha integral do camarão canela (Macrobrachium amazonicum) para a tilápia do Nilo. Revista Brasileira
de Zootecnia, v. 33, n. 1,
p. 8-13, 2004.
BREMER NETO, H.; GRANER, C. A. F.; PEZZATO, L. E.; PADOVANI, C. R. Determinação de rotina do crômio em fezes, como marcador biológico, pelo método espectrofotométrico ajustado da 1,5-difenilcarbazida. Ciência Rural, v. 35, n. 3, p. 691-697, 2005.
BUREAU, D. P.; KAUSHIK, S. J.; CHO, C. Y. Bioenergetics. In: HALVER, J. E.; HARDY, R. W. (Ed.). Fish Nutrition. San Diego: Academic Press, 2002. p. 1-59.
BUTOLO, J. E. Qualidade de ingredientes na alimentação animal. 2. ed. Campinas: Colégio Brasileiro de Nutrição Animal, 2010.
DABROWSKI, K.; PORTELLA, M. C. Feeding plasticity and nutritional physiology in tropical fishes. In: VAL, A. L.; ALMEIDA-VAL, V. M. F. D.; RANDALL, D. J. (Ed.). The physiology of tropical fishes. 1st ed. Amsterdam: Elsevier, 2006. p. 155-224. (Fish Physiology).
EL-SAYED, A. F. M. Tilapia culture. 1st ed. Wallingford: CABI Publishing, 2006.
GODDARD, S.; AL-SHAGAA, G.; ALI, A. Fisheries by-catch and processing waste meals as ingredients in diets for Nile tilapia, Oreochromis niloticus. Aquaculture Research, v. 39, n. 5, p. 518-525, 2008. GONÇALVES, G. S.; PEZZATO, L. E.; BARROS, M. M.; ROCHA, D. F.; KLEEMAN, G. K.; ROSA, M. J. S. Energia e nutrientes digestíveis de alimentos para a tilápia do nilo. Boletim do Instituto de Pesca, v. 35, n. 2, p. 201-213, 2009.
GUIMARÃES, I. G.; PEZZATO, L. E.; BARROS, M. M. Amino acid availability and protein digestibility of several protein sources for Nile tilapia, Oreochromis niloticus. Aquaculture Nutrition, v. 14, n. 5, p. 396-404, 2008.
HUA, K.; BUREAU, D. P. Modelling digestible phosphorus content of salmonid fish feeds. Aquaculture, v. 254, n. 1-4, p. 455-465, 2006.
HUA, K.; BUREAU, D. P. Development of a model to estimate digestible lipid content of salmonid fish feeds. Aquaculture, v. 286, n. 3-4, p. 271-276, 2009a.
HUA, K.; BUREAU, D. P. A mathematical model to explain variations in estimates of starch digestibility and predict digestible starch content of salmonid fish feeds. Aquaculture, v. 294, n. 3-4, p. 282-287, 2009b. KÖPRÜCÜ, K.; ÖZDEMIR, Y. Apparent digestibility of selected feed ingredients for Nile tilapia (Oreochromis niloticus). Aquaculture, v. 250, n. 1-2, p. 308-316, 2005. MAINA, J. G.; BEAMES, R. M.; HIGGS, D.; MBUGUA, P. N.; IWAMA, G.; KISIA, S. M. Digestibility and feeding value of some feed ingredients fed to tilapia Oreochromis niloticus (L.). Aquaculture Research, v. 33, n. 11, p. 853-862, 2002.
niloticus). Revista Brasileira de Zootecnia, v. 32, n. 6, p. 1801-1809, 2003.
PEZZATO, L. E.; MIRANDA, E. C. D.; BARROS, M. M.; PINTO, L. G. Q.; FURUYA, W. M.; PEZZATO, A. C. Digestibilidade aparente de ingredientes pela tilápia do Nilo (Oreochromis niloticus). Revista Brasileira de Zootecnia, v. 31, n. 4, p. 1595-1604, 2002.
SAKOMURA, N. K.; ROSTAGNO, H. S. Métodos de pesquisa em nutrição de monogástricos. 1. ed. Jaboticabal: Funep, 2007.
SALES, J. The use of linear regression to predict digestible protein and available amino acid contents of feed ingredients and diets for fish. Aquaculture, v. 278, n. 1-4, p. 128-142, 2008.
SALES, J. Linear models to predict the digestible lipid content of fish diets. Aquaculture Nutrition, v. 15, n. 5, p. 537-549, 2009a.
SALES, J. Prediction of digestible energy content across feed ingredients and fish species by linear regression. Fish Physiology and Biochemistry, v. 35, n. 4, p. 551-565, 2009b.
SAMPAIO, F. G.; HISANO, H.; YAMAKI, R. A.; KLEEMANN, G. K.; PEZZATO, L. E.; BARROS, M. M. Digestibilidade aparente das farinhas de peixe nacional e importada e das farinhas de sangue tostada e spray-dried, pela tilápia do Nilo, Oreochromis niloticus (L.). Acta Scientiarum. Animal Sciences, v. 23, n. 4, p. 891-896, 2001.
SKLAN, D.; PRAG, T.; LUPATSCH, I. Apparent digestibility coefficients of feed ingredients and their prediction in diets for tilapia Oreochromis niloticus x Oreochromis aureus (Teleostei, Cichlidae). Aquaculture Research, v. 35, n. 4, p. 358-364, 2004. VÁSQUEZ-TORRES, W.; YOSSA PERDOMO, M. I.; HERNÁNDEZ ARÉVALO, G.; GUTIÉRREZ ESPINOSA, M. C. Digestibilidad aparente de ingredientes de uso común en la fabricación de raciones balanceadas para tilapia roja híbrida (Oreochromis sp.). Revista Colombiana de Ciencias Pecuarias, v. 23, n. 2, p. 207-216, 2010.
WILSON, R. P. Amino acids and proteins. In: HALVER, J. E.; HARDY, R. W. (Ed.). Fish Nutrition. 3rd ed. San Diego: Academic Press, 2002. p. 144-181.
Received on May 2, 2011. Accepted on November 28, 2011.